
k8s全方位监控-prometheus部署
1、k8s 监控资源对象
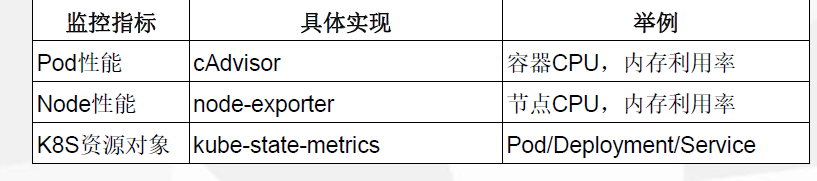
2、 prometheus简单介绍。 https://github.com/prometheus
•多维数据模型:由度量名称和键值对标识的时间序列数据
•PromSQL:一种灵活的查询语言,可以利用多维数据完成复杂的查询
•不依赖分布式存储,单个服务器节点可直接工作
•基于HTTP的pull方式采集时间序列数据
•推送时间序列数据通过PushGateway组件支持
•通过服务发现或静态配置发现目标
•多种图形模式及仪表盘支持(grafana)
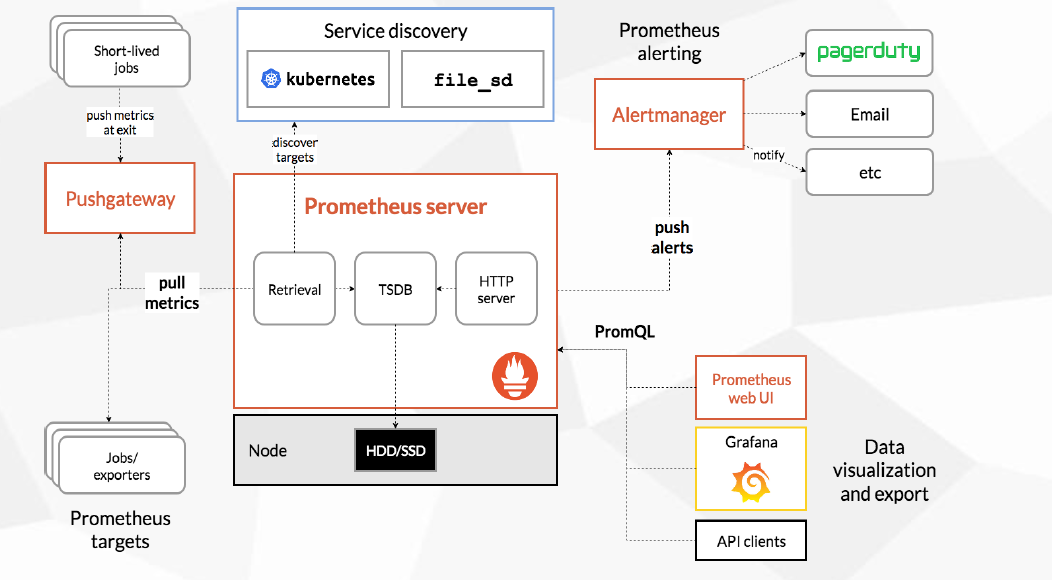
组件介绍:
3、prometheus 部署。
[root@VM_0_48_centos prometheus]# cat  prometheus-statefulset.yaml

apiVersion: apps/v1

kind: StatefulSet

metadata:

  name: prometheus

  namespace: kube-system

  labels:

    k8s-app: prometheus

    kubernetes.io/cluster-service: "true"

    addonmanager.kubernetes.io/mode: Reconcile

    version: v2.2.1

spec:

  serviceName: "prometheus"

  replicas: 1

  podManagementPolicy: "Parallel"

  updateStrategy:

   type: "RollingUpdate"

  selector:

    matchLabels:

      k8s-app: prometheus

  template:

    metadata:

      labels:

        k8s-app: prometheus

      annotations:

        scheduler.alpha.kubernetes.io/critical-pod: ''

    spec:

      priorityClassName: system-cluster-critical

      serviceAccountName: prometheus

      initContainers:

      - name: "init-chown-data"

        image: "busybox:latest"

        imagePullPolicy: "IfNotPresent"

        command: ["chown", "-R", "65534:65534", "/data"]

        volumeMounts:

        - name: prometheus-data

          mountPath: /data

          subPath: ""

      containers:

        - name: prometheus-server-configmap-reload

          image: "jimmidyson/configmap-reload:v0.1"

          imagePullPolicy: "IfNotPresent"

          args:

            - --volume-dir=/etc/config

            - --webhook-url=http://localhost:9090/-/reload

          volumeMounts:

            - name: config-volume

              mountPath: /etc/config

              readOnly: true

          resources:

            limits:

              cpu: 10m

              memory: 10Mi

            requests:

              cpu: 10m

              memory: 10Mi

        - name: prometheus-server

          image: "prom/prometheus:v2.2.1"

          imagePullPolicy: "IfNotPresent"

          args:

            - --config.file=/etc/config/prometheus.yml

            - --storage.tsdb.path=/data

            - --web.console.libraries=/etc/prometheus/console_libraries

            - --web.console.templates=/etc/prometheus/consoles

            - --web.enable-lifecycle

          ports:

            - containerPort: 9090

          readinessProbe:

            httpGet:

              path: /-/ready

              port: 9090

            initialDelaySeconds: 30

            timeoutSeconds: 30

          livenessProbe:

            httpGet:

              path: /-/healthy

              port: 9090

            initialDelaySeconds: 30

            timeoutSeconds: 30

          # based on 10 running nodes with 30 pods each

          resources:

            limits:

              cpu: 200m

              memory: 1000Mi

            requests:

              cpu: 200m

              memory: 1000Mi

          volumeMounts:

            - name: config-volume

              mountPath: /etc/config

            - name: prometheus-data

              mountPath: /data

              subPath: ""

      terminationGracePeriodSeconds: 300

      volumes:

        - name: config-volume

          configMap:

            name: prometheus-config

        - name: prometheus-data

          persistentVolumeClaim:

            claimName: prometheus-claim   #采用静态PV,必须现部署
[root@VM_0_48_centos prometheus]# cat   prometheus-service.yaml

kind: Service

apiVersion: v1

metadata:

  name: prometheus

  namespace: kube-system

  labels:

    kubernetes.io/name: "Prometheus"

    kubernetes.io/cluster-service: "true"

    addonmanager.kubernetes.io/mode: Reconcile

spec:

  type: NodePort  #使用NodePort  访问

  ports:

    - name: http

      port: 9090

      protocol: TCP

      targetPort: 9090

  selector:

    k8s-app: prometheus
[root@VM_0_48_centos ~]# kubectl  get svc  -n kube-system |grep prometheus

prometheus             NodePort    10.0.0.94    <none>        9090:48403/TCP           39h

k8s全方位监控-prometheus部署的更多相关文章
- k8s全方位监控 -prometheus实现短信告警接口编写(python)
1.prometheus短信告警接口实现(python)源码如下: import subprocess from flask import Flask from flask import reques ...
- k8s全方位监控-prometheus-alertmanager部署-配置第一条告警邮件
1.alertmanager告警插件部署 [root@VM_0_48_centos prometheus]# cat alertmanager-pvc.yaml apiVersion: v1 kind ...
- K8S(13)监控实战-部署prometheus
k8s监控实战-部署prometheus 目录 k8s监控实战-部署prometheus 1 prometheus前言相关 1.1 Prometheus的特点 1.2 基本原理 1.2.1 原理说明 ...
- k8s全方位监控-prometheus-配置文件介绍以及基于文件服务发现
1.scrape_configs 参数介绍 # 默认的全局配置 global: scrape_interval: 15s # 采集间隔15s,默认为1min一次 evaluation_interval ...
- k8s全方位监控中-常用rules配置
[root@VM_0_48_centos prometheus]# cat alertmanager-configmap.yaml apiVersion: v1 kind: ConfigMap met ...
- Prometheus 监控K8S Node监控
Prometheus 监控K8S Node监控 Prometheus社区提供的NodeExporter项目可以对主机的关键度量指标进行监控,通过Kubernetes的DeamonSet可以在各个主机节 ...
- K8S的Kafka监控(Prometheus+Grafana)
欢迎访问我的GitHub https://github.com/zq2599/blog_demos 内容:所有原创文章分类汇总及配套源码,涉及Java.Docker.Kubernetes.DevOPS ...
- k8s集群中部署prometheus server
1.概述 本文档主要介绍如何在k8s集群中部署prometheus server用来作为监控的数据采集服务器,这样做可以很方便的对k8s集群中的指标.pod的.节点的指标进行采集和监控. 2.下载镜像 ...
- Prometheus部署各服务的Node监控
1.部署监控主机 部署主机监控,需要安装node_exporter 1.1 下载node exporter wget https://github.com/prometheus/node_export ...
随机推荐
- 西安腾讯DevOps面试题python算法输出列表数值下界
给定一个列表,然后给一个目标值,列表中两数求和等于目标值,要求输出列表两数的下界 如 list = [1,2,3,4,6,7,8] num=10 #!/usr/bin/python #coding=u ...
- python 统计工作簿中每个人名出现的次数
工作簿 需求:统计人名出现的次数 代码: # coding=gbk import pandas as pd import re def extract_chinese(txt): pattern = ...
- Linux 学习2
1.配置好阿里云yum源生成yum缓存下载nginx,并且启动nginx服务,使用浏览器访问,nginx页面 yum源的工作目录是? https://www.cnblogs.com/dlh-lmsh/ ...
- 计算机网络-5-9-TCP拥塞控制
TCP拥塞控制 拥塞控制的一般原理 在计算机网络中的链路容量(带宽),交换节点中的缓存和处理机等,都是网络的资源,在某段时间,若对网络中某一资源的需求超过该资源所能提供的可用部分,网络性能就会变坏,这 ...
- linnux命令 - brctl和ifconfig
1.安装brctl centos7.6安装使用 yum install bridge-utils ubuntu使用 apt-get install bridge-utils 什么是网桥 网桥是一种在链 ...
- 恶补Java Swing线程刷新UI机制(由浅到深的参考大佬博文)
1. java中进度条不能更新问题的研究 感谢大佬:https://blog.csdn.net/smartcat86/article/details/2226681 为什么进度条在事件处理过程中不更新 ...
- Git重命名远程分支
一.重命名本地分支 将hot_fix分支重命名为bug_fix git branch -m hot_fix bug_fix 二.推送重命名后的本地分支到远程仓库 git push origin bug ...
- 从零开始, 开发一个 Web Office 套件 (3): 鼠标事件
这是一个系列博客, 最终目的是要做一个基于HTML Canvas 的, 类似于微软 Office 的 Web Office 套件, 包括: 文档, 表格, 幻灯片... 等等. 对应的Github r ...
- VNCTF 2022 cm cm1 RE复现
cm1 安卓逆向 JEB 直接跟进主函数找到 ASSERT里面拿到ooo文件 直接脚本解密 k = "vn2022" with open('ooo', 'rb') as f: c ...
- 编译安装&打包压缩&定时任务
内容概要 编译安装 打包压缩 定时任务 内容详细 一.编译安装 1.特点 使用源代码,编译打包软件. 1.可以自定制软件 2.按需构建软件啊 2.步骤 下载安装包 wget 下载网址 如果没有 ...