
python 使用 matplotlib.pyplot来画柱状图和饼图
导入包
import matplotlib.pyplot as plt
柱状图
最简柱状图
# 显示高度

def autolabel(rects):

    for rect in rects:

        height = rect.get_height()

        plt.text(rect.get_x()+rect.get_width()/2.- 0.2, 1.03*height, '%s' % int(height))

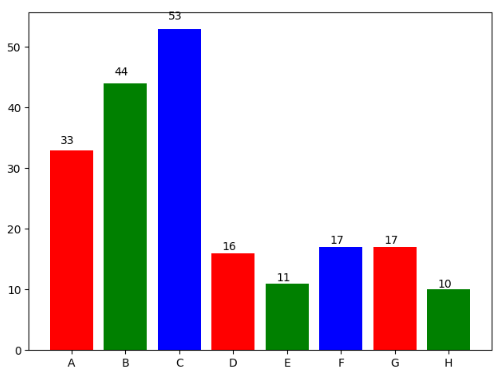
name_list = ['A', 'B', 'C', 'D', 'E', 'F', 'G', 'H']

num_list = [33, 44, 53, 16, 11, 17, 17, 10]

autolabel(plt.bar(range(len(num_list)), num_list, color='rgb', tick_label=name_list))

plt.show()
结果
堆叠柱状图
# 显示高度

def autolabel(rects1, rects2):

    i = 0

    for rect1 in rects1:

        rect2 = rects2[i]

        i += 1

        height = rect1.get_height() + rect2.get_height()

        plt.text(rect1.get_x()+rect1.get_width()/2. - 0.1, 1.03*height, '%s' % int(height))

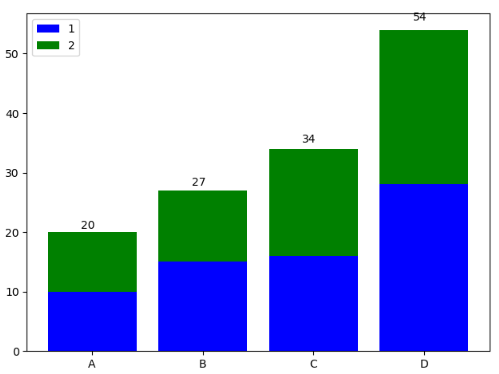
name_list = ['A', 'B', 'C', 'D']

num_list = [10, 15, 16, 28]

num_list2 = [10, 12, 18, 26]

z1 = plt.bar(range(len(num_list)), num_list, label='1', fc='b')

z2 = plt.bar(range(len(num_list)), num_list2, bottom=num_list, label='2', tick_label=name_list, fc='g')

autolabel(z1, z2)

plt.legend()

plt.show()
结果
并列柱状图
name_list = ['A', 'B', 'C', 'D']

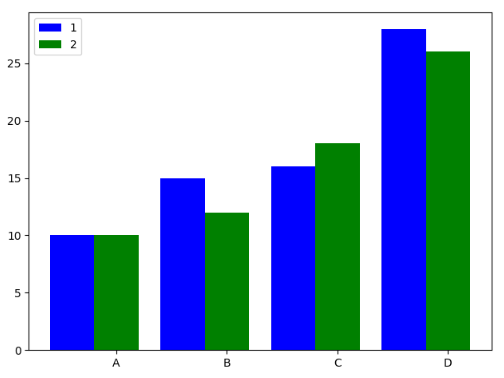
num_list = [10, 15, 16, 28]

num_list2 = [10, 12, 18, 26]

x = list(range(len(num_list)))

total_width, n = 0.8, 2

width = total_width / n

plt.bar(x, num_list, width=width, label='1', fc='b')

for i in range(len(x)):

    x[i] += width

plt.bar(x, num_list2, width=width, label='2', tick_label=name_list, fc='g')

plt.legend()

plt.show()
结果
饼图
最简饼图
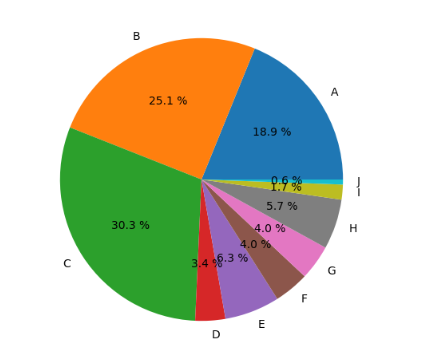
name_list = ['A', 'B', 'C', 'D', 'E', 'F', 'G', 'H', 'I', 'J']

num_list = [33, 44, 53, 6,11, 7, 7, 10, 3, 1]

# 保证圆形

plt.axes(aspect=1)

plt.pie(x=num_list, labels=name_list, autopct='%3.1f %%')

plt.show()
结果
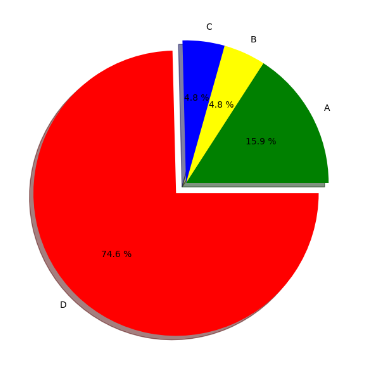
带切割的饼图
name_list = ['A', 'B', 'C', 'D']

num_list = [10, 3, 3, 47]

colors = ['green', 'yellow', 'blue', 'red']

# 圆形

plt.figure(1, figsize=(6, 6))

#决定分割部分,及其与其它部分之间的间距

expl = [0, 0, 0, 0.1]

plt.pie(x=num_list, explode=expl, labels=name_list, autopct='%3.1f %%', colors=colors, shadow=True)

plt.show()
结果
python 使用 matplotlib.pyplot来画柱状图和饼图的更多相关文章
- Python中matplotlib.pyplot.imshow画灰度图的多种方法
转载:https://www.jianshu.com/p/8f96318a153f matplotlib库的教程和使用方法此处就不累赘了,网上有十分多优秀的教程资源.此处直接上代码: def demo ...
- Python:matplotlib.pyplot
翻译总结自:matplotlib.pyplot - Matplotlib 3.4.3 documentation 函数 说明 acorr x的自相关性图 angle_spectrum 角度谱 anno ...
- python的matplotlib.pyplot绘制甘特图
博主本来就想简单地找一下代码,画一幅甘特图,结果百度之后发现甘特图的代码基本都不是用matplotlib库,但是像柱状图等统计图通常都是用这个库进行绘制的,所以博主就花了一些时间,自己敲了一份代码,简 ...
- python中matplotlib.pyplot中cm的属性
https://matplotlib.org/gallery/color/colormap_reference.html
- Python:matplotlib.cm 色表
官网:Choosing Colormaps in Matplotlib - Matplotlib 3.5.0 documentation Colormap与matplotlib.cm 我们以等高区域函 ...
- Python:Matplotlib 画曲线和柱状图(Code)
原文链接:http://blog.csdn.net/ikerpeng/article/details/20523679 参考资料:http://matplotlib.org/gallery.html ...
- python画柱状图并且输出到html文件
import matplotlibmatplotlib.use('Agg')import matplotlib.pyplot as pltfrom Cstring import StringIO y ...
- Python 的 Matplotlib 画图库
Matplotlib安装 NumPy库方便数值运算,但枯燥的数据并不利于人们的直观理解. 数据需要可视化. Matplotlib:一个数据可视化函数库 使用前需要安装 利用Python自带 ...
- Python 中 plt 画柱状图和折线图
1. 背景 Python在一些数据可视化的过程中需要使用 plt 函数画柱状图和折线图. 2. 导入 import matplotlib.pyplot as plt 3. 柱状图 array= np. ...
随机推荐
- hadoop一代集群运行代码案例
hadoop一代集群运行代码案例 集群 一个 master,两个slave,IP分别是192.168.1.2.192.168.1.3.192.168.1.4 hadoop版 ...
- 冲刺博客NO.3
今天做了什么:参考网上的一些登录界面,发现了Android studio自带loginActivity.做了基础登录界面 不停地上网搜,各种不会. 在短信验证功能上通过在Mob.com的集成文档和官 ...
- Nginx 实现端口转发
https://www.cnblogs.com/zhaoyingjie/p/7248678.html Nginx 实现端口转发 什么是端口转发 当我们在服务器上搭建一个图书以及一个电影的应用,其中图书 ...
- ClientDataSet 心得
1. 与TTable.TQuery一样,TClientDataSet也是从TDataSet继承下来的,它通常用于多层体系结构的客户端.很多数据库应用程序都用了BDE,BDE往往给发布带来很大的不便 ...
- mysql 幻象读
[sql] view plain copy CREATE TABLE `t100` ( `id` bigint(20) NOT NULL default '0', `value` varchar(32 ...
- 第42件事 移动App设计的11大法则
移动App设计的重要法则指的是我们在设计App需要遵守的一些设计规范和法则,这些法则就好像一些行为规范一样. 1.导航手机客户端上的主导航(一级导航)如图6-22所示. 对图6-22中所示的几个主导航 ...
- ovs QOS
实验拓扑 拓扑实现脚本 ip netns add ns1 ip netns add ns2 ip netns add ns3 ip netns add ns4 ovs-vsctl add-br br0 ...
- ssh连接卡在【To escape to local shell, press 'Ctrl+Alt+]'.】的解决方法
一.现象 1.使用xshell连接远程主机的时候一直卡在To escape to local shell, press 'Ctrl+Alt+]'.,要等很久才能连上: Connecting to 19 ...
- UICollectionView设置首个cell默认选中(二)
上篇对于UICollectionView默认选中cell采取的是每个cell分别对应一个标识,也就代表着废除了UICollectionView的重用机制.对于较少的数据情况是可以的,但是对于数据比较大 ...
- Vue+WebSocket+ES6+Canvas 制作「你画我猜」小游戏
Vue+WebSocket+ES6+Canvas 制作「你画我猜」小游戏 转载 来源:jrainlau 链接:https://segmentfault.com/a/1190000005804860 项 ...