
Grid search in the tidyverse
@drsimonj here to share a tidyverse method of grid search for optimizing a model’s hyperparameters.
Grid Search
For anyone who’s unfamiliar with the term, grid search involves running a model many times with combinations of various hyperparameters. The point is to identify which hyperparameters are likely to work best. A more technical definition from Wikipedia, grid search is:
an exhaustive searching through a manually specified subset of the hyperparameter space of a learning algorithm
What this post isn’t about
To keep the focus on grid search, this post does NOT cover…
- k-fold cross-validation. Although a practically essential addition to grid search, I’ll save the combination of these techniques for a future post. If you can’t wait, check out my last post for some inspiration.
- Complex learning models. We’ll stick to a simple decision tree.
- Getting a great model fit. I’ve deliberately chosen input variables and hyperparameters that highlight the approach.
Decision tree example
Say we want to run a simple decision tree to predict cars’ transmission type (am) based on their miles per gallon (mpg) and horsepower (hp) using themtcars data set. Let’s prep the data:
library(tidyverse)

d <- mtcars %>%

       # Convert `am` to factor and select relevant variables

       mutate(am = factor(am, labels = c("Automatic", "Manual"))) %>%

       select(am, mpg, hp)

ggplot(d, aes(mpg, hp, color = am)) +

  geom_point()
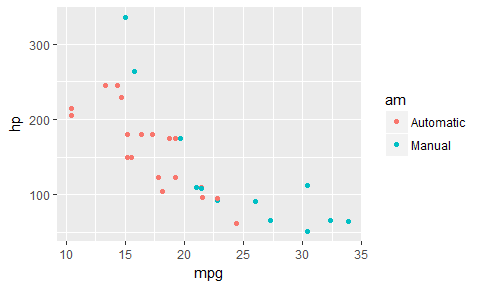
For a decision tree, it looks like a step-wise function until mpg > 25, at which point it’s all Manual cars. Let’s grow a full decision tree on this data:
library(rpart)

library(rpart.plot)

# Set minsplit = 2 to fit every data point

full_fit <- rpart(am ~ mpg + hp, data = d, minsplit = 2)

prp(full_fit)
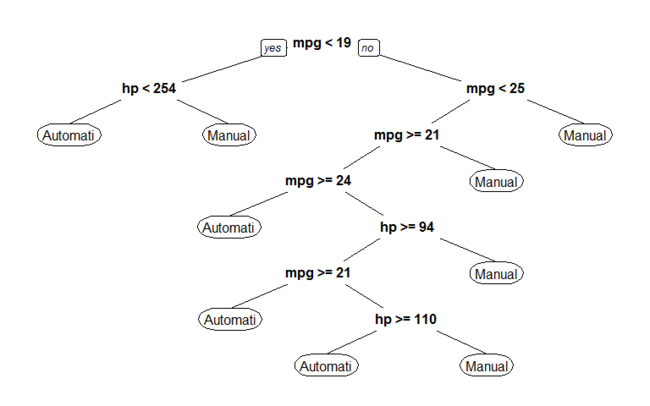
We don’t want a model like this, as it almost certainly has overfitting problems. So the question becomes, which hyperparameter specifications would work best for our model to generalize?
Training-Test Split
To help validate our hyperparameter combinations, we’ll split our data into training and test sets (in an 80/20 split):
set.seed(245)

n <- nrow(d)

train_rows <- sample(seq(n), size = .8 * n)

train <- d[ train_rows, ]

test  <- d[-train_rows, ]
Create the Grid
Step one for grid search is to define our hyperparameter combinations. Say we want to test a few values for minsplit and maxdepth. I like to setup the grid of their combinations in a tidy data frame with a list and cross_d as follows:
# Define a named list of parameter values

gs <- list(minsplit = c(2, 5, 10),

           maxdepth = c(1, 3, 8)) %>%

  cross_d() # Convert to data frame grid

gs

#> # A tibble: 9 × 2

#>   minsplit maxdepth

#>      <dbl>    <dbl>

#> 1        2        1

#> 2        5        1

#> 3       10        1

#> 4        2        3

#> 5        5        3

#> 6       10        3

#> 7        2        8

#> 8        5        8

#> 9       10        8
Note that the list names are the names of the hyperparameters that we want to adjust in our model function.
Create a model function
We’ll be iterating down the gs data frame to use the hyperparameter values in a rpart model. The easiest way to handle this is to define a function that accepts a row of our data frame values and passes them correctly to our model. Here’s what I’ll use:
mod <- function(...) {

  rpart(am ~ hp + mpg, data = train, control = rpart.control(...))

}
Notice the argument ... is being passed to control in rpart, which is where these hyperparameters can be used.
Fit the models
Now, to fit our models, use pmap to iterate down the values. The following is iterating through each row of our gs data frame, plugging the hyperparameter values for that row into our model.
gs <- gs %>% mutate(fit = pmap(gs, mod))

gs

#> # A tibble: 9 × 3

#>   minsplit maxdepth         fit

#>      <dbl>    <dbl>      <list>

#> 1        2        1 <S3: rpart>

#> 2        5        1 <S3: rpart>

#> 3       10        1 <S3: rpart>

#> 4        2        3 <S3: rpart>

#> 5        5        3 <S3: rpart>

#> 6       10        3 <S3: rpart>

#> 7        2        8 <S3: rpart>

#> 8        5        8 <S3: rpart>

#> 9       10        8 <S3: rpart>
Obtain accuracy
Next, let’s assess the performance of each fit on our test data. To handle this efficiently, let’s write another small function:
compute_accuracy <- function(fit, test_features, test_labels) {

  predicted <- predict(fit, test_features, type = "class")

  mean(predicted == test_labels)

}
Now apply this to each fit:
test_features <- test %>% select(-am)

test_labels   <- test$am

gs <- gs %>%

  mutate(test_accuracy = map_dbl(fit, compute_accuracy,

                                 test_features, test_labels))

gs

#> # A tibble: 9 × 4

#>   minsplit maxdepth         fit test_accuracy

#>      <dbl>    <dbl>      <list>         <dbl>

#> 1        2        1 <S3: rpart>     0.7142857

#> 2        5        1 <S3: rpart>     0.7142857

#> 3       10        1 <S3: rpart>     0.7142857

#> 4        2        3 <S3: rpart>     0.8571429

#> 5        5        3 <S3: rpart>     0.8571429

#> 6       10        3 <S3: rpart>     0.7142857

#> 7        2        8 <S3: rpart>     0.8571429

#> 8        5        8 <S3: rpart>     0.8571429

#> 9       10        8 <S3: rpart>     0.7142857
Arrange results
To find the best model, we arrange the data based on desc(test_accuracy). The best fitting model will then be in the first row. You might see above that we have many models with the same fit. This is unusual, and likley due to the example I’ve chosen. Still, to handle this, I’ll break ties in accuracy withdesc(minsplit) and maxdepth to find the model that is most accurate and also simplest.
gs <- gs %>% arrange(desc(test_accuracy), desc(minsplit), maxdepth)

gs

#> # A tibble: 9 × 4

#>   minsplit maxdepth         fit test_accuracy

#>      <dbl>    <dbl>      <list>         <dbl>

#> 1        5        3 <S3: rpart>     0.8571429

#> 2        5        8 <S3: rpart>     0.8571429

#> 3        2        3 <S3: rpart>     0.8571429

#> 4        2        8 <S3: rpart>     0.8571429

#> 5       10        1 <S3: rpart>     0.7142857

#> 6       10        3 <S3: rpart>     0.7142857

#> 7       10        8 <S3: rpart>     0.7142857

#> 8        5        1 <S3: rpart>     0.7142857

#> 9        2        1 <S3: rpart>     0.7142857
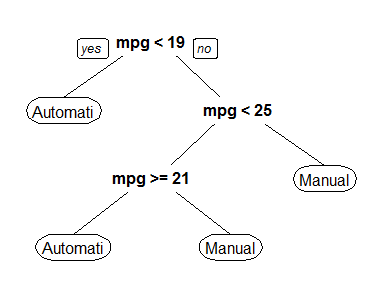
It looks like a minsplit of 5 and maxdepth of 3 is the way to go!
To compare to our fully fit tree, here’s a plot of this top-performing model. Remember, it’s in the first row so we can reference [[1]].
prp(gs$fit[[1]])
Food for thought
Having the results in a tidy data frame lets us do a lot more than just pick the optimal hyperparameters. It lets us quickly wrangle with and visualize the results of the various combinations. Here are some ideas:
- Search among the top performers for the simplest model.
- Plot performance across the hyperparameter combinations.
- Save time by restricting the hypotheses before model fitting. For example, in a large data set, it’s practically pointless to try a small
minsplitand smallmaxdepth. In this case, before fitting the models, we canfilterthegsdata frame to exclude certain combinations.
Sign off
Thanks for reading and I hope this was useful for you.
For updates of recent blog posts, follow @drsimonj on Twitter, or email me atdrsimonjackson@gmail.com to get in touch.
If you’d like the code that produced this blog, check out the blogR GitHub repository.
转自:https://drsimonj.svbtle.com/grid-search-in-the-tidyverse
Grid search in the tidyverse的更多相关文章
- Comparing randomized search and grid search for hyperparameter estimation
Comparing randomized search and grid search for hyperparameter estimation Compare randomized search ...
- 3.2. Grid Search: Searching for estimator parameters
3.2. Grid Search: Searching for estimator parameters Parameters that are not directly learnt within ...
- How to Grid Search Hyperparameters for Deep Learning Models in Python With Keras
Hyperparameter optimization is a big part of deep learning. The reason is that neural networks are n ...
- Grid Search学习
转自:https://www.cnblogs.com/ysugyl/p/8711205.html Grid Search:一种调参手段:穷举搜索:在所有候选的参数选择中,通过循环遍历,尝试每一种可能性 ...
- grid search 超参数寻优
http://scikit-learn.org/stable/modules/grid_search.html 1. 超参数寻优方法 gridsearchCV 和 RandomizedSearchC ...
- scikit-learn:3.2. Grid Search: Searching for estimator parameters
參考:http://scikit-learn.org/stable/modules/grid_search.html GridSearchCV通过(蛮力)搜索參数空间(參数的全部可能组合).寻找最好的 ...
- [转载]Grid Search
[转载]Grid Search 初学机器学习,之前的模型都是手动调参的,效果一般.同学和我说他用了一个叫grid search的方法.可以实现自动调参,顿时感觉非常高级.吃饭的时候想调参的话最差不过也 ...
- grid search
sklearn.metrics.make_scorer(score_func, greater_is_better=True, needs_proba=False, needs_threshold=F ...
- Hackerrank - The Grid Search
https://www.hackerrank.com/challenges/the-grid-search/forum 今天碰见这题,看见难度是Moderate,觉得应该能半小时内搞定. 读完题目发现 ...
随机推荐
- VS Code 的常用快捷键
VS Code 的常用快捷键和插件 一.vs code 的常用快捷键 1.注释: a) 单行注释:[ctrl+k,ctrl+c] 或 ctrl+/ b) 取消单行注释:[ctrl+k,ctrl+u] ...
- MySQL元数据库——information_schema
平时使用MySQL客户端操作数据库的同学,只要稍微留神都会发现,除了我们建的库之外,还经常看到三个数据库的影子: 1. information_schema 2. performance_schema ...
- backdrop-filter 和filter 写出高斯模糊效果 以及两者区别
http://www.w3cplus.com/css3/advanced-css-filters.html: backdrop-filter:blur(10px);只支持ios端:只作用于当前元素: ...
- sql server 数值的四舍五入
sql中的四舍五入通常会有round 和cast( …… as decimal())两种方式: 个人建议使用cast 方式: 方式1: 经过试验,同样都可以做到四舍五入,但round如下实例1会报 ...
- jdk8的新特性 Lambda表达式
很多同学一开始接触Java8可能对Java8 Lambda表达式有点陌生. //这是一个普通的集合 List<Employee> list = em.selectEmployeeByLog ...
- linux C/C++ 日志打印函数
//宏定义日志文件名 #define PROCESSNAME "log_filename" //当日志文件大于5M时,会删除该文件,该接口使用方法 参照printfvoid Wr ...
- linux下删除乱码文件、目录
由于编码原因,在linux服务器上上传.创建中文文件或目录时,会产生乱码,如果想删除它,发现用rm命令是删除不了的 这种情况下,用find命令可以删除乱码的文件或目录. 首先进入乱码文件或目录所在的目 ...
- .net软件反编译笔记
在软件的破解及源码获取及重新编译的道路上会遇到一些问题,书此备查. 大名鼎鼎的Reflector以及开源的ILSPY都是.NET程序集的反编译利器,但是它们不能为你做全部的工作. 0x01: 遇到反编 ...
- MATLAB下跑Faster-RCNN+ZF实验时如何编译自己需要的external文件
本篇文章主讲这篇博客中的(http://blog.csdn.net/sinat_30071459/article/details/50546891)的这个部分,如图所示 注:截图来自 小咸鱼_ 的博客 ...
- 磁盘IO:缓存IO与直接IO
文件系统IO分为DirectIO和BufferIO,其中BufferIO也叫Normal IO. 1. 缓存IO 缓存I/O又被称作标准I/O,大多数文件系统的默认I/O操作都是缓存I/O.在Linu ...