017:磁盘I/0介绍和测试
一. 磁盘
1. 磁盘的访问模式
- 顺序访问
- 顺序的访问磁盘上的块;
- 一般经过测试后,得到该值的单位是
MB/s,表示为磁盘带宽,普通硬盘在 50~ 100 MB/s
- 随机访问
- 随机的访问磁盘上的块
- 也可以用MB/s进行表示,但是通常使用
IOPS(每秒处理IO的能力),普通硬盘在 100-200 IOPS
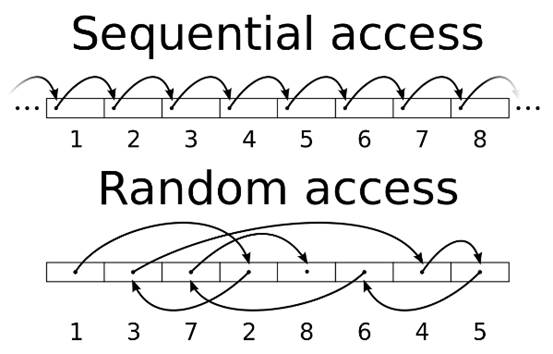
拷贝文件属于顺序访问,
数据库中访问数据属于随机访问。
2. 磁盘的分类
HDD
- 盘片通过旋转,磁头进行定位,读取数据;
- 顺序性较好,随机性较差;
- 常见转速
- 笔记本硬盘:5400转/分钟;
- 桌面硬盘:7200转/分钟;
- 服务器硬盘:10000转/分钟、15000转/分钟;
- SATA:120 ~ 150 IOPS
- SAS :150 ~ 200 IOPS
从理论上讲,15000转/分钟,最高是 15000/60 约等于250IOPS
由于机械盘片需要旋转,转速太高无法很好的散热如果一个HDD对4K的块做随机访问是0.8MB/s,可通过
0.8 *(1 / 4)= 200或者(0.8 * 1000) / 4=200得到IOPS,但是这个值存在部分干扰因素,如cache等SSD
纯电设备
由FLash Memory组成
没有读写磁头
MLC闪存颗粒对一般企业的业务够用。目前SLC闪存颗粒价格较贵
IOPS高
50000+ IOPS
读写速度非对称 以 INTEL SSD DC-S3500为例子:
- Random 4KB3 Reads: Up to 75,000 IOPS
- Random 4KB Writes: Up to 11,500 IOPS
- Random 8KB3 Reads: Up to 47,500 IOPS
- Random 8KB Writes: Up to 5,500 IOPS
当写入数据时,要先擦除老数据,再写入新数据
擦除数据需要擦除整个区域(128K or 256K)一起擦除(自动把部分有用的数据挪到别的区域)
对比发现4K性能要优于8K的性能,几乎是2倍的差距,当然16K就更明显,所以当使用SSD时,建议数据库页大小设置成4K或者是8K,
innodb_page_size=8K)
上线以前,SSD需要经过严格的压力测试(一周时间),确保性能平稳
Endurance Rating
- 表示该SSD的寿命是多少
- 比如450TBW,表示这个SSD可以反复写入的数据总量是450T(包括添加和更新)
SSD线上参数设置
磁盘调度算法改为Deadline
echo deadline > /sys/block/sda/queue/scheduler # deadline适用于数据库,HDD也建议改成Deadline
MySQL参数
innodb_log_file_size=4G该参数设置的尽可能大innodb_flush_neighbors=0
性能更平稳,且至少有15%的性能提升
SSD 品牌推荐
- Intel
- FusionIO
- 宝存
不是很建议使用PCI-E的Flash卡(PCI-E插槽的SSD)
- 性能过剩
- 安装比较麻烦
3. 提升IOPS性能的手段
通过 RAID 技术
- 功耗较高
- IOPS在2000左右
通过购买共享存储设备
- 价格非常昂贵
- 但是比较稳定
- 底层还是通过RAID实现
直接使用SSD
- 性能较好的SSD可以达到
万级别的IOPS - 建议可以用SSD + RAID5,RAID1+0太奢侈
- 性能较好的SSD可以达到
4. RAID类别
- RAID0
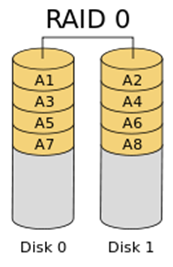
- 速度最快

- 没有冗余备份
- RAID1
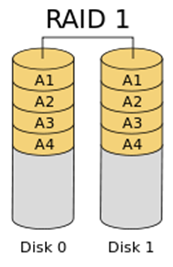
- 可靠性高

- 读取速度理论上等于硬盘数量的倍数

- 容量等于一个硬盘的容量
- RAID5
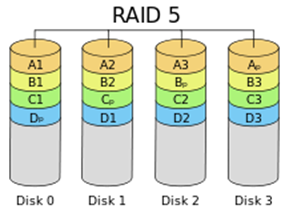
- 至少要3块硬盘

- 通过对数据的奇偶检验信息存储到不同的磁盘上,来恢复数据,最多只能坏一块

- 属于折中方案
- RAID6
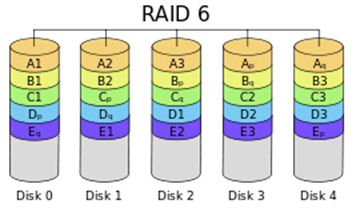
- 至少是4块硬盘

- 和RAID5比较,RAID6增加第二个独立的奇偶校验信息,写入速度略受影响

- 数据可靠性高,可以同时坏两块

- 由于使用了双校验机制,恢复数据速度较慢
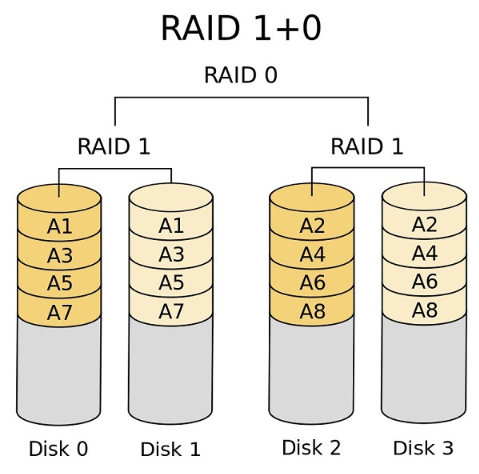
- RAID1+0 和 RAID 0+1
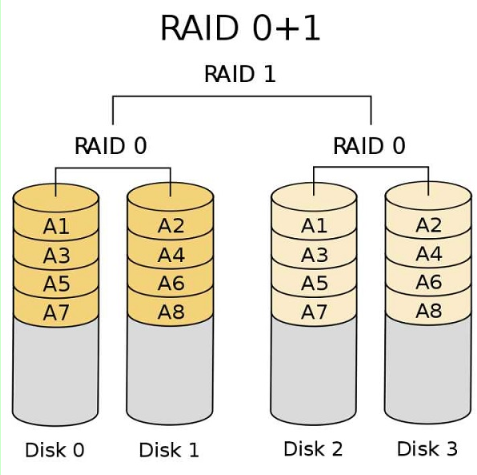
- RAID01又称为RAID0+1,先进行条带存放(RAID0),再进行镜像(RAID1);安全性相对比较低,假设DISK0损坏,这时左边的条带将无法读取。在剩下的3块盘中,只要DISK2,DISK3两个盘中任何一个损坏,都会导致整个RAID失效,我们可简单计算故障率为2/3。

- RAID10又称为RAID1+0,先进行镜像(RAID1),再进行条带存放(RAID0),安全性相对比较高,我们假设当DISK0损坏时,在剩下的3块盘中,只有当DISK1一个盘发生故障时,才会导致整个RAID失效,我们可简单计算故障率为1/3。
- RAID5+0
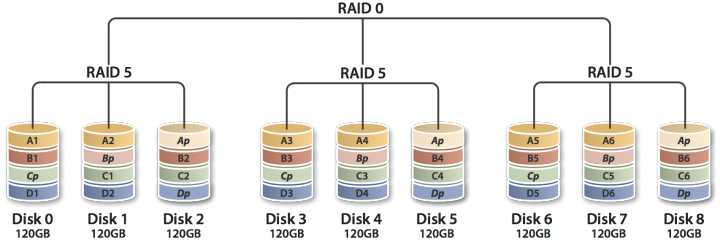
- 把两块raid5做成raid0,每个raid5卷有自己的校验盘,这样总共需要2个校验盘。浪费两块磁盘的空间。

- 允许坏掉两块磁盘,但不能是一个raid5里的两块。

- 最少需要6块硬盘
5. RAID卡
BBU
- Battery Backup Unit
- 目前几乎所有RAID卡都带BBU
- 需要电池保证写入的可靠性(在断电后,将RAID卡
内存中的缓存的数据刷入到磁盘) - 电池有充放电时间 (30天左右一个周期,充放电会切换成 Write Through,导致性能下降)
- 使用
闪存(Flash)的方式,就不会有充放电性能下降的问题
- 使用
RAID卡缓存
- Write Backup (
强烈建议开启缓存) - Write Through (不使用缓存,直接写入)
- Write Backup (
LSI-RAID卡相关命令
查看电量百分比
[root@test_raid ~]# megacli -AdpBbuCmd -GetBbuStatus -aALL |grep "Relative State of Charge"

Relative State of Charge: 100 %
查看充电状态
[root@test_raid ~]# megacli -AdpBbuCmd -GetBbuStatus -aALL |grep "Charger Status"

Charger Status: Complete
查看缓存策略
[root@test_raid ~]# megacli -LDGetProp -Cache -LALL -a0

Adapter 0-VD 0(target id: 0): Cache Policy:WriteBack, ReadAdaptive, Direct, No Write Cache if bad BBU
6. 文件系统和操作系统
文件系统
- XFS/EXT4
- noatime (不更新文件的atime标记,减少系统的IO访问)
- nobarrier (禁用barrier,可以提高性能,前提是使用write backup和使用BBU)
mount -o noatime,nobarrier /dev/sda1 /data
操作系统
- 推荐Linux
- 关闭SWAP
二. Linux I/0调度算法
1. CFQ
CFQ把I/O请求
按照进程分别放入进程对应的队列中,所以A进程和B进程发出的I/O请求会在两个队列中。而各个队列内部仍然采用合并和排序的方法,区别仅在于,每一个提交I/O请求的进程都有自己的I/O队列。
CFQ的“公平”是针对进程而言的,它以时间片算法为前提,轮转调度队列,默认从当前队列中取4个请求处理,然后处理下一个队列的4个请求。这样就可以确保每个进程享有的I/O资源是均衡的。
CFQ的缺点是先来的IO请求不一定能被及时满足,可能出现饥饿的情况。
CFQ Wiki
2. Deadline
同CFQ一样,除了维护一个拥有合并和排序功能的请求队列以外,还额外维护了两个队列,分别是
读请求队列和写请求队列,它们都是带有超时的FIFO队列。当新来一个I/O请求时,会被同时插入普通队列和读/写队列,然后处理普通队列中的请求。当调度器发现读/写请求队列中的请求超时的时候,会优先处理这些请求,保证尽可能不产生请求饥饿
在DeadLine算法中,每个I/O请求都有一个超时时间,默认读请求是500ms,写请求是5s。
Deadline Wiki
3. Noop
Noop做的事情非常简单,它不会对I/O请求排序也不会进行任何其它优化(除了合并)。Noop除了对请求合并以外,不再进行任何处理,直接以类似FIFO的顺序提交I/O请求。
Noop面向的不是普通的块设备,而是随机访问设备(例如SSD),对于这种设备,不存在传统的寻道时间,那么就没有必要去做那些多余的为了减少寻道时间而采取的事情了。
Noop Wiki
三. MySQL的IO使用情况
1.iostat
#

# 安装 iostat

#

shell> yum install sysstat

# debian 系: apt-get install sysstat

# 使用

shell> iostat -xm 3 # x表示显示扩展统计信息,m表示以兆为单位显示,3表示每隔3秒显示

# 输出如下:

avg-cpu:  %user   %nice %system %iowait  %steal   %idle

           0.58    0.00    0.33    0.00    0.00   99.08

Device:         rrqm/s   wrqm/s     r/s     w/s    rMB/s    wMB/s avgrq-sz avgqu-sz   await r_await w_await  svctm  %util

sda               0.00     0.00    0.00    0.67     0.00     0.00     8.00     0.00    2.00    0.00    2.00   1.00   0.07

sdb               0.00     0.00    0.00    0.00     0.00     0.00     0.00     0.00    0.00    0.00    0.00   0.00   0.00
| CPU属性 | 说明 |
|---|---|
| %user | CPU处在用户模式下的时间百分比 |
| %nice | CPU处在带NICE值的用户模式下的时间百分比 |
| %sys | CPU处在系统模式下的时间百分比 |
| %iowait | CPU等待IO完成时间的百分比 |
| %steal | 管理程序维护另一个虚拟处理器时,虚拟CPU的无意的等待时间的百分比 |
| %idle | 闲置cpu的百分比 |
提示:
如果%iowait的值过高,表示硬盘存在I/O瓶颈;
如果%idle值高,表示CPU较空闲,如果%idle值高但系统响应慢时,有可能是CPU等待分配内存,此时应加大内存容量。
如果%idle值如果持续很低,那么系统的CPU处理能力相对较低,表明系统中最需要解决的资源是CPU。
| Device属性 | 说明 |
|---|---|
| rrqm/s | 每秒进行 merge 的读操作数目 |
| wrqm/s | 每秒进行 merge 的写操作数目 |
| r/s | 每秒完成的读 I/O 设备次数 |
| w/s | 每秒完成的写 I/O 设备次数 |
| rsec/s | 每秒读扇区数 |
| wsec/s | 每秒写扇区数 |
| rkB/s | 每秒读K字节数 |
| wkB/s | 每秒写K字节数 |
| avgrq-sz | 平均每次设备I/O操作的数据大小 (扇区) |
| avgqu-sz | 平均I/O队列长度 |
| await | 平均每次设备I/O操作的等待时间 (毫秒) |
| svctm | 平均每次设备I/O操作的服务时间 (毫秒) |
| %util | 一秒中有百分之多少的时间用于 I/O 操作,即被io消耗的cpu百分比 |
提示:
如果%util接近 100%,说明产生的I/O请求太多,I/O系统已经满负荷,该磁盘可能存在瓶颈。
如果svctm比较接近await,说明 I/O 几乎没有等待时间;
如果await远大于svctm,说明I/O队列太长,io响应太慢,则需要进行必要优化。
如果avgqu-sz比较大,也表示有当量io在等待。
shell> iotop -u mysql # -u 表示监控哪个user的进程,所以前提是你的mysql服务是用mysql用户启动的
注意:
上述命令只能看到MySQL的线程ID(Thread ID)
2. performance_schema.threads
mysql> use performance_schema;

Database changed

mysql> desc threads;

+---------------------+---------------------+------+-----+---------+-------+

| Field               | Type                | Null | Key | Default | Extra |

+---------------------+---------------------+------+-----+---------+-------+

| THREAD_ID           | bigint(20) unsigned | NO   |     | NULL    |       | -- MySQL内部线程ID

| NAME                | varchar(128)        | NO   |     | NULL    |       |

| TYPE                | varchar(10)         | NO   |     | NULL    |       |

| PROCESSLIST_ID      | bigint(20) unsigned | YES  |     | NULL    |       |

| PROCESSLIST_USER    | varchar(32)         | YES  |     | NULL    |       |

| PROCESSLIST_HOST    | varchar(60)         | YES  |     | NULL    |       |

| PROCESSLIST_DB      | varchar(64)         | YES  |     | NULL    |       |

| PROCESSLIST_COMMAND | varchar(16)         | YES  |     | NULL    |       |

| PROCESSLIST_TIME    | bigint(20)          | YES  |     | NULL    |       |

| PROCESSLIST_STATE   | varchar(64)         | YES  |     | NULL    |       |

| PROCESSLIST_INFO    | longtext            | YES  |     | NULL    |       |

| PARENT_THREAD_ID    | bigint(20) unsigned | YES  |     | NULL    |       |

| ROLE                | varchar(64)         | YES  |     | NULL    |       |

| INSTRUMENTED        | enum('YES','NO')    | NO   |     | NULL    |       |

| HISTORY             | enum('YES','NO')    | NO   |     | NULL    |       |

| CONNECTION_TYPE     | varchar(16)         | YES  |     | NULL    |       |

| THREAD_OS_ID        | bigint(20) unsigned | YES  |     | NULL    |       | -- 操作系统的线程ID

+---------------------+---------------------+------+-----+---------+-------+

17 rows in set (0.00 sec)

mysql> select name,type,thread_id,thread_os_id from threads;

+----------------------------------------+------------+-----------+--------------+

| name                                   | type       | thread_id | thread_os_id |

+----------------------------------------+------------+-----------+--------------+

| thread/sql/main                        | BACKGROUND |         1 |         2481 |

| thread/sql/thread_timer_notifier       | BACKGROUND |         2 |         2482 |

| thread/innodb/io_read_thread           | BACKGROUND |         3 |         2486 |

| thread/innodb/io_read_thread           | BACKGROUND |         4 |         2487 |

| thread/innodb/io_read_thread           | BACKGROUND |         5 |         2488 |

| thread/innodb/io_write_thread          | BACKGROUND |         6 |         2489 |

| thread/innodb/io_write_thread          | BACKGROUND |         7 |         2490 |

| thread/innodb/io_write_thread          | BACKGROUND |         8 |         2491 |

| thread/innodb/io_write_thread          | BACKGROUND |         9 |         2492 |

| thread/innodb/page_cleaner_thread      | BACKGROUND |        10 |         2493 |

| thread/innodb/io_read_thread           | BACKGROUND |        11 |         2485 |

| thread/innodb/io_log_thread            | BACKGROUND |        12 |         2484 |

| thread/innodb/io_ibuf_thread           | BACKGROUND |        13 |         2483 |

| thread/innodb/srv_master_thread        | BACKGROUND |        15 |         2501 |  -- 主线程

| thread/sql/background                  | BACKGROUND |        16 |         2502 |

| thread/innodb/srv_purge_thread         | BACKGROUND |        17 |         2502 |

| thread/sql/background                  | BACKGROUND |        18 |         2503 |

| thread/innodb/srv_monitor_thread       | BACKGROUND |        19 |         2500 |

| thread/innodb/srv_error_monitor_thread | BACKGROUND |        20 |         2499 |

| thread/sql/background                  | BACKGROUND |        21 |         2504 |

| thread/sql/background                  | BACKGROUND |        22 |         2505 |

| thread/innodb/srv_lock_timeout_thread  | BACKGROUND |        23 |         2498 |

| thread/innodb/dict_stats_thread        | BACKGROUND |        24 |         2507 |

| thread/innodb/buf_dump_thread          | BACKGROUND |        25 |         2506 |

| thread/sql/signal_handler              | BACKGROUND |        26 |         2510 |

| thread/sql/compress_gtid_table         | FOREGROUND |        27 |         2511 |

| thread/sql/one_connection              | FOREGROUND |        28 |         2514 |  -- FOREGROUND前台线程

+----------------------------------------+------------+-----------+--------------+

27 rows in set (0.00 sec)

-- thread/sql/one_connection 就是我连接的线程

mysql> select name,thread_id,thread_os_id,processlist_id from threads;  -- 查看processlist_id

+----------------------------------------+-----------+--------------+----------------+

| name                                   | thread_id | thread_os_id | processlist_id |

+----------------------------------------+-----------+--------------+----------------+

| thread/sql/main                        |         1 |         2481 |           NULL |

| thread/sql/thread_timer_notifier       |         2 |         2482 |           NULL |

| thread/innodb/io_read_thread           |         3 |         2486 |           NULL |

| thread/innodb/io_read_thread           |         4 |         2487 |           NULL |

| thread/innodb/io_read_thread           |         5 |         2488 |           NULL |

| thread/innodb/io_write_thread          |         6 |         2489 |           NULL |

| thread/innodb/io_write_thread          |         7 |         2490 |           NULL |

| thread/innodb/io_write_thread          |         8 |         2491 |           NULL |

| thread/innodb/io_write_thread          |         9 |         2492 |           NULL |

| thread/innodb/page_cleaner_thread      |        10 |         2493 |           NULL |

| thread/innodb/io_read_thread           |        11 |         2485 |           NULL |

| thread/innodb/io_log_thread            |        12 |         2484 |           NULL |

| thread/innodb/io_ibuf_thread           |        13 |         2483 |           NULL |

| thread/innodb/srv_master_thread        |        15 |         2501 |           NULL |

| thread/sql/background                  |        16 |         2502 |           NULL |

| thread/innodb/srv_purge_thread         |        17 |         2502 |           NULL |

| thread/sql/background                  |        18 |         2503 |           NULL |

| thread/innodb/srv_monitor_thread       |        19 |         2500 |           NULL |

| thread/innodb/srv_error_monitor_thread |        20 |         2499 |           NULL |

| thread/sql/background                  |        21 |         2504 |           NULL |

| thread/sql/background                  |        22 |         2505 |           NULL |

| thread/innodb/srv_lock_timeout_thread  |        23 |         2498 |           NULL |

| thread/innodb/dict_stats_thread        |        24 |         2507 |           NULL |

| thread/innodb/buf_dump_thread          |        25 |         2506 |           NULL |

| thread/sql/signal_handler              |        26 |         2510 |           NULL |

| thread/sql/compress_gtid_table         |        27 |         2511 |              1 |

| thread/sql/one_connection              |        28 |         2514 |              2 |

+----------------------------------------+-----------+--------------+----------------+

27 rows in set (0.00 sec)

-- processlist_id 对应的就是 show processlist中的id

mysql> show processlist;

+----+------+-----------+--------------------+---------+------+----------+------------------+

| Id | User | Host      | db                 | Command | Time | State    | Info             |

+----+------+-----------+--------------------+---------+------+----------+------------------+

|  2 | root | localhost | performance_schema | Query   |    0 | starting | show processlist |

+----+------+-----------+--------------------+---------+------+----------+------------------+

1 row in set (0.00 sec)

mysql> select connection_id();   -- 查看当前connection的id

+-----------------+

| connection_id() |

+-----------------+

|               2 |

+-----------------+

1 row in set (0.00 sec)
通过
threads表中的信息,结合iotop -u mysql的输出,就可以知道某个线程的io使用情况
3. 存储结构对应关系
                  +-------------+-------------+-------------+

      Database    |     16K     |     16K     |     16K     |

                  +------+------+-------------+-------------+

                         |

+------------------------------------------------------------------------+

                         |

                         +------+

                                |

                  +------+------v------+------+

     Filesystem   |  4K  |  4K  |  4K  |  4K  |

                  +---+--+------+------+------+

                      |

+------------------------------------------------------------------------+

                      |

                      +--+

                         |

                         v

                  +------+------+          +------+

        Disk      | 512B | 512B | ...  ... | 512B |

                  +------+------+          +------+
SSD扇区的大小一般为4K或者8K。但是为了兼容HDD,SSD通过Flash Translation Layer (FTL)的方式转换成512B
4. O_DIRECT
fwrite / fsync
fwrite是把数据写入文件系统层(Filesystem)(可能有cache),并不能保证写入Diskfsync可以保证把数据写入到Disk(数据落盘)
只通过
fwrite写入数据特别快(因为有缓存),但随后调用fsync就会很慢,这个速度取决于磁盘的IOPS
如果不手工执行fysnc,当Filesystem的cache小于10%时,操作系统才会将数据刷入磁盘。所以可能存在数据丢失的风险,比如掉电O_DIRECT
+-------------------+               +-------------------+              +-------------------+

|                   |    fwrite     |                   |    fsync     |                   |

|    Buffer Pool    +---------------> Filesystem Cache  +-------------->       Disk        |

|                   |               |                   |              |                   |

+--------+----------+               +-------------------+              +---------+---------+

         |                                                                       ^

         |                                                                       |

         |                   innodb_flush_method = O_DIRECT                      |

         +-----------------------------------------------------------------------+
O_DIRECT的设置参数是告诉系统直接将数据写入磁盘,跳过文件系统的缓存。等同于使用裸设备的效果
四. sysbench 测试io
4.1、Sysench测试前准备
4.1.1、压测环境
| 配置 | 信息 |
|---|---|
| 主机 | Dell PowerEdge R730xd |
| CPU | 24 * Intel(R) Xeon(R) CPU E5-2620 v3 @ 2.40GHz |
| 内存 | 64G (16G * 4) |
| RAID | RAID1 |
| 硬盘 | 7.2K RPM, 6000G SAS, 12G/s |
| 文件系统 | ext4 |
| 系统 | Red Hat Enterprise Linux Server release 7.3 (Maipo) |
| 内核 | 3.10.0-514.el7.x86_64 |
| Sysbench | 1.1.0-0167e45 |
4.1.2、压测基准值
| Tools | sysbench |
|---|---|
| time(sec) | 180 |
| events | 100000000 |
| threads | 24 |
| file-total-size | 128G |
| file-test-mode | rndrw(随机读写)、rndwr(随机写)、rndrd (随机读) |
| file-extra-flags | O_DIRECT |
| file-fsync-freq | 0 |
| file-block-size | 16K |
4.2、进行OLTP_IO测试
4.2.1、安装压测工具sysbench
- 标准安装
[root@localhost-m(252) /r2/soft/dbtest] curl -s https://packagecloud.io/install/repositories/akopytov/sysbench/script.rpm.sh | sudo bash &&

sudo yum -y install sysbench
4.2.2、执行压测
4.2.2.1 创建128个表,并发线程数24个,总数据量128G
[root@localhost-m(252) /r2/soft/sysbench]# sysbench  --threads=24 --test=fileio --file-total-size=128G --file-test-mode=rndrw prepare

WARNING: the --test option is deprecated. You can pass a script name or path on the command line without any options.

sysbench 1.1.0-0167e45 (using bundled LuaJIT 2.1.0-beta3)

128 files, 1048576Kb each, 131072Mb total

Creating files for the test...

Extra file open flags: 0

Creating file test_file.0

......

Creating file test_file.127
4.2.2.2 进行fileio(rndrw随机读写)测试
[root@localhost-m(252) /r2/soft/sysbench]# sysbench fileio \

> --time=180 \

> --events=100000000 \

> --threads=24 \

> --file-total-size=128G \

> --file-test-mode=rndrw \

> --file-num=128 \

> --file-extra-flags=direct \

> --file-fsync-freq=0 \

> --file-block-size=16384 \

> run

sysbench 1.1.0-0167e45 (using bundled LuaJIT 2.1.0-beta3)

Running the test with following options:

Number of threads: 24

Initializing random number generator from current time

Extra file open flags: 3

128 files, 1GiB each

128GiB total file size

Block size 16KiB

Number of IO requests: 100000000

Read/Write ratio for combined random IO test: 1.50

Calling fsync() at the end of test, Enabled.

Using synchronous I/O mode

Doing random r/w test

Initializing worker threads...

Threads started!

Throughput:

         read:  IOPS=334.56 5.23 MiB/s (5.48 MB/s)

         write: IOPS=223.03 3.48 MiB/s (3.65 MB/s)

         fsync: IOPS=0.00

Latency (ms):

         min:                                  0.18

         avg:                                 42.99

         max:                               1329.63

         95th percentile:                    189.93

         sum:                            4320920.09
4.2.2.3 进行fileio(rndwr随机写)测试
[root@localhost-m(252) /r2/soft/sysbench]# sysbench fileio --time=180 --events=100000000 --threads=24 --file-total-size=128G --file-test-mode=rndwr --file-num=128 --file-extra-flags=direct--file-fsync-freq=0 --file-block-size=16384 run

sysbench 1.1.0-0167e45 (using bundled LuaJIT 2.1.0-beta3)

Running the test with following options:

Number of threads: 24

Initializing random number generator from current time

Extra file open flags: 3

128 files, 1GiB each

128GiB total file size

Block size 16KiB

Number of IO requests: 100000000

Read/Write ratio for combined random IO test: 1.50

Calling fsync() at the end of test, Enabled.

Using synchronous I/O mode

Doing random write test

Initializing worker threads...

Threads started!

Throughput:

         read:  IOPS=0.00 0.00 MiB/s (0.00 MB/s)

         write: IOPS=389.35 6.08 MiB/s (6.38 MB/s)

         fsync: IOPS=0.00

Latency (ms):

         min:                                  0.16

         avg:                                 61.63

         max:                               1361.51

         95th percentile:                    108.68

         sum:                            4320453.91
4.2.2.4 进行fileio(rndrd随机读)测试
[root@localhost-m(252) /r2/soft/sysbench]# sysbench fileio --time=180 --events=100000000 --threads=24 --file-total-size=128G --file-test-mode=rndrd --file-num=128 --file-extra-flags=direct--file-fsync-freq=0 --file-block-size=16384 run

sysbench 1.1.0-0167e45 (using bundled LuaJIT 2.1.0-beta3)

Running the test with following options:

Number of threads: 24

Initializing random number generator from current time

Extra file open flags: 3

128 files, 1GiB each

128GiB total file size

Block size 16KiB

Number of IO requests: 100000000

Read/Write ratio for combined random IO test: 1.50

Calling fsync() at the end of test, Enabled.

Using synchronous I/O mode

Doing random read test

Initializing worker threads...

Threads started!

Throughput:

         read:  IOPS=697.23 10.89 MiB/s (11.42 MB/s)

         write: IOPS=0.00 0.00 MiB/s (0.00 MB/s)

         fsync: IOPS=0.00

Latency (ms):

         min:                                  0.41

         avg:                                 34.41

         max:                                737.43

         95th percentile:                    114.72

         sum:                            4320295.10
4.2.3、 执行结果
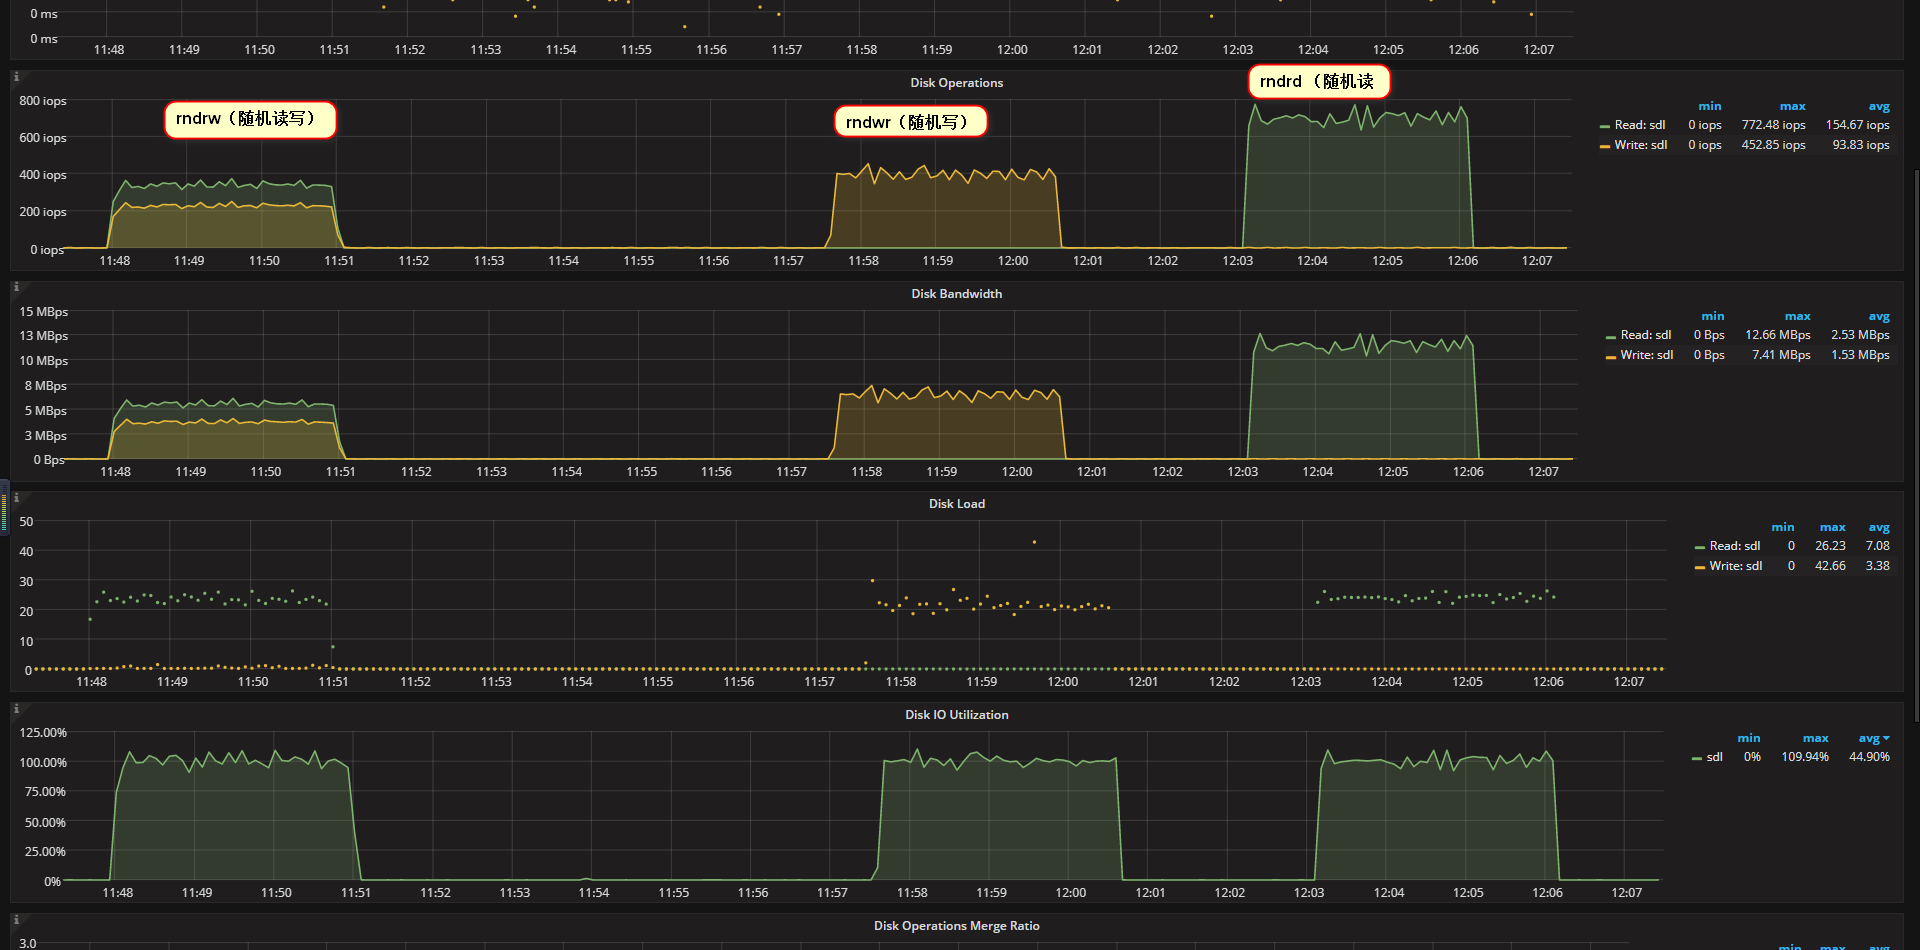
- 分别进行rndrw(随机读写)、rndwr(随机写)、rndrd (随机读)各3分钟,如图R2目录(/dev/sdl)IOPS:
- rndrw(随机读写)平均读iops:334,平均写iops:223
- rndwr(随机写)平均写iops:389.35
- rndwr(随机读)平均读iops:697.23
4.2.4、 清除生成的数据
[root@localhost-m(252) /r2/soft/sysbench]# sysbench  --threads=24 --test=fileio --file-total-size=128G --file-test-mode=rndrw cleanup

WARNING: the --test option is deprecated. You can pass a script name or path on the command line without any options.

sysbench 1.1.0-0167e45 (using bundled LuaJIT 2.1.0-beta3)

Removing test files...
测试完成后执行
cleanup
如果是真实的测试max-time设置成一周的时间
run期间可以使用iotop或者iostat进行观察
017:磁盘I/0介绍和测试的更多相关文章
- Mysql 8.0 新特性测试
Mysql 8.0 新特性测试 Role MySQL8.0版本添加了role特性,role是一种逻辑概念是权限的集合,可以将一个或以上的权限赋予给role,再将role赋给user.Oracle,Po ...
- Android 4.0.3 CTS 测试
Android-CTS 4.0.3测试基本配置 1. Download CTS CTS的获取方式有两种: 1.1.由Google提供 1.1.1.打开浏览器输入连接: http://source.an ...
- 【转】Android 4.0.3 CTS 测试
原文网址:http://blog.csdn.net/zxm317122667/article/details/8508013 Android-CTS 4.0.3测试基本配置 1. Download C ...
- (转)Linxu磁盘体系知识介绍及磁盘介绍
Linxu磁盘体系知识介绍及磁盘介绍 系统管理 / 2017-01-14 / 0 条评论 / 浴春风 Linu磁盘设备基础知识指南磁盘速度快具备的条件: 1)主轴的转速5400/7200/10000/ ...
- Exploratory Testing 3.0 - 探索式测试
最近看了James Bach新发的一篇文章,名为Exploratory Testing 3.0,文章链接:http://www.satisfice.com/blog/archives/1509 这篇文 ...
- Caffe介绍与测试及相关Hi35xx平台下caffe yolox的使用参考
这一篇我大概讲讲Caffe框架下MNIST的实现与基于Hi35xx平台下caffe yolox的运用等,供大家参考 1.Caffe介绍与测试 caffe全称Caffe Convolutional Ar ...
- 开放平台鉴权以及OAuth2.0介绍
OAuth 2.0 协议 OAuth是一个开发标准,允许用户授权第三方网站或应用访问他们存储在另外的服务提供者上的信息,而不需要将用户名和密码提供给第三方网站或分享他们数据的内容. OAuth 2.0 ...
- YZOI回忆录&&YZOI3.0介绍&&某些资源的分享
“那段时光就像块透明的琉璃,美得那么虚幻.飘渺.可是它毕竟在我生命里闪现,哪怕如萤光一样微弱,却照亮了我整个心房.”1.前序伴随着yzoi2.0版本离我而去的是我半年的OI生涯,在这半年内我步入了一个 ...
- Python教程(0)——介绍
What's Python? Python是一种编程语言,由荷兰人Guido van Rossum于1989年,为打发无聊的圣诞节而开发的. Python的优点是语法简洁,代码量比C/C++.Java ...
随机推荐
- trigger 触发器(mysql)
/* 触发器 tigger 引出触发器: 在进行数据库应用软件的开发的时候,我们有时候会碰到表中的某些数据改变,同事希望引起其他相关数据改变的需求,这时候就需要使用触发器. 运用触发器可以简化程序,增 ...
- 日尼玛(。・∀・)ノ゙嗨 关于使用netstat时:::*
关于使用netstat时 # netstat -tlnp | grep :22 tcp 0 0 0.0.0.0:22 0.0.0.0:* LISTEN 1444/sshd tcp6 0 0 :::22 ...
- Kotlin都转正成Android官方语言了,你还不试一下?
想想Android Studio 和Eclipse ,我觉得你还是有必要入手Kotlin了. 站好队很重要. 以前的一篇总体概括老文,大家可以看看~ 爽翻天!告别Java.一起来使用kotlin开发完 ...
- chrome 55 zepto tap事件出错?
刚才升级chrome后发现的,在54.0.2840.98上点击没有问题,在新升级的55.0.2883.75 上点击后会报错Cannot read property 'trigger' of undef ...
- canvas globalCompositeOperation
source-over 默认,相交部分由后绘制图形的填充(颜色,渐变,纹理)覆盖source-in 只绘制相交部分,由后绘制图形的填充覆盖,其余部分透明 source-out 只绘制后绘制图形不相 ...
- express中session的存储与销毁
1.首先在使用session之前需要先配置session的过期时间等,在入口文件app.js中 app.use(express.session({ cookie: { maxAge: config.g ...
- 【DUBBO】dubbo的LoadBalance接口
LoadBalance负载均衡, 负责从多个 Invokers中选出具体的一个Invoker用于本次调用,调用过程中包含了负载均衡的算法,调用失败后需要重新选择 --->类注解@SPI说明可以基 ...
- pandas 之 set_index
set_index 很有用 http://stackoverflow.com/questions/10457584/redefining-the-index-in-a-pandas-dataframe ...
- Eclipse下无法解析注解:@Getter和@Setter
接触到一个项目,java bean全部使用@Getter和@Setter来偷懒,我用getXXX方法,结果发现编译失败,没法用.后来看到另一个项目也是用了@Getter和@Setter注解,但人家用的 ...
- java的日期
直接看例子: import java.text.DateFormatSymbols; import java.util.Calendar; import java.util.GregorianCale ...