使用PHP绘制统计图
使用PHP画统计图的方法
第一种方法
<?php
//最后一次修改:2004-6-21
//一个生成矩形图,曲线图的图形分析类
//作者:tonera
//说明:
//任何人可在任何场合自由使用这个类。但由此所发生的损害跟作者无关。
//可根据数据自适应X和Y轴大小。
//在同一个图形中可显示多个曲线图
//用户可给出生成的图的尺寸大小,数据参数。类根据数据的值来判断生成的图形的高(默认10格)和宽各分几格。
//若用户没有给出图的尺寸大小,则图形高和宽为255像素
//数据参数通过一个方法add_data($array)来多次添加,每次一个数组。
//可自设定图形边框,矩形图内线,深色边框线,浅色边框线,曲线,点的颜色。若用户没有指定,则为默认值
//set_colors方法设定不同曲线的不同色彩
//可进行图形的叠加显示:点,线,矩形
//注意:需要GD库支持
/*
//使用示例
$gg=new build_graph();
$d1=array(0,62,25,20,20,100,99);
$d2=array(0,80,75,65,100,56,79);
$d3=array(0,60,50,25,12,56,45);
$gg->add_data($d1);
$gg->add_data($d2);
$gg->add_data($d3);
$gg->set_colors("ee00ff,dd8800,00ff00");
//生成曲线图
$gg->build("line",0); //参数0表示显示所有曲线,1为显示第一条,依次类推
//生成矩形图
//$gg->build("rectangle","2"); //参数0表示显示第一个矩形,1也为显示第一条,其余依次类推
*/ class build_graph {
var $graphwidth = 300;
var $graphheight = 300;
var $width_num = 0; //宽分多少等分
var $height_num = 10; //高分多少等分,默认为10
var $height_var = 0; //高度增量(用户数据平均数)
var $width_var=0; //宽度增量(用户数据平均数)
var $height_max=0; //最大数据值
var $array_data=array(); //用户待分析的数据的二维数组
var $array_error=array(); //收集错误信息 var $colorBg=array(255,255,255); //图形背景-白色
var $colorGrey=array(192,192,192); //灰色画框
var $colorBlue=array(0,0,255); //蓝色
var $colorRed=array(255,0,0); //红色(点)
var $colorDarkBlue=array(0,0,255); //深色
var $colorLightBlue=array(200,200,255); //浅色
var $colorLightBlack = array(138,138,120); //浅黑
var $colorBlack = array(30,30,30); //黑
var $rgbArray = array("ee00ff","dd8800","00ff00","104E8B"); var $array_color; //曲线着色(存储十六进制数)
var $image; //我们的图像
var $lineType = ''; //画底线时标的数字值,则x的值,范围为'day', 'hour'两值
var $beginDay = ''; //方法:接受用户数据
function add_data($array_user_data, $dataKey = 0){
if(!is_array($array_user_data)){
$array_user_data = array();
}
if(!is_array($array_user_data) or empty($array_user_data)){
$this->array_error['add_data']="没有可供分析的数据";
return false;
exit();
}
if($dataKey == 0 || array_key_exists($dataKey, $this->array_data)){
$dataKey = count($this->array_data);
}
$this->array_data[$dataKey] = $array_user_data;
} //方法:定义画布宽和长
function set_img($img_width,$img_height){
$this->graphwidth = $img_width;
$this->graphheight = $img_height;
} //设定Y轴的增量等分,默认为10份
function set_height_num($var_y){
$this->height_num=$var_y;
} //定义各图形各部分色彩
function get_RGB($color){ //得到十进制色彩
$R=($color>>16) & 0xff;
$G=($color>>8) & 0xff;
$B=($color) & 0xff;
return (array($R,$G,$B));
}
//---------------------------------------------------------------
#定义背景色
function set_color_bg($c1,$c2,$c3){
$this->colorBg=array($c1,$c2,$c3);
}
#定义画框色
function set_color_Grey($c1,$c2,$c3){
$this->colorGrey=array($c1,$c2,$c3);
}
#定义蓝色
function set_color_Blue($c1,$c2,$c3){
$this->colorBlue=array($c1,$c2,$c3);
}
#定义色Red
function set_color_Red($c1,$c2,$c3){
$this->colorRed=array($c1,$c2,$c3);
}
#定义深色
function set_color_DarkBlue($c1,$c2,$c3){
$this->colorDarkBlue=array($c1,$c2,$c3);
}
#定义浅色
function set_color_LightBlue($c1,$c2,$c3){
$this->colorLightBlue=array($c1,$c2,$c3);
} //设定画底线时标的数字值,则x的值,范围为'day', 'hour'两值
function setLineStrinType($type){
if(!in_array($type, array('day', 'hour'))){
return false;
}
$this->lineType = $type;
} //--------------------------------------------------------------- //方法:由用户数据将画布分成若干等份宽
//并计算出每份多少像素
function get_width_num(){
$dataCount = array();
foreach ($this->array_data as $key => $oneData){
$dataCount[] = count($oneData);
} $this->width_num = max($dataCount);
}
function get_max_height(){
//获得用户数据的最大值
$tmpvar = array();
foreach($this->array_data as $tmp_value){
$tmpvar[]= max($tmp_value);
}
if(isset($tmpvar[0])){
$more = $tmpvar[0];
}
$this->height_max = max($tmpvar) + $this->height_var;
return max($tmpvar);
}
function get_height_length(){
//计算出每格的增量长度(用户数据,而不是图形的像素值)
$max_var = $this->get_max_height();
$max_var = round($max_var/$this->height_num);
$first_num = substr($max_var,0,1);
if(substr($max_var,1,1)){
if(substr($max_var,1,1)>=5)
$first_num += 1;
}
for($i = 1; $i < strlen($max_var); $i++){
$first_num .= "0";
}
return (int)$first_num;
}
function get_var_wh(){ //得到高和宽的增量
$this->get_width_num();
//得到高度增量和宽度增量
$this->height_var = $this->get_height_length();
$this->width_var = round($this->graphwidth/$this->width_num, 3);
} function set_colors($str_colors){
//用于多条曲线的不同着色,如$str_colors="ee00ff,dd0000,cccccc"
$this->array_color = split(",",$str_colors);
} function set_begin_day($beginDay){
if(!is_numeric($beginDay)){
return false;
}
$this->beginDay = $beginDay;
} ######################################################################################################
function build_line($var_num){
if(!empty($var_num)){ //如果用户只选择显示一条曲线
$array_tmp[0] = $this->array_data[$var_num-1];
$this->array_data = $array_tmp;
} for($j=0;$j<count($this->array_data);$j++){
list($R,$G,$B)=$this->get_RGB(hexdec($this->array_color[$j]));
$colorBlue=imagecolorallocate($this->image,$R,$G,$B); for($i = 0;$i < $this->width_num - 1;$i++){
$height_pix = round(($this->array_data[$j][$i]/$this->height_max)*$this->graphheight);
$height_next_pix = round($this->array_data[$j][$i + 1]/$this->height_max*$this->graphheight);
imageline($this->image,$this->width_var*($i + 1),$this->graphheight-$height_pix,$this->width_var*($i + 2),$this->graphheight-$height_next_pix,$colorBlue);
}
}
//画点
$colorRed = imagecolorallocate($this->image, $this->colorBlue[0], $this->colorBlue[1], $this->colorBlue[2]); for($j = 0; $j < count($this->array_data); $j++){
list($R,$G,$B) = $this->get_RGB(hexdec($this->array_color[$j]));
$colorPoint = imagecolorallocate($this->image,$R,$G,$B); for($i = 0; $i < $this->width_num; $i++){
if(isset($this->array_data[$j][$i])){
$height_pix = round(($this->array_data[$j][$i]/$this->height_max)*$this->graphheight);
$arcRet = imagearc($this->image,$this->width_var*($i + 1),$this->graphheight-$height_pix,6,5,0,360,$colorPoint);
$borderRet = imagefilltoborder($this->image,$this->width_var*($i + 1),$this->graphheight-$height_pix,$colorPoint,$colorPoint);
if(!$arcRet || !$borderRet){
break;
}
}
}
} for($j = 0; $j < count($this->array_data); $j++){
list($R,$G,$B) = $this->get_RGB(hexdec($this->array_color[$j]));
$colorPoint = imagecolorallocate($this->image,$R,$G,$B);
for($i = 0; $i < $this->width_num; $i++){
$height_pix = round(($this->array_data[$j][$i]/$this->height_max) * $this->graphheight);
$arcRet = imagearc($this->image,$this->width_var*($i + 1),$this->graphheight-$height_pix,6,5,0,360,$colorPoint);
$arcRet = imagefilltoborder($this->image,$this->width_var*($i + 1),$this->graphheight-$height_pix,$colorPoint,$colorPoint);
if(!$arcRet || !$borderRet){
break;
}
}
} } ######################################################################################################
function build_rectangle($select_gra){
if(!empty($select_gra)){ //用户选择显示一个矩形
$select_gra-=1;
}
//画矩形
//配色
$colorDarkBlue=imagecolorallocate($this->image, $this->colorDarkBlue[0], $this->colorDarkBlue[1], $this->colorDarkBlue[2]);
$colorLightBlue=imagecolorallocate($this->image, $this->colorLightBlue[0], $this->colorLightBlue[1], $this->colorLightBlue[2]); if(empty($select_gra))
$select_gra=0;
for($i=0; $i<$this->width_num; $i++){
$height_pix=round(($this->array_data[$select_gra][$i]/$this->height_max)*$this->graphheight);
imagefilledrectangle($this->image,$this->width_var*$i,$this->graphheight-$height_pix,$this->width_var*($i+1),$this->graphheight, $colorDarkBlue);
imagefilledrectangle($this->image,($i*$this->width_var)+1,($this->graphheight-$height_pix)+1,$this->width_var*($i+1)-5,$this->graphheight-2, $colorLightBlue);
}
} ######################################################################################################
function create_cloths(){
//创建画布
$this->image = imagecreate($this->graphwidth+20,$this->graphheight+20);
}
function create_frame(){
//创建画框
$this->get_var_wh();
//配色
$colorBg=imagecolorallocate($this->image, $this->colorBg[0], $this->colorBg[1], $this->colorBg[2]);
$colorGrey=imagecolorallocate($this->image, $this->colorGrey[0], $this->colorGrey[1], $this->colorGrey[2]);
//创建图像周围的框
imageline($this->image, 0, 0, 0, $this->graphheight,$colorGrey);
imageline($this->image, 0, 0, $this->graphwidth, 0,$colorGrey);
//imageline($this->image, ($this->graphwidth-1),0,($this->graphwidth-1),($this->graphheight-1),$colorGrey);
imageline($this->image, 0,($this->graphheight-1),($this->graphwidth-1),($this->graphheight-1),$colorGrey);
}
function create_line(){
//创建网格。
$this->get_var_wh();
$colorBg = imagecolorallocate($this->image, $this->colorBg[0], $this->colorBg[1], $this->colorBg[2]);
$colorGrey = imagecolorallocate($this->image, $this->colorGrey[0], $this->colorGrey[1], $this->colorGrey[2]);
$colorRed = imagecolorallocate($this->image, $this->colorRed[0], $this->colorRed[1], $this->colorRed[2]);
$colorLightBlack = imagecolorallocate($this->image, $this->colorLightBlack[0], $this->colorLightBlack[1], $this->colorLightBlack[2]);
$colorBlack = imagecolorallocate($this->image, $this->colorBlack[0], $this->colorBlack[1], $this->colorBlack[2]);
for($i = 1 ;$i <= $this->height_num + 5; $i++){
//画横线
imageline($this->image,0,$this->graphheight-($this->height_var/$this->height_max*$this->graphheight)*$i,$this->graphwidth,$this->graphheight-($this->height_var/$this->height_max*$this->graphheight)*$i,$colorGrey);
//标出数字
imagestring($this->image,2,0,$this->graphheight-($this->height_var/$this->height_max*$this->graphheight)*$i,$this->height_var*$i,$colorLightBlack);
}
$type = $this->lineType;
if($type == "day"){
if($this->beginDay){
$j = $this->beginDay;
}else{
$j = 1;
}
}elseif($type == "hour"){
$j = 0;
}
for($i = 1;$i <= $this->width_num; $i++){
//画竖线
imageline($this->image,$this->width_var*$i,0,$this->width_var*$i,$this->graphwidth,$colorGrey);
//标出数字
if($type == 'day'){
if($i == 1){
imagestring($this->image,2,$this->width_var*$i,$this->graphheight-15,$j,$colorBlack);
}
imagestring($this->image,2,$this->width_var*($i + 1),$this->graphheight-15,$j + 1,$colorBlack);
}elseif($type == 'hour'){
if($i == 1){
imagestring($this->image,2,$this->width_var*$i,$this->graphheight-15,$j,$colorBlack);
}
imagestring($this->image,2,$this->width_var*($i + 1),$this->graphheight-15,$j + 1,$colorBlack);
}else{
imagestring($this->image,2,$this->width_var*($i + 1),$this->graphheight-15,$i,$colorBlack);
}
$j++;
if($type == "day" && $j == 31){
$j = 1;
}elseif($type == "hour" && $j == 23){
$j = -1;
}
}
} function build($graph,$str_var, $outpwd = ""){
//$graph是用户指定的图形种类,$str_var是生成哪个数据的图
if(empty($outpwd)){
header("Content-type: image/jpeg");
}
$this->create_cloths(); //先要有画布啊~~
switch ($graph){
case "line":
$this->create_frame(); //画个框先:)
$this->create_line(); //打上底格线
$this->build_line($str_var); //画曲线
break;
case "rectangle":
$this->create_frame(); //画个框先:)
$this->build_rectangle($str_var); //画矩形
$this->create_line(); //打上底格线
break;
}
//输出图形并清除内存
if(!empty($outpwd)){
imagepng($this->image, $outpwd);
}else{
imagepng($this->image);
}
imagedestroy($this->image);
} ###################################################################################################### }
第二种是用开源工具jpgraph,参见 http://jpgraph.net/features
Chart Gallery
Line / Area
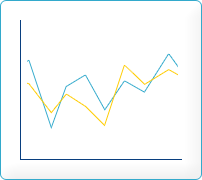
- Line Plots
- Filled Line Plots
- Step Line Plots
- Line Plots With Markers
- Line Plots With Inverted Y-axis
- Line Plots With Values
Bar
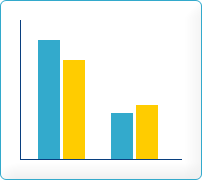
- Standard Bar plots
- Horizontal Bar plots
- Adding backgrounds and patterns to bar plots
- Combined Line and Bar plots
Pie
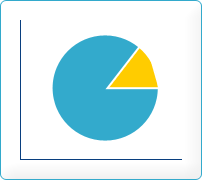
- Pie Plots
- 3D Pie plots
- Exploding Pie plots
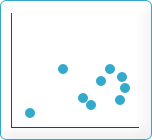
Scatter
Impluse
Field
Splines
Geo Maps

Stock
Polar
Error

Balloon

Radar
Contour
Others(Pro ver.)

General features
Below is a number of "one-liners" that describe some of the general features available in JpGraph.
- Anti-aliasing for Pie charts.
- More advanced formatting of graph titles including 3D Bevel effects.
- Additional 3D Bevel formatting feature for the entire Graph
- Gradient fills for bars are now also displayed in the legend
- Improvements on legend formatting. It is now possible to have several columns in the legend
- Improved callback capability for Plot marks. The new callbacks will provide both X and Y coordinates.
- Footer text can now be used on all graph types
- dded possibility to use the Freely available Vera TTF fonts. These fonts are available from http://www.gnome.org/fonts/
- Built in rotation of graphs
- Fine tuning of legend layout, size and positioning of individual legends and markers.
- Added possibility to use object methods as callbacks and not only static global functions
- Full support for color alpha blending
- Automatic generation of client side image maps to make it possible to generate drill-down graphs.
- Advanced interpolation with cubic splines to get smooth curves from just a few data points.
- Several different fill styles for line plots
- Advanced image 3D effects built-in without external image manipulation programs
- Supports unlimited number of plots in each graph, makes it easy to compose complex graph which consists of several plot types
- Additional built-in images for plot marks including 3D rendered markers like diamonds, squares, bevels, balls, pins etc
- Text strings can now be added to the plot using scale coordinates
- Support for all primitive URL parameter types with CSIM graphs.
- Autoscaling will now also consider added lines and texts.
- Hare/Niemeyer Integer compensation for Pie Plots
- Added the possibility to use Vertical Gradient fill for line plots.
- Improved error handling. The visual appearance of the error handling now tries to mimic any windows system window (in graphic)
- Builtin support to display over 200 country flag and the possibility to use them as icons or markers in the graphs. All the flag images are builtin with JpGraph in an efficient pre-compiled data format.
- Supports caching (with timeout) of generated graphs to lessen burden of a HTTP server.
- Intelligent autoscaling which gravitates towards aesthetical values.
- Fully supports manual scaling, with fine grain control of position of ticks
- Supports color-gradient fill for bar graphs
- Supports both vertical and horizontal grids (with image depth specification)
- Supports both on-the fly image generation and batch processing.
- Extensive documentation
- Advanced text formatting using TTF fonts
- Support for both Chinese and Japanes character sets
非常多的例子,很好的。
第三种用 open flash chart,参见
http://teethgrinder.co.uk/open-flash-chart/gallery-data.php
http://www.helloweba.com/view-blog-41.html
http://www.phphi.cn/post/98/
http://blogold.chinaunix.net/u3/105169/showart_2322209.html
http://hi.baidu.com/duwuzhe722/blog/item/e11b2d2662b512038b82a175.html
第四种使用amcharts,参见http://www.amcharts.com
使用PHP绘制统计图的更多相关文章
- C# 绘制统计图(柱状图, 折线图, 扇形图)【转载】
统计图形种类繁多, 有柱状图, 折线图, 扇形图等等, 而统计图形的绘制方法也有很多, 有Flash制作的统计图形, 有水晶报表生成统计图形, 有专门制图软件制作, 也有编程语言自己制作的:这里我们用 ...
- C# 绘制统计图(柱状图, 折线图, 扇形图)
统计图形种类繁多, 有柱状图, 折线图, 扇形图等等, 而统计图形的绘制方法也有很多, 有Flash制作的统计图形, 有水晶报表生成统计图形, 有专门制图软件制作, 也有编程语言自己制作的:这里我们用 ...
- Silverlight/WPF绘制统计图Visifire.dll文件
官网:http://www.visifire.com/ 一直没找到好的中文文档,希望有的这个的可以发个我! 效果图: 前台代码: <UserControl x:Class="Text_ ...
- 使用ArcGIS API for Silverlight + Visifire绘制地图统计图
原文:使用ArcGIS API for Silverlight + Visifire绘制地图统计图 最近把很久之前做的统计图又拿出来重新做了一遍,感觉很多时候不复习,不记录就真的忘了,时间是最好的稀释 ...
- Arcgis for Javascript之统计图的实现
首先,截个图给大家看看效果: 初始化状态 放大后的状态 点击选中后的状态 如上图所示,一般的涉及到的地图的统计涉及到上述所展示的三个状态:1.初始化状态:2.缩放后的状态:3.点击选中显示详情状态.第 ...
- canvas绘制随机颜色的柱形图
<!DOCTYPE html> <html lang="en"> <head> <meta charset="UTF-8&quo ...
- html5高级
Html5高级 项目回顾 Day 01 第三阶段知识体系: (1)AJAX异步请求 数据库.PHP.HTTP.原生AJAX.jQuery中的AJAX (2)HTML5高级特性 九大新特性 (3)Boo ...
- WinForm GDI+ 资料收集
UI(User Interface)编程在整个项目开发过程中是个颇为重要的环节,任何好的解决方案若没有良好的用户界面呈现给最终用户,那么就算包含了最先进的技术也不能算是好程序.UI编程体现在两个方面, ...
- MATLAB学习笔记(五)——MATLAB绘图
(一)二维数据曲线图 一.绘制单根二维曲线 1.基本调用格式 plot(x,y) (1)x,y为长度相同的向量,分别用于储存x坐标和y坐标数据 (2)用于绘制以x,y为横,纵坐标的二维曲线. (3)举 ...
随机推荐
- React组件测试(模拟组件、函数和事件)
一.模拟组件 1.用到的工具 (1)browerify (2)jasmine-react-helpers (3)rewireify(依赖注入) (4)命令:browserify - t reactif ...
- 浅析Quartz的集群配置
浅析Quartz的集群配置(一) 收藏人:Rozdy 2015-01-13 | 阅:1 转:22 | 来源 | 分享 1 基本信息 摘要:Quar ...
- 关于PHP 7你必须知道的五件事
1.今年的计划表已出.PHP 7时间表RFC投票一直通过, PHP 7将在2015年10月发布.尽管有些延迟,但我们还是很高兴它在今年内发布.PHP 7详细时间表由此查看. 2.PHP 要上太空飞船了 ...
- nyoj-291 互素数个数 欧拉函数
LK的数学题 时间限制:1000 ms | 内存限制:65535 KB 难度:3 描述 LK最近遇到一个问题,需要你帮她一下.一个整数n,求[1,n)中,和n互素的数的个数. 输入 多组测 ...
- AutoResetEvent
private static readonly AutoResetEvent autoResetEvent = new AutoResetEvent(false); private static vo ...
- oracle portlist.ini
Enterprise Manager Database Control URL - (orcl) :https://redhat4.7:1158/em [root@redhat4 install]# ...
- ie下jquery ajax 80020101错误的解决方法
<script language="javascript"> <!-- function checkAll(name,isCheck){ ...
- UVa 12034 (递推) Race
题意: 有n个人赛马,名次可能并列,求一共有多少种可能. 分析: 设所求为f(n),假设并列第一名有i个人,则共有C(n, i)种可能,接下来确定后面的名次,共有f(n-1)种可能 所以递推关系为: ...
- asp.net实现文件解压和压缩
C#解压RAR压缩文件(--转载--测试通过) using System; using System.Collections.Generic; using System.Text; using Sys ...
- 添加gif效果图
1.贴加第三方包 http://blog.csdn.net/iamlazybone/article/details/5972234 2. <FrameLayout android:id=&quo ...