
D3——Updates, Transitions, and Motion
<script type="text/javascript">

    var w = ;

    var h = ;

    var barPadding = ;

    var dataset = [ , , , , , , , , , ,, , , , , , , , ,  ];

    //create svg

   var svg = d3.select("body").append("svg")

                  .attr("width", w).attr("height", h);

  svg.selectAll("rect")

       .data(dataset).enter()

       .append("rect")

       .attr("x",function(d,i){ return i * (w/dataset.length);})

       .attr("y", function(d){ return h - (d*);})

       .attr("width", function(d,i){return w/dataset.length - barPadding;})

       .attr("height", function(d){return d*;})

       .attr("fill", function(d){return "rgb(0,0," +(d*)+ ")";})

      //set label

          svg.selectAll("text")

            .data(dataset).enter()

            .append("text")

            .text(function(d){return d;})

            .attr("text-anchor","middle")

            .attr("x",function(d,i){

return i*(w/dataset.length)+(w/dataset.length-barPadding)/;})

            .attr("y",function(d){return h-(d*)+;})

            .attr("font-family", "sans-serif")

            .attr("font-size", "11px")

            .attr("fill","rgb(255,255,255)")

</script>
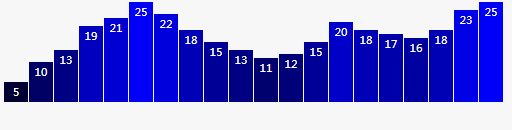
前面的直方图使用的数据都是static datasets, 但现实世界中数据大多都是随时间变化的。有时我们希望图表能反映那些变化。在D3中,通过updates可以更新数据,changes可视化可以通过transitions,motion表现出来
有序的数据(ordinal data: typically categories with some inherent order to them),例如:
- freshman, sophomore, junior, senior
- grade B, grade A, grade AA
- strongly dislike, dislike, neutral, like, strongly like
We don’t have true ordinal data for use with this bar chart. Instead, we just want the bars to be drawn from left to right using the same order in which values occur in our dataset.
对这类数据需要用ordinal scale(序数比例尺);
varxScale=d3.scale.ordinal();线性比例尺的定义域需要设置一个有两个值得数组,分别是最小值和最大值,例如var xScale = d3.scale.linear().domain([0,100]);
而序数比例尺的定义域的设置和线性比例尺不一样,可以指定an array with the category names,例如:.domain(["freshman","sophomore","junior","senior"])
上面直方图中数据设置序数比例尺:
.domain(d3.range(dataset.length))

//等价于

.domain([, , , , , , , , , ,

         , , , , , , , , , ])

//d3.range(10)返回一个数组[0,1,2,3,4,5,6,7,8,9]
ordinal scales 使用离散 ranges, meaning输出值是预先定义好的,可以数值化或不数值化;
可以使用range()函数定义值域, 或者使用更平滑的 rangeBands()函数, 它利用最小值和最大值,根据domain的length自动分割成均匀的chunks or “bands。 For example:
.rangeBands([, w])

/*

this says “calculate even bands starting at 0 and ending at w, then set this scale’s range to those bands.” In our case, we specified 20 values in the domain, so D3 will calculate:

(w - 0) / xScale.domain().length

(600 - 0) / 20

600 / 20

30

*/
In the end, each band will be 30 “wide.”
也可以加入第二个参数,以设置每个band之间的间隔; Here, I’ve used 0.2, meaning that 20 percent of the width of each band will be used for spacing in between bands:
.rangeBands([, w], 0.2)
还可以使用 rangeRoundBands(), 类似于 rangeBands(), 只是此函数的输出值是舍入后最接近的整数, so 12.3456 becomes just 12, for example. This is helpful for keeping visual elements lined up precisely on the pixel grid, for clean, sharp edges.
.rangeRoundBands([, w], 0.05); //This gives us nice, clean pixel values, with a teensy bit of visual space between them.
Interaction via Event Listeners
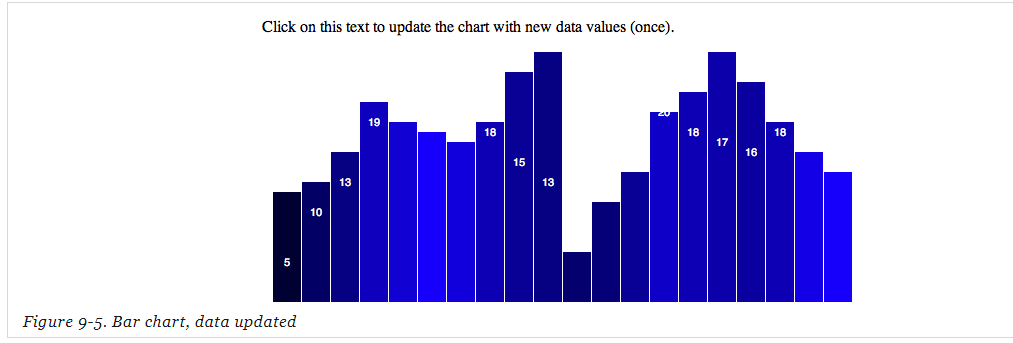
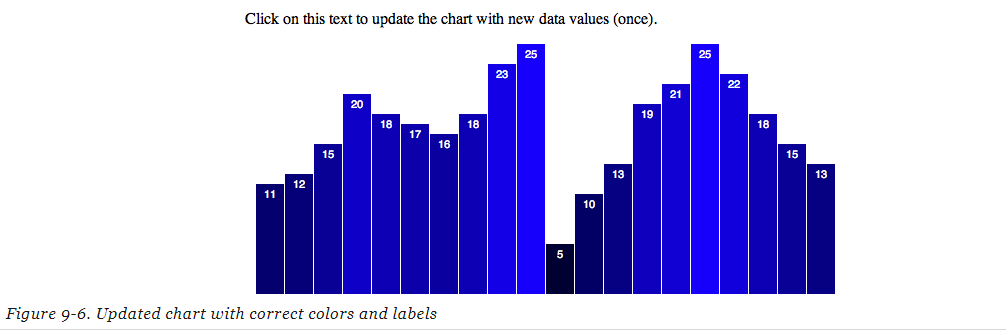
<p>Click on this text to update the chart with new data values (once).</p>
//On click, update with new data

d3.select("p")

    .on("click", function() {

        //New values for dataset

        dataset = [ , , , , , , , , , ,

                    , , , , , , , , ,  ];

        //Update all rects

        svg.selectAll("rect")

           .data(dataset)

           .attr("y", function(d) {

                return h - yScale(d);

           })

           .attr("height", function(d) {

                return yScale(d);

           });
.attr("fill",function(d){// <-- Down here!
return"rgb(0, 0, "+(d*10)+")";
});
});
设置新的label text
svg.selectAll("text")

   .data(dataset)

   .text(function(d) {

        return d;

   })

   .attr("x", function(d, i) {

        return xScale(i) + xScale.rangeBand() / ;

   })

   .attr("y", function(d) {

        return h - yScale(d) + ;

   });
Transitions
.transition() //过渡效果
Without transition(), D3 evaluates every attr() statement immediately, so the changes in height and fill happen right away. When you add transition(), D3 introduces the element of time. Rather than applying new values all at once, D3 interpolates between the old values and the new values, meaning it normalizes the beginning and ending values, and calculates all their in-between states. D3 is also smart enough to recognize and interpolate between different attribute value formats. For example, if you specified a height of 200px to start but transition to just 100 (without the px). Or if a blue fill turns rgb(0,255,0). You don’t need to fret about being consistent; D3 takes care of it.
//Update all rects

svg.selectAll("rect")

   .data(dataset)

   .transition()    // <-- This is new! Everything else here is unchanged.

    .duration()  // <-- Now this is new!

   .attr("y", function(d) {

        return h - yScale(d);

   })

   .attr("height", function(d) {

        return yScale(d);

   })

   .attr("fill", function(d) {

        return "rgb(0, 0, " + (d * ) + ")";

   });
//Update all labels

svg.selectAll("text")

   .data(dataset)

   .transition()        // <-- This is new,

   .duration()      //     and so is this.

   .text(function(d) {

        return d;

   })

   .attr("x", function(d, i) {

        return xScale(i) + xScale.rangeBand() / ;

   })

   .attr("y", function(d) {

        return h - yScale(d) + ;

   });
duration() 定义过渡时间
The duration() must be specified after the transition(), and durations are always specified in milliseconds, so duration(1000) is a one-second duration.
ease()定义过渡类型
ease() must also be specified after transition(), but before the attr() statements to which the transition applies. ease() can come before or after duration(), but this sequence makes the most sense to me:
…   //Selection statement(s)

.transition()

.duration()

.ease("linear")

…   //attr() statements
其他内置的 easing functions有,例如:
circle:Gradual ease in and acceleration until elements snap into place.
elastic:The best way to describe this one is “sproingy.”
bounce:Like a ball bouncing, then coming to rest.
delay()设置过渡什么时候开始,可以指定一个值, 毫秒级,也可以指定一个函数
…

.transition()

.delay()     //1,000 ms or 1 second

.duration()  //2,000 ms or 2 seconds

…
…

.transition()

.delay(function(d, i) {

    return i * ;

})

.duration()

…
D3——Updates, Transitions, and Motion的更多相关文章
- [D3] Reuse Transitions in D3 v4
D3 transitions start executing as soon as they’re created, and they’re destroyed once they end. This ...
- [D3] Animate Transitions in D3 v4
D3 makes it easy to add meaningful animations to your data visualizations. Whether it’s fading in ne ...
- 数据可视化(8)--D3数据的更新及动画
最近项目组加班比较严重,D3的博客就一拖再拖,今天终于不用加班了,赶紧抽点时间写完~~ 今天就将D3数据的更新及动画写一写~~ 接着之前的博客写~~ 之前写了一个散点图的例子,下面可以自己写一个柱状图 ...
- unity3d 学习笔记_____Native2d 刚体、冲击、联合使用
Mass Mass of the rigidbody. Linear Drag Drag coefficient affecting positional movement. Angular Drag ...
- Android 5.0自定义动画
材料设计中的动画对用户的操作给予了反馈,并且在与应用交互时提供了持续的可见性.材料主题提供了一些按钮动画和活动过渡,Android 5.0允许你自定义动画并且可以创建新的动画: Touch Feedb ...
- Host–Parasite(主从关系): Graph LSTM-in-LSTM for Group Activity Recognition
This article aims to tackle the problem of group activity recognition in the multiple-person scene. ...
- [D3] Animate Chart Axis Transitions in D3 v4
When the data being rendered by a chart changes, sometimes it necessitates a change to the scales an ...
- [D3] 12. Basic Transitions with D3
<!DOCTYPE html> <html> <head lang="en"> <meta charset="UTF-8&quo ...
- D3中动画(transition函数)的使用
关于transition的几个基本点: 1. transition()是针对与每个DOM element的,每个DOM element的transition并不会影响其他DOM element的tra ...
随机推荐
- Tomcat源码分析——请求原理分析(上)
前言 谈起Tomcat的诞生,最早可以追溯到1995年.近20年来,Tomcat始终是使用最广泛的Web服务器,由于其使用Java语言开发,所以广为Java程序员所熟悉.很多人早期的J2EE项目,由程 ...
- RabbitMQ---9、消息确认机制(事务+Confirm)
转载至:https://blog.csdn.net/u013256816/article/details/55515234 参考资料:https://www.cnblogs.com/520playbo ...
- RabbitMQ---2、介绍
1.背景 RabbitMQ是一个由erlang开发的AMQP(Advanved Message Queue)的开源实现. 2.应用场景 2.1异步处理 场景说明:用户注册后,需要发注册邮件和注册短信, ...
- [javaEE] Servlet中Session的使用
Session是一个域 作用范围:当前会话范围 生命周期:当程序第一次调用request.getSession()创建出客户端的session对象,30分钟没有操作认为超时,这个可以在web.xml中 ...
- 阿里巴巴的数据池DRUID
使用了阿里巴巴的数据池管理: 监控DB池连接和SQL的执行情况 https://github.com/alibaba/druid/wiki/常见问题 https://www.cnblogs.com ...
- spring与dwr整合实现js直接使用java代码
此文章是基于 搭建Jquery+SpringMVC+Spring+Hibernate+MySQL平台 一. jar包介绍 1. dwr-3.0.1.jar,支持 spring 4.3.4 的最低版本 ...
- 关于node npm的一个解决方法
解决Error: ENOENT: no such file or directory, scandir 'D:\IdeaWork\code-front-jet\node_modules\.npmins ...
- Linux Notes
Do what we want based on what others already did with additional abstraction and organization to ser ...
- Android MVC模式和MVP模式的区别
MVC模式: 1. MVC的所有通信都是单向的. 2. view传送指令到controller(用户也可以直接将指令传到controller). 3. controller完成业务逻辑后要求model ...
- Android adb命令查看sharedpreferences
adb shell run-as com.example.android //对应包名 ls查看当前目录下的所有文件,找到shared_prefs cd shared_prefs ls 查看所有的 s ...