
Canvas 实现绘制图表
这里用canvas实现了两个简单的图表,用到了canvas的基本用法,效果如下

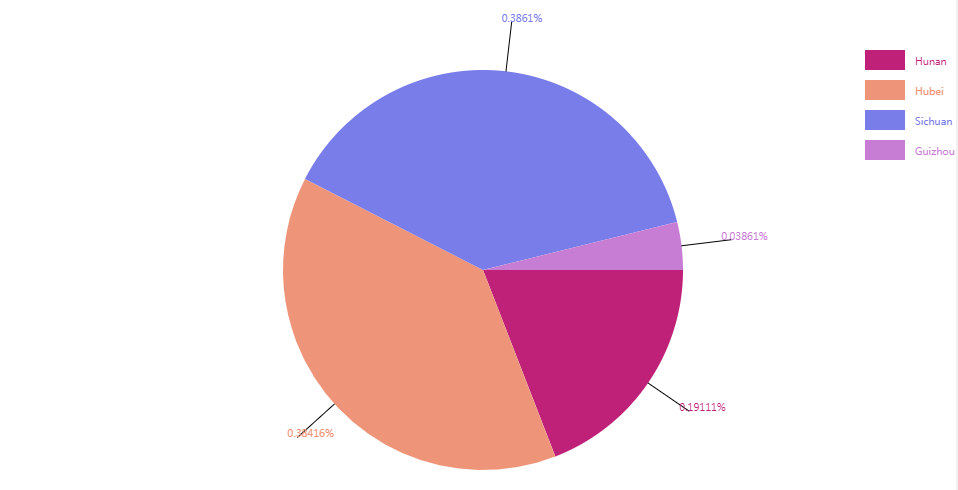
新建 chart.js 文件,封装绘制方法
构造方法
function myChart(config){

    this.width = config.width > 300 ? config.width : 200        //图表宽度

    this.height = config.height > 200 ? config.height : 200        //图表高度

    this.el = config.el         //容器DOM元素

    this.data = config.data     //数据

    this.title = config.title     //title

    this.type = config.type     //类型 line、pie

}
初始化方法
        init: function(){

            this.canvas = document.createElement('canvas')

            this.canvas.width = this.width

            this.canvas.height = this.height

            document.querySelector(this.el).append(this.canvas)

            this.ctx = this.canvas.getContext('2d')

            switch(this.type){

                case 'line':

                    this.drawLineChart()

                    break;

                case 'pie':

                    this.drawPieChart()

                    break;

                default :

                    this.drawLineChart()

                    break;

            }

        },
绘制折线图
        //绘制折线图

        drawLineChart: function(){

            var height = this.height

            this.max = 0

            this.min = Infinity

            this.startPoint = { x: 30, y: height - 15 }    //原点位置

            this.innerHieght = this.height - 30 - 15

            this.innerWidth = this.width - 30

            this.findTerminal()

            this.drawCoordinate()

            this.drawLine()

        },

        //找到最大值和最小值

        findTerminal: function(){

            this.data.map((item, index) => {

                this.max = item.val > this.max ? item.val : this.max

                this.min = item.val < this.min ? item.val : this.min

            })

        },

        //绘制坐标轴

        drawCoordinate: function(){

            //绘制坐标轴

            this.ctx.clearRect(0, 0, this.width, this.height)

            this.ctx.beginPath()

            this.ctx.moveTo(this.startPoint.x, this.startPoint.y)

            this.ctx.lineTo(this.startPoint.x, this.startPoint.y - this.innerHieght)

            this.ctx.moveTo(this.startPoint.x, this.startPoint.y)

            this.ctx.lineTo(this.startPoint.x + this.innerWidth, this.startPoint.y)

            this.ctx.stroke()

            //绘制横向标尺

            var distance = Math.floor(this.innerWidth / this.data.length)

            this.ctx.beginPath()

            this.ctx.strokeStyle = "#999"

            for(let i = 0; i < this.data.length; i++){

                let curX = this.startPoint.x + distance*i

                this.ctx.moveTo(curX , this.startPoint.y)

                this.ctx.lineTo(curX , this.startPoint.y - 5)

                this.ctx.moveTo(curX , this.startPoint.y + 15)

                this.ctx.textAlign = "center"

                this.ctx.fillText(this.data[i]['key'] , curX , this.startPoint.y + 15 )

            }

            this.ctx.stroke()

            //绘制横向坐标

            var unit = Math.floor((this.max - this.min) / 20)

            this.ctx.beginPath()

            this.ctx.strokeStyle = "#999"

            for(let y = 0; y < 20; y++){

                let curY = Math.floor(this.startPoint.y - this.innerHieght / 20 * y)

                let curVal = Math.floor(this.min + unit*y)

                this.ctx.moveTo(this.startPoint.x, curY)

                this.ctx.lineTo(this.startPoint.x + 5, curY)

                this.ctx.moveTo(this.startPoint.x - 30, curY)

                this.ctx.fillText(curVal, this.startPoint.x - 15 , curY + 3 )

            }

            this.ctx.stroke()

            //绘制title

            this.ctx.beginPath()

            this.ctx.font = "20px Arial"

            this.ctx.fillText(this.title, this.width / 2 - 30 , 20)

            this.ctx.stroke()

        },

        //绘制折线

        drawLine: function(){

            var distance = Math.floor(this.innerWidth / this.data.length)

            this.ctx.beginPath()

            this.ctx.moveTo(this.startPoint.x, this.startPoint.y)

            for(let i = 0; i < this.data.length; i++){

                let curY = this.startPoint.y - (((this.data[i].val - this.min)/(this.max - this.min)) * this.innerHieght)

                this.ctx.lineTo(this.startPoint.x + i*distance, curY)

                this.ctx.strokeStyle = "#000"

                this.ctx.font = "10px Arial"

                this.ctx.fillText(Math.floor(this.data[i].val), this.startPoint.x + i*distance, curY + 10 )

                this.ctx.stroke()

                this.ctx.beginPath()

                this.ctx.fillStyle="gray"

                this.ctx.arc(this.startPoint.x + i*distance, curY,3,0,2*Math.PI);

                this.ctx.fill()

                this.ctx.beginPath()

                this.ctx.moveTo(this.startPoint.x + i*distance, curY)

            }

        }
绘制饼状图
        //绘制饼状图

        drawPieChart: function(){

            var shortAxis = this.width < this.height ? this.width : this.height

            this.radius = 0.4 * shortAxis

            var width = this.width

            var height = this.height

            this.centerPoint = { x: width/2, y: height/2 + 20}

            this.drawPieLegend()

            this.calcPercentage()

            this.drawPie()

        },

        //计算饼状图比例

        calcPercentage: function(){

            var total = 0

            this.data.map((item,index) => {

                total += item.val

            })

            this.data.map((item,index) => {

                item.proportion = Math.floor(item.val / total * 100000) / 100000

            })

        },

        //绘制饼状图内容

        drawPie: function(){

            var offset = 0

            for(let i = 0; i < this.data.length; i++){

                this.ctx.beginPath()

                this.ctx.moveTo(this.centerPoint.x, this.centerPoint.y)

                this.ctx.arc(this.centerPoint.x, this.centerPoint.y, this.radius, 2*Math.PI*offset, 2*Math.PI*(this.data[i].proportion + offset))

                this.ctx.closePath()

                this.ctx.fillStyle = this.data[i].bg

                this.ctx.fill()

                this.ctx.beginPath()

                let x = this.centerPoint.x + Math.cos(2*Math.PI*(this.data[i].proportion/2 + offset))*this.radius

                let y = this.centerPoint.y + Math.sin(2*Math.PI*(this.data[i].proportion/2 + offset))*this.radius

                this.ctx.moveTo(x, y)

                let x1 = this.centerPoint.x + Math.cos(2*Math.PI*(this.data[i].proportion/2 + offset))*(this.radius + 50)

                let y1 = this.centerPoint.y + Math.sin(2*Math.PI*(this.data[i].proportion/2 + offset))*(this.radius + 50)

                this.ctx.lineTo(x1, y1)

                this.ctx.stroke()

                this.ctx.fillText(this.data[i].proportion + '%', x1 - 10, y1)

                offset += this.data[i].proportion

            }

        },

        //绘制饼状图图例

        drawPieLegend: function(){

            for(let i = 0; i < this.data.length; i++){

                let color = '#'+Math.floor(Math.random()*0xffffff).toString(16)

                this.data[i].bg = color

                this.ctx.fillStyle = color

                this.ctx.fillRect(this.width - 100, 30 * i + 50, 40, 20)

                this.ctx.fillText(this.data[i].key, this.width - 50 , 30 * i + 65)

            }

        },
使用:
引入 chart.js 文件
<script type="text/javascript" src="chart.js"></script>
    var chart = new myChart({

        width: document.body.clientWidth,

        height: 500,

        el: '#app',

        data: arr,

        title: `${data.name}(${data.symbol})`,

        type: 'line'

    })

    chart.init()
Canvas 实现绘制图表的更多相关文章
- 怎样用JavaScript和HTML5 Canvas绘制图表
原文:https://code.tutsplus.com/zh-...原作:John Negoita翻译:Stypstive 在这篇教程中,我将展示用JavaScript和canvas作为手段,在饼状 ...
- 9款基于HTML5/SVG/Canvas的折线图表应用
1.华丽的HTML5图表 可展示实时数据 HTML5在图表应用中也十分广泛,比起以前的网页图表,HTML5图表制作更便捷,功能更强大.这款HTML5图表插件外观十分华丽和专业,在数据展示方面也很有优势 ...
- mpvue 使用echarts动态绘制图表(数据改变重新渲染图表)
最近在公司开发一款微信小程序,按照客户需求用饼状图显示当前设备状态(开机.故障.关机),于是就在网上寻找各种资料,找了很多mpvue使用关于echarts绘制图表,最终功夫不负有心人,找到一篇关于mp ...
- 10 个超炫绘制图表图形的 Javascript 插件【转载+整理】
原文地址 现在,有很多在线绘制图表和图形(Charts and Graphs)的 JavaScript 插件,这些插件还都是免费,以及图表库.这些插件大量出现的原因是基于一个事实:人们不再依赖于 Fl ...
- 9款很棒的网页绘制图表JavaScript框架脚本
推荐9款很棒的可在网页中绘制图表的JavaScript脚本,这些有趣的JS脚本可以帮助你快速方便的绘制图表(线.面.饼.条…),其中包括jQuery.MooTools.Prototype和一些其它的J ...
- 18个基于 HTML5 Canvas 开发的图表库
如今,HTML5 可谓如众星捧月一般,受到许多业内巨头的青睐.很多Web开发者也尝试着用 HTML 5 来制作各种各样的富 Web 应用.HTML 5 规范引进了很多新特性,其中之一就是 Canvas ...
- 在微信小程序中绘制图表(part2)
本期大纲 1.确定纵坐标的范围并绘制 2.根据真实数据绘制折线 相关阅读:在微信小程序中绘制图表(part1)在微信小程序中绘制图表(part3) 关注我的 github 项目 查看完整代码. 确定纵 ...
- canvas快速绘制圆形、三角形、矩形、多边形
想看前面整理的canvas常用API的同学可以点下面: canvas学习之API整理笔记(一) canvas学习之API整理笔记(二) 本系列文章涉及的所有代码都将上传至:项目代码github地址,喜 ...
- 用html5的canvas画布绘制贝塞尔曲线
查看效果:http://keleyi.com/keleyi/phtml/html5/7.htm 完整代码: <!DOCTYPE html PUBLIC "-//W3C//DTD XHT ...
随机推荐
- linux 软件应用
grub2 安装grub2到某分区 mount /mnt/dev /dev/sdb2 //这里选择你刚才分区的第二个分区 sudo grub-install --root-directory=/mnt ...
- input输入框提交输入的值的方式
给button添加点击事件,通过id(getElementById)获取输入框的value. 弹框提示如图
- JNI加载hal的dlopen()相关操作
1.函数集合 #include <dlfcn.h> void *dlopen(const char *filename, int flag); char *dlerror(void); v ...
- Flutter 常用命令
Flutter 常用命令: Flutter 常用命令 说明 flutter 列出所有的命令 flutter help 查看具体命令的帮助信息 flutter doctor 查看是否还需要安装其它依赖 ...
- 第一章 XAML概览
1.1 XAML是什么? XAML是eXtensible Application Markup Language的英文缩写,相应的中文名称为可扩展应用程序标记语言.也就是说在开发一个应用程序时,我们可 ...
- h5动画如何实现?如何快速开发h5动画
最近几年随着h5的兴起,复杂的h5动画,甚至是交互动画类型的产品不断涌现,尤其在课件产品方面,很多公司都有相关需求,最近很多h5开发工程师想了解相关方面的技术. 针对h5,如果是简单的动画效果,可以考 ...
- h5课件是什么?h5(html5)怎样实现交互动画开发?-----浅谈h5交互动画课件的优势
目前很多交互课件,尤其幼儿类的交互课件以动画和交互相结合的类型居多,越来越多的教育机构发现了这种课件对于幼儿的吸引力远大于其他类型的课件,随着flash逐渐被市场淘汰,动画和交互相结合的html5跨平 ...
- 指定的经纬度是否落在多边形内 java版
这个想法算法就是判断一个点向左的射线跟一个多边形的交叉点有几个,如果结果为奇数的话那么说明这个点落在多边形中,反之则不在. A: B: C: D: E: no1: no2: y1: y2: 以上的AB ...
- 13行代码实现:Python实时视频采集(附源码)
一.前言 本文是<人脸识别完整项目实战>系列博文第3部分:程序设计篇(Python版),第1节<Python实时视频采集程序设计>,本章内容系统介绍:基于Python+open ...
- MySql 的SQL执行计划查看,判断是否走索引
在select窗口中,执行以下语句: set profiling =1; -- 打开profile分析工具show variables like '%profil%'; -- 查看是否生效show p ...