
grafana使用Prometheus数据源监控mongo数据库
数据库改用mongo后,监控需求就需要整合进grafana里,由于一直在坚持docker化部署,那么此次也不例外。
1. 安装Prometheus:
What is Prometheus?
Prometheus is an open-source systems monitoring and alerting toolkit originally built at SoundCloud. Since its inception in 2012, many companies and organizations have adopted Prometheus, and the project has a very active developer and user community. It is now a standalone open source project and maintained independently of any company. To emphasize this, and to clarify the project's governance structure, Prometheus joined the Cloud Native Computing Foundation in 2016 as the second hosted project, after Kubernetes.
主要的意思就是Prometheus是一个开源的系统监控和告警工具包,通过HTTP endpoints来收集要监控的系统的指标。跟着官网的first step,只需要下载最新版本,配置prometheus.yml,启动即可,比较的简单, 因此我们docker化安装也较为容易。
1) 安装镜像
[root@vhost18 prometheus]# docker search prometheus

NAME                                          DESCRIPTION                                     STARS               OFFICIAL            AUTOMATED

prom/prometheus                                                                                                                    [OK]

basi/prometheus-swarm                         A sample image that can be used as a base fo…                                          [OK]

infinityworks/prometheus-rancher-exporter     Exposes Service/Stack/Host status from the R…                                          [OK]

linuxtips/prometheus_alpine                   Image to run Prometheus on Alpine Linux. #VA…                                          [OK]

sscaling/jmx-prometheus-exporter              A docker image containing a released version…                                          [OK]

argussecurity/cassandra-prometheus            Docker Official Cassandra image, with Promet…                                          [OK]
安装STARS最多的那个就是了。
2)编写配置文件,参考官网
# my global config

global:

  scrape_interval:     15s # Set the scrape interval to every  seconds. Default is every  minute.

  evaluation_interval: 15s # Evaluate rules every  seconds. The default is every  minute.

  # scrape_timeout is set to the global default (10s).

# Alertmanager configuration

alerting:

  alertmanagers:

  - static_configs:

    - targets:

      # - alertmanager:

# Load rules once and periodically evaluate them according to the global 'evaluation_interval'.

rule_files:

  # - "first_rules.yml"

  # - "second_rules.yml"

# A scrape configuration containing exactly one endpoint to scrape:

# Here it's Prometheus itself.

scrape_configs:

  # The job name is added as a label `job=<job_name>` to any timeseries scraped from this config.

  - job_name: 'prometheus'

    # metrics_path defaults to '/metrics'

    # scheme defaults to 'http'.

    static_configs:

    - targets: ['localhost:9090']
3)启动容器
docker run -d --name prom -p : -v /data/prometheus/:/etc/prometheus/ prom/prometheus
4)看下日志是否启动成功
docker logs -f prom

level=info ts=--11T11::.73690446Z caller=main.go: msg="Starting Prometheus" version="(version=2.5.0, branch=HEAD, revision=67dc912ac8b24f94a1fc478f352d25179c94ab9b)"

level=info ts=--11T11::.737024426Z caller=main.go: build_context="(go=go1.11.1, user=root@578ab108d0b9, date=20181106-11:40:44)"

level=info ts=--11T11::.737054274Z caller=main.go: host_details="(Linux 3.10.0-693.5.2.el7.x86_64 #1 SMP Fri Oct 20 20:32:50 UTC 2017 x86_64 72be1c67c847 (none))"

level=info ts=--11T11::.737077772Z caller=main.go: fd_limits="(soft=1048576, hard=1048576)"

level=info ts=--11T11::.737095504Z caller=main.go: vm_limits="(soft=unlimited, hard=unlimited)"

level=info ts=--11T11::.757770232Z caller=main.go: msg="Starting TSDB ..."

level=info ts=--11T11::.757939887Z caller=web.go: component=web msg="Start listening for connections" address=0.0.0.0:

level=info ts=--11T11::.769272192Z caller=main.go: msg="TSDB started"

level=info ts=--11T11::.769349241Z caller=main.go: msg="Loading configuration file" filename=/etc/prometheus/prometheus.yml

level=info ts=--11T11::.772044947Z caller=main.go: msg="Completed loading of configuration file" filename=/etc/prometheus/prometheus.yml

level=info ts=--11T11::.77209973Z caller=main.go: msg="Server is ready to receive web requests."
5) 访问http://ip:9090
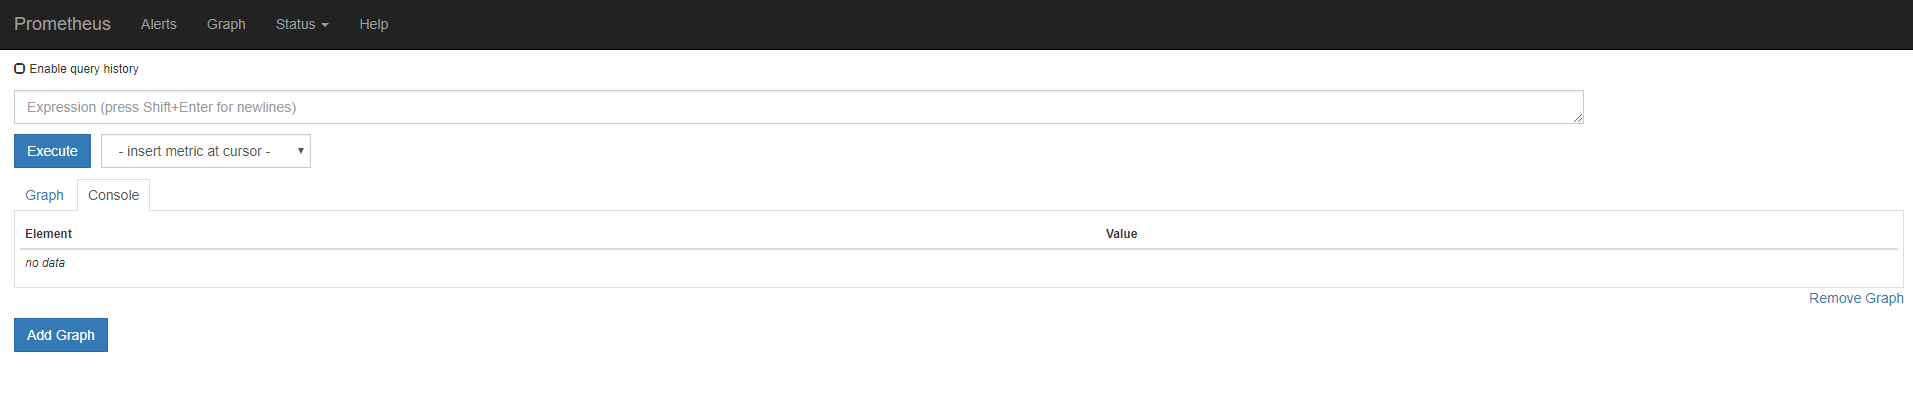
成功的话会出现以下页面
2. 安装mongodb_exporter
刚说到Prometheus是根据endpoints来获取指标数据的,由于grafana没有直接的插件来获取mongo数据库的指标数据,这时候就可以用得上mongodb_exporter了,参考1,参考2。
1)安装镜像
可以直接build刚刚参考1和参考2的Dockerfile,也可以像安装Prometheus一样直接search,我这边为了简单采用直接search的方式,方式重复不累赘描述。
2)启动镜像
docker run -d --name mongo-explorer -p : eses/mongodb_exporter --mongodb.uri mongodb://monitor:monitor@ip:port
参数需要的mongo地址直接命令传入,无需export 。
如何知道端口和参数呢,一种是看官方说明,另一种直接启动一个空镜像看日志就知道了。
3) 检查下日志
[root@vhost18 prometheus]# docker logs -f mongo-explorer

### Warning: the exporter is in beta/experimental state and field names are very

### likely to change in the future and features may change or get removed!

### See: https://github.com/percona/mongodb_exporter for updates

mongodb_exporter version: unknown, git commit hash: unknown

Listening on :
4)访问http://ip:9090
成功的话会出现以下页面

3. mongodb_exporter整合进Prometheus
1) 修改配置
只需要在prometheus.yml上添加如下框

2) 重启prometheus
docker restart prom
3) 检查
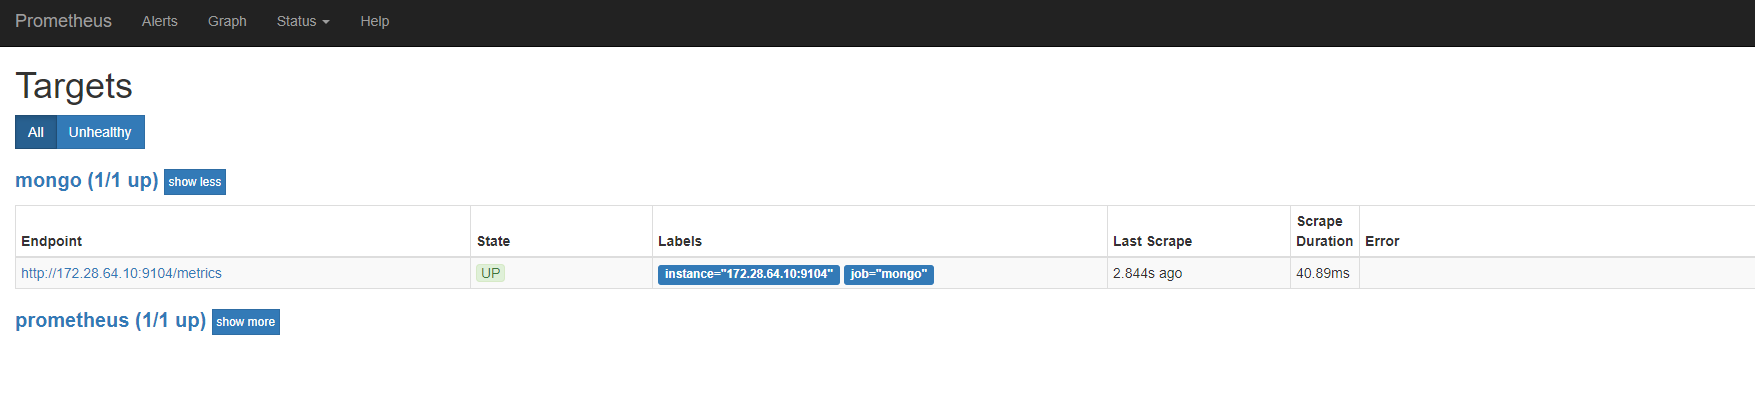
访问http://172.28.64.10:9090/targets,能看到数据源就表示成功了。
4. grafana中添加数据源

5. 安装仪表盘
到grafana官网直接搜mongo,找到自己需要的仪表盘就可以了,后续在自己改造。
grafana使用Prometheus数据源监控mongo数据库的更多相关文章
- grafana使用json数据源监控数据
功能实现完后有部分数据一直在波动,就产生了想把这个数据波动集成到grafana形成可视化界面的监控,但grafana不支持mongo数据库又懒得去用其他工具转换,特意看了下grafana的databa ...
- mongo数据库相关目录
mongodb的docker化安装 mongodb的windows系统下安装 grafana使用Prometheus数据源监控mongo数据库 mongodb副本集的docker化安装 mongodb ...
- 使用 Docker 部署 Grafana + Prometheus 监控 MySQL 数据库
一.背景 在平时开发过程当中需要针对 MySQL 数据库进行监控,这里我们可以使用 Grafana 和 Prometheus 来实现监控功能.Grafana 是一款功能强大的仪表盘面板,支持多种数据源 ...
- Grafana+Zabbix+Prometheus 监控系统
环境说明 软件 版本 操作系统 IP地址 Grafana 5.4.3-1 Centos7.5 192.168.18.231 Prometheus 2.6.1 Centos7.5 192.168.18. ...
- Grafana+Prometheus+node_exporter监控,Grafana无法显示数据的问题
环境搭建: 被测linux机器上部署了Grafana,Prometheus,node_exporter,并成功启动了它们. Grafana中已经创建了Prometheus数据源,并测试通过,并且导入了 ...
- windows下部署Grafana +prometheus平台监控
1.Prometheus简介 Prometheus基于Golang编写,编译后的软件包,不依赖于任何的第三方依赖.用户只需要下载对应平台包,解压并且添加基本的配置即可正常启Prometheus S ...
- Grafana、Prometheus、mtail-日志监控
一:日志如何监控 在上一篇博客Grafana.Prometheus-监控平台中,简单了解了Grafana与Prometheus对项目做特定的监控打点,可视化的配置操作. 但是对于没有设置监控或者不容易 ...
- Prometheus MySQL监控+grafana展示
前言 最近爱上了研究各种杂七杂八的技术. Prometheus是现如今最火的监控软件之一.做为一个运维DBA,不会这个可就OUT了. 本篇博客,演示一下prometheus之通过mysql expor ...
- 【集群监控】Docker上部署Prometheus+Alertmanager+Grafana实现集群监控
Docker部署 下载 sudo yum-config-manager --add-repo https://download.docker.com/linux/centos/docker-ce.re ...
随机推荐
- java调用c#dll文件配置
1 在强大的c#语言和java语言之间,二者难免会因为某些特殊的要求会相互调用. 下面就以java调用c#的dll为例做详细介绍 1 在vs中的环境设置如下图,图片中程序仅作为讲解程序,在项目编译成 ...
- ArcMap没有工具条和菜单栏的解决方法
问题: 在安装ArcGIS10后,打开竟然没有菜单栏和工具栏,安装10.1又有,卸了重装10还是没有 解决办法: 在ArcMap的状态栏上双击,在弹出的自定义对话框中,在Toolbars工具栏选择Ma ...
- qt中的lineEdit文本输入框的输入类型限制(三种验证类)
qt的三种验证类: 1.输入int类型 QValidator *validator=new QIntValidator(100,999,this): QLineEdit *edit=new QLine ...
- 网络威胁防护,Azure 靠的是它?
在当今数字化转型的浪潮中,越来越多的企业希望转型于云.使用云能帮助企业提高工作效率.降低 IT 成本.增强竞争优势,有效推动企业的业务发展.但是,在向云迁移的过程中,基于云的数据中心更有可能被攻击,所 ...
- Hive的运算和函数大全
hive 常用运算 测试各种内置函数的快捷方法: 创建一个 dual 表 create table dual(id string); load 一个文件(只有一行内容:内容为一个空格)到 dual 表 ...
- c#中 定时器周期执行某事件 以及,重置 定时器重新计时的方法
static void Main(string[] args) { System.Timers.Timer timer = new System.Timers.Timer(); timer.Enabl ...
- Shell脚本批量修改图片尺寸
#!/bin/sh function scandir(){ local cur_dir parent_dir workdir workdir=$ cd ${workdir} if [ ${workdi ...
- 再学UML-Bug管理系统UML2.0建模实例(四)
3.3 顺序图(实现模型) 在系统设计与实现阶段我们也可以使用顺序图进行建模,此时通过顺序图可以明确表示系统设计中对象之间的交互,考虑到具体系统实现,对象之间通过方法调用传递消息.在BMS系统中,对每 ...
- iTunes备份路径,iTunes默认备份路径,iTunes修改备份路径
1:当前iTunes版本: 2:帮助给出的答复: 3:修改的操作界面: 实际文件夹路径:
- bootstrap table 分页只显示分页不显示总页数等数据
搜了下没找到解决方案,就用CSS来解决了. 把paginationDetailHAlign:"right",使pagination-detail的class为.pull-right ...