
php Debugging with Xdebug and Sublime Text 3(转)
Debugging – we all do it a lot. Writing code perfectly the first time around is hard and only a few (if any) succeed at it. More than a year ago, Shameer wrote an article on SitePoint about how you can debug your application using Xdebug and Netbeans. In this article, we are going to have a look at how we can debug using Xdebug in combination with Sublime Text.
Getting started
First of all, we need to have the PHP Xdebug extension installed. If you are uncertain on how to get this done, please have a look at the link provided in the introduction. Make sure that Xdebug is working by checking if it’s listed in your phpinfo().
Of course we also need Sublime Text. I will be using the latest version:
Sublime Text 3. It should also work with Sublime Text 2.
Setting up Xdebug
We need to configure xdebug by adding the following to your php.ini file, or even better, to an xdebug.ini file as described here under How-to On Linux.
xdebug.remote_enable=1

xdebug.remote_handler=dbgp

xdebug.remote_host=127.0.0.1

xdebug.remote_port=9000

xdebug.remote_log="/var/log/xdebug/xdebug.log"
In general you will be using 127.0.0.1 as your host. However, If you are using vagrant for example, you will be using something like 10.0.2.2, depending on where Xdebug can find your system.
The remote log is not necessary, but in case of problems, it’s the place where you can find information about errors that occurred.
Don’t forget to restart your webserver!
Setting up Sublime Text 3
One of the strengths of Sublime is the fact that you can extend it easily with packages. In this case, we are going to install the Xdebug package. If you haven’t done so already, make sure you can install packages by installing package control.
Once you have the package control installed, you should start Sublime Text 3. Open up the command palette from the tools menu and search for “install package”.
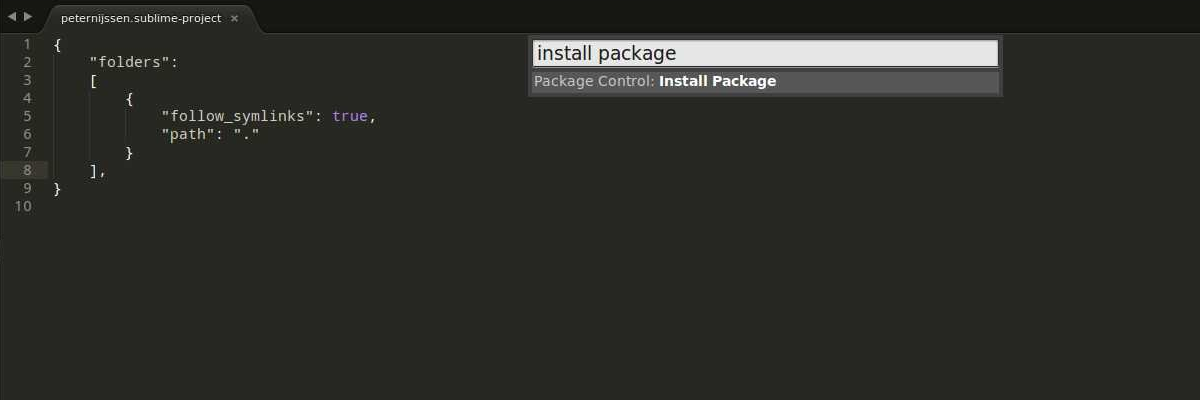
Now you can search for any package you like. In our case, we are going to search for the package “Xdebug client”.

The last bit we have to do is set up the project within Sublime. The
easiest way to do this is to open up the root directory of your
application, go to projects and click on “save projects as”. I suggest
you save the file within the root of your application, so you can save
it in your version control system if you are using any and you can
configure it easily at all times.
Open up the just created project file. The content will look like this:
{

    "folders":

    [

        {

           "follow_symlinks": true,

           "path": "."

        }

    ]

}
We are going to add a few more lines:
{

    "folders":

    [

        {

            "follow_symlinks": true,

            "path": "."

        }

    ],

    "settings": {

        "xdebug": {

             "url": "http://my.local.website/",

        }

    }

}
As you can see, I only added a URL to my actual web application. I could set more settings for Xdebug, however, this is enough to start with. I could have also set this URL in the Xdebug settings itself, but in that case, I couldn’t work on multiple projects without having to change the Xdebug config each time.
Start the Xdebug session
We can now start the Xdebug session to see if everything is set up properly. In the menu, click on tools -> Xdebug and click on start debugging (launch browser). You will notice that your website is opened up and that ?XDEBUG_SESSION_START=sublime.xdebug is added to the end of the URL. This will start the xdebug session. In Sublime, some extra panels appear where debug information will be shown, after you have set one or more breakpoints.
Breakpoints
Let’s set out first breakpoint. A breakpoint is basically a flag where your application will halt when it reaches it. At the moment it halts, you can inspect all the variables’ values so you know actually what is going on.
We can add a breakpoint by clicking with our right mouse on a line, going to Xdebug and then clicking on add/remove breakpoint. A marker will be added to the line gutter to indicate that a breakpoint has been set.
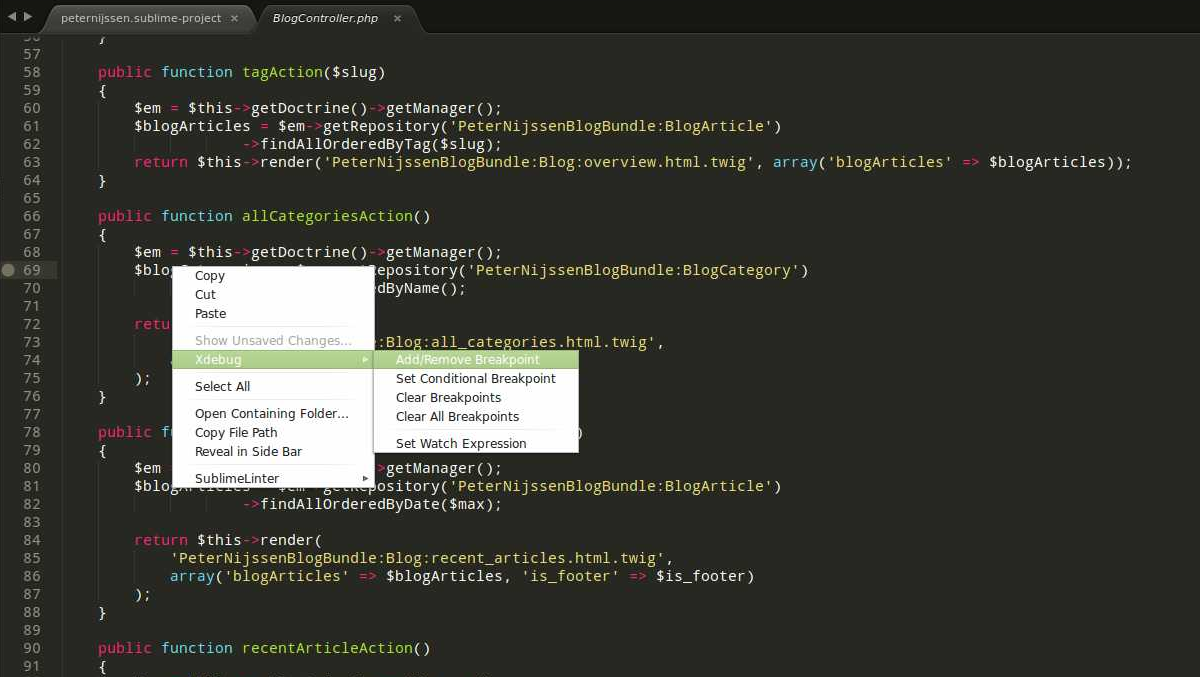
We open up our browser again and continue with the session we just started. You will notice that as soon as you go to the page where the breakpoint is, the page will stop loading. If you now open up Sublime, you will see a lot of information shown in the Xdebug panels.
The Xdebug stack and Xdebug context are very interesting. In the stack, you can see the whole stacktrace your call went through.
In the context, you will see all global variables, but also the variables you defined yourself. You can click on these variables to see exactly these variables are holding. For instance, in the screenshot below, I clicked on the $_SERVER variable.
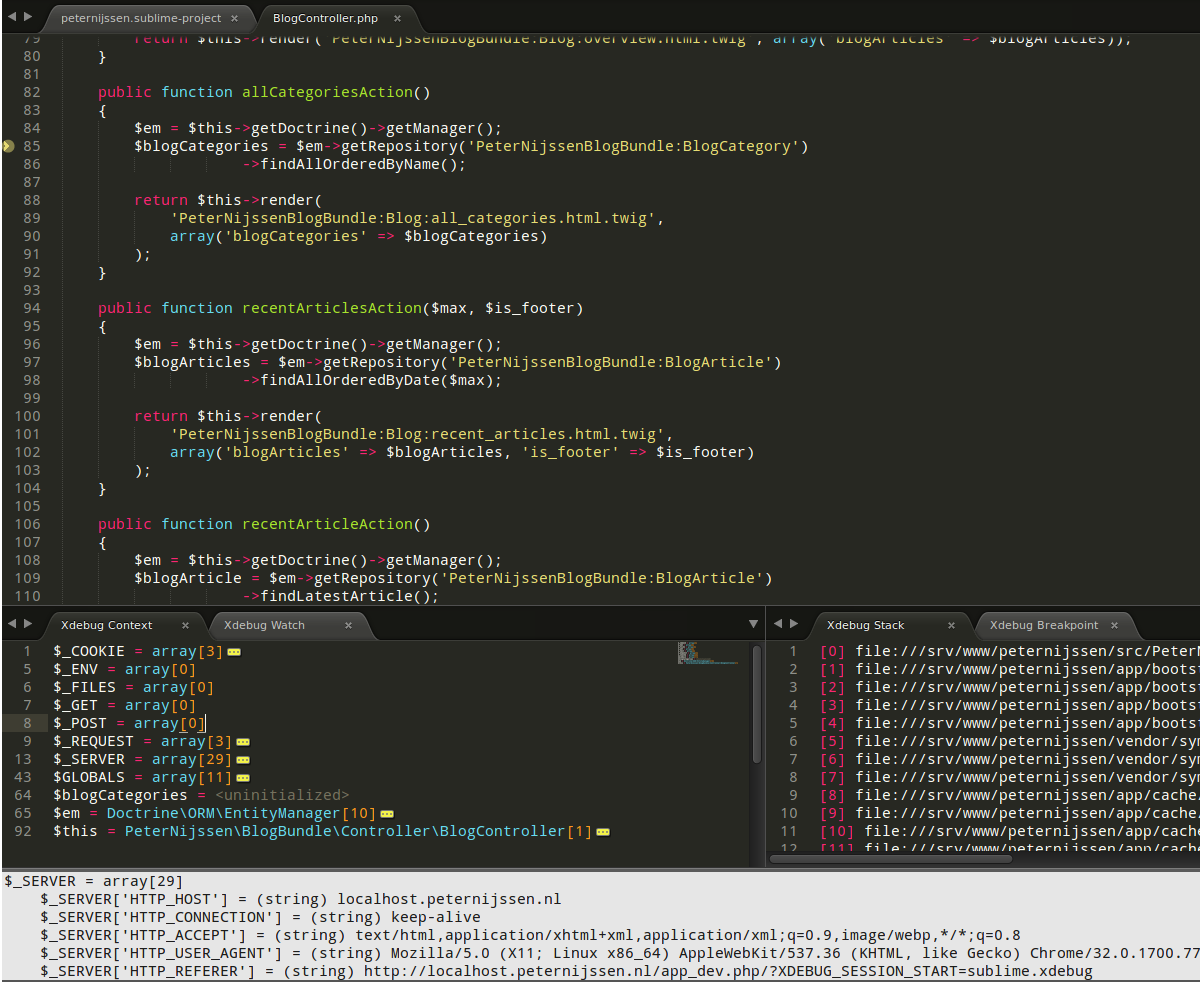
Notice that a yellow arrow is pointing at the line the application is currently halted on.
So our application halted and now we can look through the variables defined. However, we are done and we want to move on. What now? When you right mouse click once again and hover over the Xdebug menu, you will have several options:
- Run Which will run the application until the next breakpoint or until the ending.
- Run to line which will run until the line you clicked.
- Step into will step into the current function and stops right after.
- Step over Will step over the current function and stops right after.
- Step out Will step out of the current function and stop right after.
- Stop Will stop debugging.
- Detach Will also stop debugging.
Run and stop are quite easy to understand. The step methods could be a little confusing. Let’s dive into these with a simple example.
Class Foo()

{

    public function bar(Array $arr)

    {

        $arr = self::fooBar($arr); // Breakpoint

        return $arr;

    }

    public function fooBar(Array $arr)

    {

        return array_values($arr);

    }

}
Imagine you added a breakpoint to the first line of the method bar. So on the line with the breakpoint comment (// breakpoint).
With step into, the debugger will step into the fooBar method and will stop there at the first line. So in this case, the debugger will halt on the return array_values($arr); line.
Step over will call the method, but will not stop. It will stop at the next line available after calling the method. So in this case, it will stop at return $arr;
Lastly, with step out it will run through the whole bar method and return to the caller. In this case, it will go out of the object, back to the original caller.
If you just decide to run, the application will run further until the moment it is done executing or another breakpoint occurs.
Conclusion
In this article we saw how we could integrate Xdebug with Sublime and made sure we understood how to debug. Almost every IDE suitable for PHP can integrate with Xdebug. If you are interested in debugging like this in Netbeans, have a look at the article mentioned in the introduction. Are you using breakpoints? Or are you using PHP functions like var_dump to get your debug data? Let us know in the comments below!
Was this helpful?
 Peter Nijssen
php Debugging with Xdebug and Sublime Text 3(转)的更多相关文章
- Provides PHP completions for Sublime Text
来源:https://packagecontrol.io/packages/PHP%20Completions%20Kit php-completions php-completions plugin ...
- 配置 Sublime Text 3 作为Python R LaTeX Markdown IDE
配置 Sublime Text 3 作为Python R LaTeX Markdown IDE 配置 Sublime Text 3 作为Python IDE IDE的基本功能:代码提醒.补全:编译文件 ...
- sublime text plugins
Sublime Text 插件,HTML+CSS+JAVASCRIPT+JSON快速格式化: htmlpretty 快捷键:Ctrl+Shift+H Essential Sublime Text 2 ...
- COMPILING ACTIONSCRIPT 3.0 WITH SUBLIME TEXT 2
At Clock we typically spend our time developing JavaScript and PHP, however, occasionally Flash pres ...
- Sublime Text 3中文乱码解决方法以及安装包管理器方法
一般出现乱码是因为文本采用了GBK编码格式,Sublime Text默认不支持GBK编码. 安装包管理器 简单安装 使用Ctrl+`快捷键或者通过View->Show Console菜单打开命令 ...
- 在Sublime Text 3上安装代码格式化插件CodeFormatter
1.了解CodeFormatter插件 在Sublime Text 3中编写代码,为了能让我们的代码格式变得漂亮整洁,需要一个能自动格式代码的插件.这里发现CodeFormatter插件不错,它能支持 ...
- sublime text 3 + python配置,完整搭建及常用插件安装
四年的时间,一直使用EmEditor编辑器进行Python开发,之前是做面向过程,只需要将一个单独的py文件维护好即可,用着也挺顺手,但是最近在做面向对象的开发,不同的py文件中相互关联较多,感觉单纯 ...
- 前端工程师手中的Sublime Text
原文地址:http://css-tricks.com/sublime-text-front-end-developers/ 我的Blog:http://cabbit.me/sublime-text-f ...
- Sublime Text 全程指引 by Lucida
作者:Lucida 微博:@peng_gong 豆瓣:@figure9 博客园:@figure9 原文链接:http://zh.lucida.me/blog/sublime-text-complete ...
随机推荐
- Django中ModelForm应用
Django中ModelForm的应用 在传统中Form提交的POST的数据在服务器端获取时将不得不一一获取并验证数据的可靠性,但是使用django提供的Form时可简化该过程并提供相应的验证,同时D ...
- PagedList 分页
@using PagedList.Mvc;@model PagedList.IPagedList<MvcApplicationBootStramp.Models.Person> @{ ...
- 获取UILabel上最后一个字符串的位置。获取文字长度和高度,自动换行
//行的高度. -(CGFloat)tableView:(UITableView *)tableView heightForRowAtIndexPath:(NSIndexPath *)indexPat ...
- 驱动编程思想之初体验 --------------- 嵌入式linux驱动开发之点亮LED
这节我们就开始开始进行实战啦!这里顺便说一下啊,出来做开发的基础很重要啊,基础不好,迟早是要恶补的.个人深刻觉得像这种嵌入式的开发对C语言和微机接口与原理是非常依赖的,必须要有深厚的基础才能hold的 ...
- (转)创建和查看Javadoc文档
原地址:http://jinnaxu-tju-edu-cn.iteye.com/blog/667177 Javadoc是Sun公司提供的一个技术,它从程序源代码中抽取类.方法.成员等注释形成一个和源代 ...
- git configuration
git的配置文件由section名和变量名组成: [user] name = abc emial = example.com []里面的user就是section名,section只能由字母,数字,- ...
- CentOS安装配置ganglia
1. 下载ganglia源码包并解压 wget http://sourceforge.net/projects/ganglia/files/ganglia%20monitoring%20cor ...
- PHP函数参数的引用传递和值传递
函数的参数传递有两种方式 1,值传递 常见的 test($param) 方式就是值传递,在函数内部修改$param,不会影响外部变量$param的值 2,引用传递 参数是引用传递的方式,此时函数内部 ...
- set up size, title to tcl tk main window
#!/usr/bin/wish wm title . "this is main title" wm geometry . 500x300+30+200 500 --width 3 ...
- STM32之------独立看门狗(IWDG)和窗体看门狗(WWDG)
一 前沿废语: 之前有很风靡的游戏,名字叫<看门狗>.该游戏用了很新的引擎技术,打造出了一个辽阔庞大的世界,内容是玩家Aiden·Pearce(主角)是一名精通黑客技术的高手,当时 ...