Prometheus 监控进程
Process-exporter
process-exporter可以用来检测所选进程的存活状态
下载process-exporter
下载地址:https://github.com/ncabatoff/process-exporter/releases/tag/v0.4.0
安装部署process-exporter
tar -zxvf process-exporter-0.4.0.linux-amd64.tar.gz -C /usr/local/process-exporter
编写配置文件
vim process-exporter-ncabatoff.yaml

process_names:

  - name: "{{.Matches}}"

    cmdline:

    - 'redis-server'

  - name: "{{.Matches}}"

    cmdline:

    - 'mysqld'

  - name: "{{.Matches}}"

    cmdline:

    - 'org.apache.zookeeper.server.quorum.QuorumPeerMain'

  - name: "{{.Matches}}"

    cmdline:

    - 'org.apache.hadoop.mapreduce.v2.hs.JobHistoryServer'

  - name: "{{.Matches}}"

    cmdline:

    - 'org.apache.hadoop.hdfs.qjournal.server.JournalNode'
注 cmdline: 所选进程的唯一标识,ps -ef 可以查询到。如果改进程不存在,则不会有该进程的数据采集到。
编写启动脚本
vim /usr/lib/systemd/system/process_exporter.service

[Unit]

Description=Prometheus exporter for processors metrics, written in Go with pluggable metric collectors.

Documentation=https://github.com/ncabatoff/process-exporter

After=network.target

[Service]

Type=simple

User=prometheus

WorkingDirectory=/usr/local/process-exporter

ExecStart=/usr/local/process-exporter/process-exporter -config.path=/usr/local/process-exporter/process-exporter-ncabatoff.yaml

Restart=on-failure

[Install]

WantedBy=multi-user.target
启动process-exporter
systemctl daemon-reload

systemctl start process_exporter

systemctl enable process_exporter
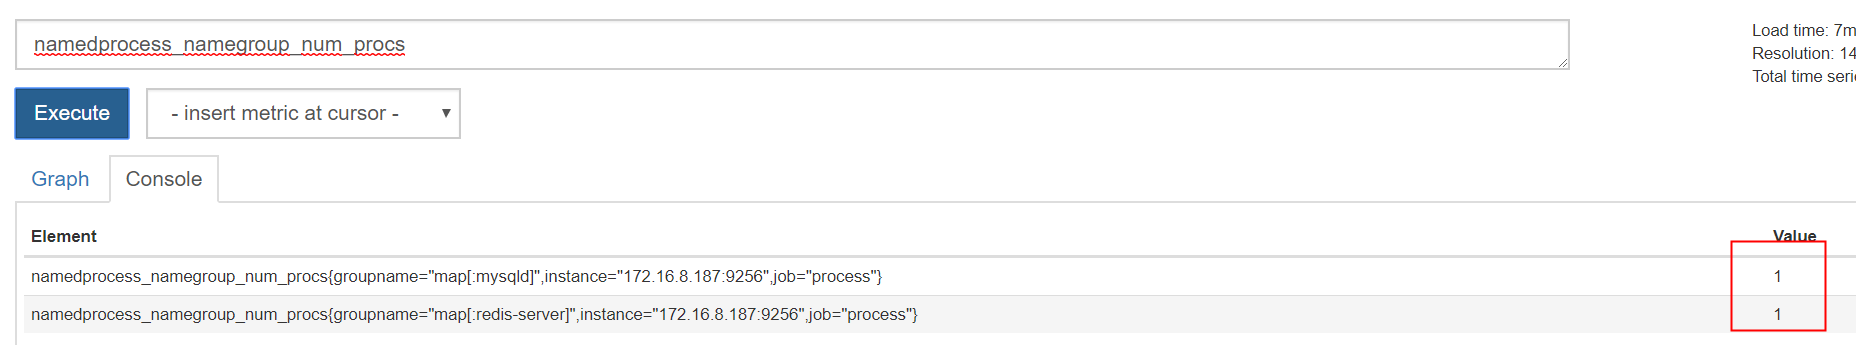
验证
curl localhost:9256/metrics
修改Prometheus配置文件
增加

 - job_name: 'process'

    static_configs:

    - targets: ['172.16.8.187:9256']
重启Prometheus
Prometheus 监控进程的更多相关文章
- Prometheus — Process-exporter进程监控
由于我们常用的node_exporter并不能覆盖所有监控项,这里我们使用Process-exporter 对进程进行监控. 安装process-exporter wget https://githu ...
- Kubernetes容器集群管理环境 - Prometheus监控篇
一.Prometheus介绍之前已经详细介绍了Kubernetes集群部署篇,今天这里重点说下Kubernetes监控方案-Prometheus+Grafana.Prometheus(普罗米修斯)是一 ...
- Prometheus 监控领域最锋利的“瑞士军刀”
原文:https://mp.weixin.qq.com/s/Cujn6_4w8ZcXCOWpoAStvQ 一.Kubernetes 容器监控的标配—Prometheus 1.简介 Prometheus ...
- Prometheus(三):Prometheus监控交换机(snmp)
默认已安装Prometheus服务,服务地址:192.168.56.200 一.获取交换机snmp信息 snmp服务IP(交换机IP):172.20.2.83 snmp community:dfete ...
- prometheus监控redis,redis-cluster
Prometheus监控redis使用的是redis_exporter, 作者GitHub: https://github.com/oliver006/redis_exporter 需要说明的是: r ...
- prometheus 监控ElasticSearch核心指标
ES监控方案 本文主要讲述使用 Prometheus监控ES,梳理核心监控指标并构建 Dashboard ,当集群有异常或者节点发生故障时,可以根据性能图表以高效率的方式进行问题诊断,再对核心指标筛选 ...
- 如何利用Prometheus监控你的应用
Prometheus作为一套完整的开源监控接近方案,因为其诸多强大的特性以及生态的开放性,俨然已经成为了监控领域的事实标准并在全球范围内得到了广泛的部署应用.那么应该如何利用Prometheus对我们 ...
- Prometheus监控node-exporter常用指标含义
一.说明 最近使用Prometheus新搭建监控系统时候发现内存采集时centos6和centos7下内存监控指标采集计算公式不相同,最后采用统一计算方法并整理计算公式如下: 1 100-(node_ ...
- 03 . Prometheus监控容器和HTTP探针应用
Eeporter是什么及来源? 是什么? 广义上讲所有可以向Prometheus提供监控样本数据的程序都可以被称为一个Exporter.而Exporter的一个实例称为target,如下所示,Prom ...
随机推荐
- 读书笔记(chapter4)
进程调度 4.1多任务 1.多任务系统可以划分为:非抢占式多任务和抢占式多任务: (在此模式下,由调度程序来决定什么时候停止一个进程的运行,以便其他进程能够得到执行机会,这个动作叫抢占: 时间片实际上 ...
- HanderBar
对于java开发,涉及到页面展示时,比较主流的有两种解决方案: 1. struts2+vo+el表达式. 这种方式,重点不在于struts2,而是vo和el表达式,其基本思想是:根据页面需要的信息,构 ...
- mybatis集成redis
系统原生集成的Ehcache, 但是监控需要(version 2.7),Ehcache Monitor http://www.ehcache.org/documentation/2.7/operati ...
- redis演练
如何查看所有的key:keys * 如何查询某个key的value:get keyname
- Jfrog Artifactory jenkins 流水线使用docker的方式培训[暂未成功]
1. 创建jenkins的流水线 2. 创建artifactory的镜像仓库 3. 创建generic的仓库上传需要的 war包还有tar包. 4. 修改pipeline的 脚本 主要修改的地方. 修 ...
- Win10 1803 Spring Creators update Consumer edition的版本记录
安装时可选择的版本列表 安装完之后的版本: 3. 时间线更新 4. Focus assistant
- WebService相关
1.WebService 之 WSDL文件 讲解 2.WSDL样式详解 3.IntelliJ IDEA 开发 WebService 4.浅谈WebService的调用 5.用IDEA8快速开发WebS ...
- jmeter作用域规则
创建测试计划时,会创建一个有序的一系列将要被执行的请求列表,这些请求通常被组织在有序的控制器下 一些控制器会影响包含在它下面的请求顺序 ,这些特殊的控制器可以参考这里:the component re ...
- java程序在windows系统作为服务程序运行
Java程序很多情况下是作为服务程序运行的,在Un*x 平台下可以利用在命令后加“&”把程序作为后台服务运行,但在Windows下看作那个Console窗口在桌面上,你是否一直担心别的同时把你 ...
- Linux文件权限属性后面有个点
坑啊,新上的机器,监控怎么都不好使,各种报错说:没有权限 什么情况? 仔细查看,发现文件权限属性后面怎么多了个点,类似如下: 这是什么? 原来: 开启了SELinux功能的Linux系统就会有这个点. ...