
[转].NET 性能测试工具 -- 事件跟踪器(ETW)
内容预告:
- Windows内置工具(性能计数器)
- 事件跟踪器(WPT,PerfMoniter,PerfView,自定义ETW)
- 时间分析
- 内存分配分析
- 内存使用量分析
- 其他分析
Event Tracing for Windows(ETW)可以查看很多内核和CLR的性能数据,如下表所示,有几个工具都是基于ETW开发的,后面会详细介绍:
| Kernel | PROC_THREAD | Creation and destruction of processes and threads | |
| Kernel | LOADER | Load and unload of images (DLLs, drivers, EXEs) | |
| Kernel | SYSCALL | System calls | |
| Kernel | DISK_IO | Disk I/O reads and writes (including head location) | |
| Kernel | HARD_FAULTS | Page faults that resulted in disk I/O (not satisfied from memory) | |
| Kernel | PROFILE | Sampling event—a stack trace of all processors collected every 1ms | |
| CLR | GCKeyword | Garbage collection statistics and information | Collection started, collection ended, finalizers run, ~100KB of memory have been allocated |
| CLR | ContentionKeyword | Threads contend for a managed lock | Contention starts (a thread begins waiting), contention ends |
| CLR | JITTracingKeyword | Just in time compiler (JIT) information | Method inlining succeeded, method inlining failed |
| CLR | ExceptionKeyword | Exceptions that are thrown |
Windows Performance Toolkit (WPT)是ETW的工具集,捕获ETW事件到日志文件。可以在http://msdn.microsoft.com/en-us/performance/cc752957.aspx 下载。
使用步骤如下:
- 在环境变量里将_NT_SYMBOL_PATH的值设置到微软的公开符号服务器和本地符号缓存,如C:\Temp\Symbols*http://msdl.microsoft.com/download/symbols
- 在环境变量里_NT_SYMCACHE_PATH的值设置到一个自定义目录。
- 打开管理员权限的cmd窗口定位到安装文件夹(如C:\Program Files\Windows Kits\8.0\Windows Performance Toolkit)。
- 运行xperf -on Base开始跟踪内核数据
- 随便运行一些程序
- 停止跟踪,输出日志。xperf -d KernelTrace.etl
- 打开图形分析器 xperfview KernelTrace.etl
WPT的运用场景是:
- 捕获硬盘IO操作

- 提供所有CPU的活动

- 显示IO,内存,CPU等的叠加图

- 显示调用栈

最新的Windows SDK8.0包含一些新工具,叫做Windows Performance Recorder (wpr.exe) 和Windows Performance Analyzer (wpa.exe), 是为了替代XPerf 和XPerfView的。wpr -start和xperf -on相同,wpr -stop和xperf -d 一样。WPA分析UI和XPerfView的功能一样,更多信息可以参考 http://msdn.microsoft.com/en-us/library/hh162962.aspx.
XPerfView可以看GC事件的数据:

PerfMonitor是一个开源的控制台工具 http://bcl.codeplex.com/releases/view/49601.
PerfMonitor的优点是可以更细节地分析CLR和JIT。
使用方法如下:

C:\PerfMonitor > perfmonitor runAnalyze JackCompiler.exe

Starting kernel tracing. Output file: PerfMonitorOutput.kernel.etl

Starting user model tracing. Output file: PerfMonitorOutput.etl

Starting at 4/7/2012 12:33:40 PM

Current Directory C:\PerfMonitor

Executing: JackCompiler.exe {

} Stopping at 4/7/2012 12:33:42 PM = 1.724 sec

Stopping tracing for sessions 'NT Kernel Logger' and 'PerfMonitorSession'.

Analyzing data in C:\PerfMonitor\PerfMonitorOutput.etlx

GC Time HTML Report in C:\PerfMonitor\PerfMonitorOutput.GCTime.html

JIT Time HTML Report in C:\PerfMonitor\PerfMonitorOutput.jitTime.html

Filtering to process JackCompiler (1372). Started at 1372.000 msec.

Filtering to Time region [0.000, 1391.346] msec

CPU Time HTML report in C:\PerfMonitor\PerfMonitorOutput.cpuTime.html

Filtering to process JackCompiler (1372). Started at 1372.000 msec.

Perf Analysis HTML report in C:\PerfMonitor\PerfMonitorOutput.analyze.html

PerfMonitor processing time: 7.172 secs.
上面的统计结果包括:
- CPU统计,CPU利用率。
- GC统计,GC时间,最大GC堆是4.5MB,内存分配速率最高是1496.1MB/秒,平均GC暂停时间是0.1MS。
- JIT编译统计,159个函数在运行时被JIT编译,共30493个机器字节。
下图表明CPU做的最多的工作是这3个函数:System.String.Concat, JackCompiler.Tokenizer.Advance, 和System.Linq.Enumerable.Contains

84.2%的CPU时间花在了:JackCompiler.Parser.Parse, 调用了ParseClass, ParseSubDecls, ParseSubDecl, ParseSubBody

下图是一些GC事件的细节统计:

PerfView:一个免费工具,可以分析堆的使用。在http://www.microsoft.com/download/en/details.aspx?id=28567 下载。

上面的报告包括了:
- 原始的ETW事件列表。
- CPU在栈上使用时间的分组。
- 镜象加载,硬盘IO,GC使用栈的情况。
- GC统计。
PerfView还可以生成堆的快照。
自定义 ETW Providers:也可以自己开发基于ETW的性能数据统计工具。.NET4.5之前输出ETW数据相当困难,.NET4.5要容易很多了,继承System.Diagnostics.Tracing.EventSource类然后调用 WriteEvent函数就可以输出了。
public class CustomEventSource : EventSource {

public class Keywords {

public const EventKeywords Loop = (EventKeywords)1;

public const EventKeywords Method = (EventKeywords)2;

}

[Event(1, Level = EventLevel.Verbose, Keywords = Keywords.Loop,

Message = "Loop {0} iteration {1}")]

public void LoopIteration(string loopTitle, int iteration) {

WriteEvent(1, loopTitle, iteration);

}

[Event(2, Level = EventLevel.Informational, Keywords = Keywords.Loop,

Message = "Loop {0} done")]

public void LoopDone(string loopTitle) {

WriteEvent(2, loopTitle);

}

[Event(3, Level = EventLevel.Informational, Keywords = Keywords.Method,

Message = "Method {0} done")]

public void MethodDone([CallerMemberName] string methodName = null) {

WriteEvent(3, methodName);

}

}

class Program {

static void Main(string[] args) {

CustomEventSource log = new CustomEventSource();

for (int i = 0; i < 10; ++i) {

Thread.Sleep(50);

log.LoopIteration("MainLoop", i);

}

log.LoopDone("MainLoop");

Thread.Sleep(100);

log.MethodDone();

}

}
PerfMonitor工具可以自动从程序获得ETW的事件数据:
C:\PerfMonitor > perfmonitor monitorDump Ch02.exe

Starting kernel tracing. Output file: PerfMonitorOutput.kernel.etl

Starting user model tracing. Output file: PerfMonitorOutput.etl

Found Provider CustomEventSource Guid ff6a40d2-5116-5555-675b-4468e821162e

Enabling provider ff6a40d2-5116-5555-675b-4468e821162e level: Verbose keywords:

0xffffffffffffffff

Starting at 4/7/2012 1:44:00 PM

Current Directory C:\PerfMonitor

Executing: Ch02.exe {

} Stopping at 4/7/2012 1:44:01 PM = 0.693 sec

Stopping tracing for sessions 'NT Kernel Logger' and 'PerfMonitorSession'.

Converting C:\PerfMonitor\PerfMonitorOutput.etlx to an XML file.

Output in C:\PerfMonitor\PerfMonitorOutput.dump.xml

PerfMonitor processing time: 1.886 secs.
其实还有一个东西叫做Windows Management Instrumentation (WMI).这里没有提到,它可以获取到系统状态,BIOS固件,等数据。文档见 http://msdn.microsoft.com/en-us/library/windows/desktop/aa394582.aspx
内容预告:
- Windows内置工具(性能计数器)
- 事件跟踪器(WPT,PerfMoniter,PerfView,自定义ETW)
- 时间分析
- 内存分配分析
- 内存使用量分析
- 其他分析
Event Tracing for Windows(ETW)可以查看很多内核和CLR的性能数据,如下表所示,有几个工具都是基于ETW开发的,后面会详细介绍:
| Kernel | PROC_THREAD | Creation and destruction of processes and threads | |
| Kernel | LOADER | Load and unload of images (DLLs, drivers, EXEs) | |
| Kernel | SYSCALL | System calls | |
| Kernel | DISK_IO | Disk I/O reads and writes (including head location) | |
| Kernel | HARD_FAULTS | Page faults that resulted in disk I/O (not satisfied from memory) | |
| Kernel | PROFILE | Sampling event—a stack trace of all processors collected every 1ms | |
| CLR | GCKeyword | Garbage collection statistics and information | Collection started, collection ended, finalizers run, ~100KB of memory have been allocated |
| CLR | ContentionKeyword | Threads contend for a managed lock | Contention starts (a thread begins waiting), contention ends |
| CLR | JITTracingKeyword | Just in time compiler (JIT) information | Method inlining succeeded, method inlining failed |
| CLR | ExceptionKeyword | Exceptions that are thrown |
Windows Performance Toolkit (WPT)是ETW的工具集,捕获ETW事件到日志文件。可以在http://msdn.microsoft.com/en-us/performance/cc752957.aspx 下载。
使用步骤如下:
- 在环境变量里将_NT_SYMBOL_PATH的值设置到微软的公开符号服务器和本地符号缓存,如C:\Temp\Symbols*http://msdl.microsoft.com/download/symbols
- 在环境变量里_NT_SYMCACHE_PATH的值设置到一个自定义目录。
- 打开管理员权限的cmd窗口定位到安装文件夹(如C:\Program Files\Windows Kits\8.0\Windows Performance Toolkit)。
- 运行xperf -on Base开始跟踪内核数据
- 随便运行一些程序
- 停止跟踪,输出日志。xperf -d KernelTrace.etl
- 打开图形分析器 xperfview KernelTrace.etl
WPT的运用场景是:
- 捕获硬盘IO操作
- 提供所有CPU的活动
- 显示IO,内存,CPU等的叠加图
- 显示调用栈
最新的Windows SDK8.0包含一些新工具,叫做Windows Performance Recorder (wpr.exe) 和Windows Performance Analyzer (wpa.exe), 是为了替代XPerf 和XPerfView的。wpr -start和xperf -on相同,wpr -stop和xperf -d 一样。WPA分析UI和XPerfView的功能一样,更多信息可以参考 http://msdn.microsoft.com/en-us/library/hh162962.aspx.
XPerfView可以看GC事件的数据:
PerfMonitor是一个开源的控制台工具 http://bcl.codeplex.com/releases/view/49601.
PerfMonitor的优点是可以更细节地分析CLR和JIT。
使用方法如下:
C:\PerfMonitor > perfmonitor runAnalyze JackCompiler.exe

Starting kernel tracing. Output file: PerfMonitorOutput.kernel.etl

Starting user model tracing. Output file: PerfMonitorOutput.etl

Starting at 4/7/2012 12:33:40 PM

Current Directory C:\PerfMonitor

Executing: JackCompiler.exe {

} Stopping at 4/7/2012 12:33:42 PM = 1.724 sec

Stopping tracing for sessions 'NT Kernel Logger' and 'PerfMonitorSession'.

Analyzing data in C:\PerfMonitor\PerfMonitorOutput.etlx

GC Time HTML Report in C:\PerfMonitor\PerfMonitorOutput.GCTime.html

JIT Time HTML Report in C:\PerfMonitor\PerfMonitorOutput.jitTime.html

Filtering to process JackCompiler (1372). Started at 1372.000 msec.

Filtering to Time region [0.000, 1391.346] msec

CPU Time HTML report in C:\PerfMonitor\PerfMonitorOutput.cpuTime.html

Filtering to process JackCompiler (1372). Started at 1372.000 msec.

Perf Analysis HTML report in C:\PerfMonitor\PerfMonitorOutput.analyze.html

PerfMonitor processing time: 7.172 secs.
上面的统计结果包括:
- CPU统计,CPU利用率。
- GC统计,GC时间,最大GC堆是4.5MB,内存分配速率最高是1496.1MB/秒,平均GC暂停时间是0.1MS。
- JIT编译统计,159个函数在运行时被JIT编译,共30493个机器字节。
下图表明CPU做的最多的工作是这3个函数:System.String.Concat, JackCompiler.Tokenizer.Advance, 和System.Linq.Enumerable.Contains
84.2%的CPU时间花在了:JackCompiler.Parser.Parse, 调用了ParseClass, ParseSubDecls, ParseSubDecl, ParseSubBody
下图是一些GC事件的细节统计:
PerfView:一个免费工具,可以分析堆的使用。在http://www.microsoft.com/download/en/details.aspx?id=28567 下载。
上面的报告包括了:
- 原始的ETW事件列表。
- CPU在栈上使用时间的分组。
- 镜象加载,硬盘IO,GC使用栈的情况。
- GC统计。
PerfView还可以生成堆的快照。
自定义 ETW Providers:也可以自己开发基于ETW的性能数据统计工具。.NET4.5之前输出ETW数据相当困难,.NET4.5要容易很多了,继承System.Diagnostics.Tracing.EventSource类然后调用 WriteEvent函数就可以输出了。
public class CustomEventSource : EventSource {

public class Keywords {

public const EventKeywords Loop = (EventKeywords)1;

public const EventKeywords Method = (EventKeywords)2;

}

[Event(1, Level = EventLevel.Verbose, Keywords = Keywords.Loop,

Message = "Loop {0} iteration {1}")]

public void LoopIteration(string loopTitle, int iteration) {

WriteEvent(1, loopTitle, iteration);

}

[Event(2, Level = EventLevel.Informational, Keywords = Keywords.Loop,

Message = "Loop {0} done")]

public void LoopDone(string loopTitle) {

WriteEvent(2, loopTitle);

}

[Event(3, Level = EventLevel.Informational, Keywords = Keywords.Method,

Message = "Method {0} done")]

public void MethodDone([CallerMemberName] string methodName = null) {

WriteEvent(3, methodName);

}

}

class Program {

static void Main(string[] args) {

CustomEventSource log = new CustomEventSource();

for (int i = 0; i < 10; ++i) {

Thread.Sleep(50);

log.LoopIteration("MainLoop", i);

}

log.LoopDone("MainLoop");

Thread.Sleep(100);

log.MethodDone();

}

}
PerfMonitor工具可以自动从程序获得ETW的事件数据:
C:\PerfMonitor > perfmonitor monitorDump Ch02.exe

Starting kernel tracing. Output file: PerfMonitorOutput.kernel.etl

Starting user model tracing. Output file: PerfMonitorOutput.etl

Found Provider CustomEventSource Guid ff6a40d2-5116-5555-675b-4468e821162e

Enabling provider ff6a40d2-5116-5555-675b-4468e821162e level: Verbose keywords:

0xffffffffffffffff

Starting at 4/7/2012 1:44:00 PM

Current Directory C:\PerfMonitor

Executing: Ch02.exe {

} Stopping at 4/7/2012 1:44:01 PM = 0.693 sec

Stopping tracing for sessions 'NT Kernel Logger' and 'PerfMonitorSession'.

Converting C:\PerfMonitor\PerfMonitorOutput.etlx to an XML file.

Output in C:\PerfMonitor\PerfMonitorOutput.dump.xml

PerfMonitor processing time: 1.886 secs.
其实还有一个东西叫做Windows Management Instrumentation (WMI).这里没有提到,它可以获取到系统状态,BIOS固件,等数据。文档见 http://msdn.microsoft.com/en-us/library/windows/desktop/aa394582.aspx
关于托管调试和性能优化的工具
2014-11-13 22:34 by 周信达, 699 阅读, 0 评论, 收藏, 编辑
最近一个礼拜,一直在看一些调试和性能相关的东西,因为公司的产品主要瓶颈就在这些地方,于是觉得很有必要去了解一下这方面的东西。插个小话题,话说今天.NET官方公布将整个.NET框架开源,这实在是一个重磅消息,几家欢喜几家愁,各路欢笑各路口水。不管如何,自己作为一个陪伴着.NET多年的开发者,还是对它有感情的(好吧有点矫情),不过话说回来,我不知道微软原来闭源是有何种商业目的和战略计划,但是,微软的.NET在背负着不叫好的口水中,在商业上的挫败中,即便如此都是一如既往地投入大量精力在.NET的建设上,包括从半开源一直走到今天的开源,不管怎样,这个态度还是可以的,虽然它来得有点太晚了。况且,.NET程序是到了该改变思维的时候了,额话说的有点多,上正题吧
调试工具篇
- Windows调试工具集(Debugging Tools for Windows)
- 工具集中包含Windbg、NTSD、CDB
- http://msdn.microsoft.com/en-us/windows/hardware/hh852365
- 单独下载地 Debuggers (x86) Debuggers (x64)
- Debugging Tools for Windows MSDN Help
- 功能:主要针对非托管程序的调试
- http://www.cnblogs.com/awpatp/archive/2010/05/30/1747736.html
- Windows调试器扩展(Debugger Extension)
- SOS(.NET版本自带,可以集成到VS中使用)
- SOSEX for .NET
- PssCor4
- CLR Profiler(主要对内存分配情况进行监视和分析)
- PowerDbg
- MDA(Manage Debugger Assistant)
- MDbg.exe(.NET Framework 命令行调试程序)
- .NET Memory Profiler
性能工具篇
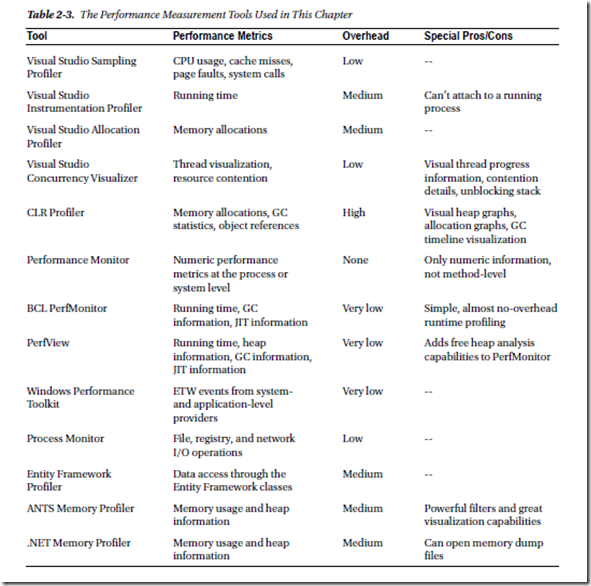
- 性能计数器(Performance Counter)
- 系统自带
- CLR Profiler(主要对内存分配情况进行监视和分析)
- Visual Studio自带的性能分析器
- JetBrains dotTrace
- ANTS Performance Profiler
- .NET Memory Profiler
- Event Trace for Windows(ETW)
- Windows Performance Toolkit(WPT)
- PerfMonitor
- PerfView
- Visual Studio Sampling Profiler
- Visual Studio Allocation Profiler
- ANTS Memory Profiler
- SciTech .NET Memory Profiler
- Concurrency Visualizer
- Concurrency Profiler
- I/O Profilers
- BCL PerfMonitor
数据库工具篇
- data access profilers
- database profilers
- SQL Server Profiler
- RedGate ANTS Performance Profiler
- Visual Studio “Tier Interactions” profiling feature
- LINQ to SQL Profiler
- Entity Framework Profiler
- NHibernate Profiler
附:
引用
《Pro .NET Performance Optimize Your C# Application》
《Advanced .NET Debugging》
《Windows高级调试》
结语
调试和性能是混为一体的,通常我们都要深入到程序的内部,尤其是当工程规模较大的时候,往往我们通过简单的Code Review或者简易的Debug难以定位问题,此时我们就要借助于一些工具了,所谓工欲善其事必先利其器。通常我们诊断时基本上关注与类型使用、异常处理、垃圾回收、线程处理、并发处理等等。其实这里面列出的大部分工具我本人都没有使用过,在实践中使用过一部分在平时学习的时候也研究过一小部分,列出来主要是作个记录,方便以后可以翻出来再使用和评测
[转].NET 性能测试工具 -- 事件跟踪器(ETW)的更多相关文章
- MySQL 事件跟踪器 , MySQL 无须重启服务 跟踪 SQL , 也无须配置日志
第一步 创建以下两个 日志表 按 Ctrl+C 复制代码 按 Ctrl+C 复制代码 CREATE TABLE `general_log` ( `event_time` timestamp NOT N ...
- MySQL 事件跟踪器
/*第一步 创建以下两个 日志表 */ CREATE TABLE `slow_log` ( `start_time` timestamp NOT NULL DEFAULT CURRENT_TIMEST ...
- IIS事件查看器_WebServer事件查看器_帮助查看IIS-Web服务器事件执行日志
IIS服务器是我们常用的Web站点部署工具,而我们有时可能遇到IIS服务器的应用程序池莫名其妙的关闭了,或者是其他未知原因等等,我们这是可以通过微软提供的WebServer(Web服务事件查看器),来 ...
- Win 7 通过事件管理器查看计算机开机关机时间
控制面板-管理工具-事件查看器 视图中开机来源:Kernel-General 事件ID:13 关机来源:Kernel-General 事件ID:12
- 转: Windows如何打开和使用事件查看器管理计算机
方法/步骤 1 右键单击"我的电脑"(win8中名称为"这台电脑.This Computer"),选择"管理",点击. 步骤阅读 2 出 ...
- Server 2008 R2 事件查看器实现日志分析
在 windows server 2008 R2 中,可以通过点击 "开始" -> "管理工具" -> "事件查看器" ,来打开 ...
- GSP事件探查器 无法进行跟踪的解决办法(场景之一)
使用GSP事件探查器 可以快速的定位问题, 跟踪效果很好 但是有时会出现 无法新建跟踪的问题. 这里有一个比较常见的解决办法 问题现象: 新建跟踪无效. 解决办法 其实就三步: 1. 打开 servi ...
- 《Entity Framework 6 Recipes》中文翻译系列 (40) ------ 第七章 使用对象服务之从跟踪器中获取实体与从命令行生成模型(想解决EF第一次查询慢的,请阅读)
翻译的初衷以及为什么选择<Entity Framework 6 Recipes>来学习,请看本系列开篇 7-5 从跟踪器中获取实体 问题 你想创建一个扩展方法,从跟踪器中获取实体,用于数 ...
- 第二章排错的工具:调试器Windbg(上)
感谢博主 http://book.51cto.com/art/200711/59731.htm <Windows用户态程序高效排错>第二章主要介绍用户态调试相关的知识和工具.本文主要讲了排 ...
随机推荐
- postman设置token关联参数,其他接口直接读取token变量
问题描述:有一个登录接口获取token,其他接口再次访问时都要带上token 解决方案: 步骤一:在登录接口访问后设置postman的环境变量,例如设置环境变量名:token,值为登录接口访问成功后, ...
- php 搜索附近人及SQL语句的写法
/** * 根据经纬度和半径查询在此范围内的所有 * @param String $lat 纬度 * @param String $lng 经度 * @param float $radius 半径 * ...
- Flask之SQLAlchemy,flask_session以及蓝图
数据库操作 ORM ORM 全拼 Object-Relation Mapping,中文意为 对象-关系映射.主要实现模型对象到关系数据库数据的映射 优点 : 只需要面向对象编程, 不需要面向数据库编写 ...
- django-celery的配置及使用
Celery简介 Celery 是一个 基于python开发的分布式异步消息任务队列,通过它可以轻松的实现任务的异步处理 celery的应用 异步调用:那些用户不关心的但是又存在在我们API里面的操作 ...
- REACT map dictionary
Object.entries(obj).map(([key, value]) => ( console.log(key); console.log(value); ))
- 索引(B-树)
前言 本文是在讲述什么样的数据结构适合作为索引,以及其适合作为索引的原因.而阅读本文需要对B树和B+树结构有稍微的理解.以及需要对磁盘操作知识有稍微的了解.对于磁盘操作的相关知识,在文章尾部的链接文章 ...
- iOS应该具备知识点
序言 我相信很多人都在说,iOS行业不好了,iOS现在行情越来越难了,失业的人比找工作的人还要多.失业即相当于转行,跳槽即相当于降低自己的身价.那么做iOS开发的你,你是否在时刻准备着跳槽或者转行了. ...
- 基于lnmp环境安装Discuz
安装环境 Linux:CentOS Linux release 7.5.1804 (Core) nginx:1.14.2 php-fpm:5.4.16 mariadb-server:5.5.60 基本 ...
- 补码的来源以及为什么byte的最小值是-128
1. 有符号数和无符号数 我们的实数分为正数和负数和0三部分 Byte数据类型一共有8位,如果是无符号数,最大可以表示的数为11111111 = 256 -1 = 255 无符号数代指不 ...
- python 如何生成好看的报告,在unittest的框架下
怎么生成报告:需要导入BeautifulReport import BeautifulReport as bf import unittest class Test_login(unittest.Te ...