
Python学习(一) —— matplotlib绘制三维轨迹图
在研究SLAM时常常需要对其输出的位姿进行复现以检测算法效果,在ubuntu系统中使用Python可以很好的完成相关的工作。
一. Ubuntu下Python的使用
在Ubuntu下使用Python有两种方法,一种是直接在控制台中运行Python文件,一种是下载IDE编辑并运行Python文件。
在控制台中使用Python方法如下:
首先确认有Python文件(filename.py),然后打开控制台进入文件当前目录,并输入以下内容就可以运行了。
python file_name.py
虽然控制台可以运行Python,不过由于不能调试等问题仍然比较推荐使用IDE。
目前使用的Python IDE为PyCharm,官方下载地址为https://www.jetbrains.com/pycharm/download/#section=linux
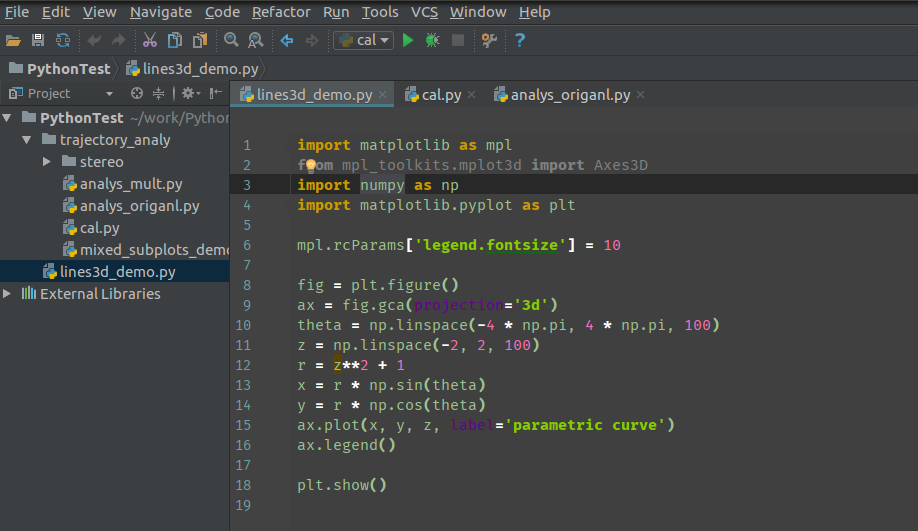
官网中提供professional和community两种版本,因为community版本免费大家可以直接下载使用。下载好后直接放到安装目录中解压,然后跟着解压后的说明文件执行安装命令即可安装成功(部分电脑由于配置原因可能会报错,网上有很多讲解配置环境安装博客,大家可以参考)。安装成功后,PyCharm界面如下图。
二. matplotlib绘制三维轨迹
Matplotlib是Python的一个绘图库,想面将讲解如何使用这个库来绘制三维线段,以此检测SLAM算法的输出结果(电脑配置Python 2.7)。
2.1. 绘制基本三维曲线
首先给出完整代码,以及输出结果。
# import necessary module

from mpl_toolkits.mplot3d import axes3d

import matplotlib.pyplot as plt

import numpy as np

# load data from file

# you can replace this using with open

data1 = np.loadtxt("./stereo/CameraTrajectoryNew2000.txt")

first_2000 = data1[:, 3]

second_2000 = data1[:, 7]

third_2000 = data1[:, 11]

# print to check data

print first_2000

print second_2000

print third_2000

# new a figure and set it into 3d

fig = plt.figure()

ax = fig.gca(projection='3d')

# set figure information

ax.set_title("3D_Curve")

ax.set_xlabel("x")

ax.set_ylabel("y")

ax.set_zlabel("z")

# draw the figure, the color is r = read

figure = ax.plot(first_2000, second_2000, third_2000, c='r')

plt.show()
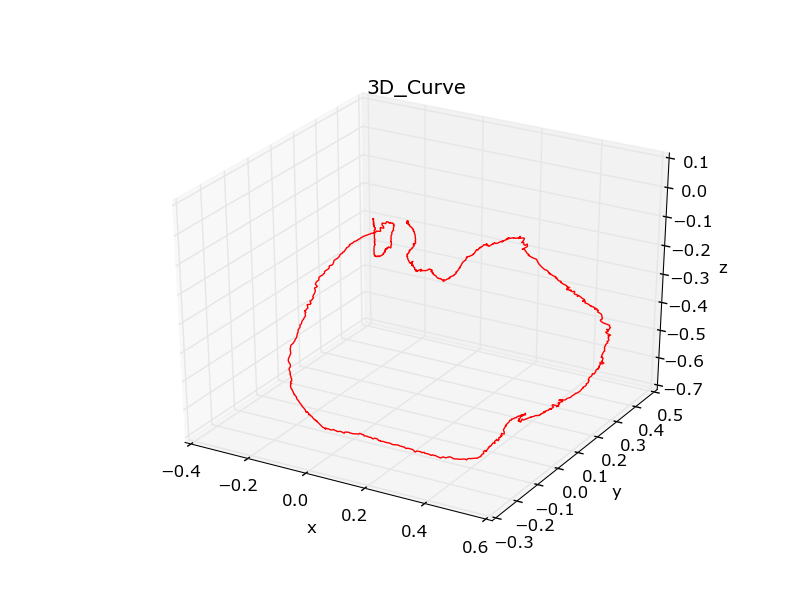
这段代码非常简单,而且相关的注释也很完善,因此只简要说明几个需要注意的地方。第一个需要注意的是读取文件中数据比较推荐用with open 然后逐行读取;第二点是在新建图像时一定别忘了添加这段代码,这是输出图像设定为3D的关键。
ax = fig.gca(projection='3d')
2.2. 同一张图中绘制多个三维曲线
代码和输出结果如下:
# import necessary module

from mpl_toolkits.mplot3d import axes3d

import matplotlib.pyplot as plt

import numpy as np

# load data from file

# you replace this using with open

data1 = np.loadtxt("./stereo/CameraTrajectoryNew2000.txt")

first_2000 = data1[:, 3]

second_2000 = data1[:, 7]

third_2000 = data1[:, 11]

data2 = np.loadtxt("./stereo/CameraTrajectoryNew1500.txt")

first_1000 = data2[:, 3]

second_1000 = data2[:, 7]

third_1000 = data2[:, 11]

# new a figure and set it into 3d

fig = plt.figure()

ax = fig.gca(projection='3d')

# set figure information

ax.set_title("3D_Curve")

ax.set_xlabel("x")

ax.set_ylabel("y")

ax.set_zlabel("z")

# draw the figure, the color is r = read

figure1 = ax.plot(first_2000, second_2000, third_2000, c='r')

figure2 = ax.plot(first_1000, second_1000, third_1000, c='b')

plt.show()
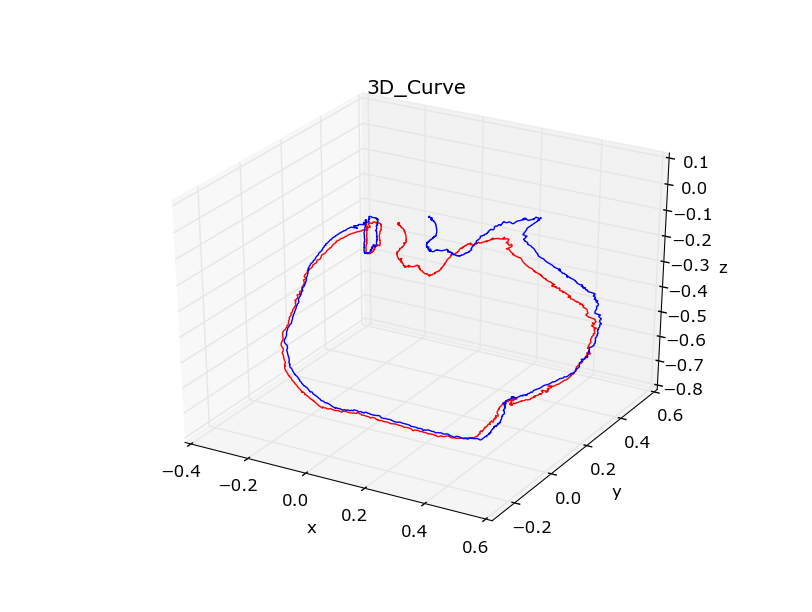
实现这个功能只需要在之前代码中加入读取新数据的相关代码,以及在画图时多生成一个图即可,也是非常的简单。
2.3. 将区域划分后绘制三维图像
代码和输出结果如下:
# import necessary module

from mpl_toolkits.mplot3d import axes3d

import matplotlib.pyplot as plt

import numpy as np

# load data from file

# you replace this using with open

data1 = np.loadtxt("./stereo/CameraTrajectoryNew2000.txt")

first_2000 = data1[:, 3]

second_2000 = data1[:, 7]

third_2000 = data1[:, 11]

data2 = np.loadtxt("./stereo/CameraTrajectoryNew1500.txt")

first_1500 = data2[:, 3]

second_1500 = data2[:, 7]

third_1500 = data2[:, 11]

# new a figure and set it into 3d

fig = plt.figure()

# ############ first subplot ############

ax = fig.add_subplot(2, 2, 1, projection='3d')

ax.set_title("3D_Curve1")

ax.set_xlabel("x")

ax.set_ylabel("y")

ax.set_zlabel("z")

# draw the figure, the color is r = read

figure1 = ax.plot(first_2000, second_2000, third_2000, c='r')

figure2 = ax.plot(first_1500, second_1500, third_1500, c='b')

# ############ second subplot ############

ax = fig.add_subplot(2, 2, 2, projection='3d')

# set figure information

ax.set_title("3D_Curve2")

ax.set_xlabel("x")

ax.set_ylabel("y")

ax.set_zlabel("z")

# draw the figure, the color is r = read

figure1 = ax.plot(first_2000, second_2000, third_2000, c='r')

figure2 = ax.plot(first_1500, second_1500, third_1500, c='b')

# ############ third subplot ############

ax = fig.add_subplot(2, 2, 3, projection='3d')

# set figure information

ax.set_title("3D_Curve3")

ax.set_xlabel("x")

ax.set_ylabel("y")

ax.set_zlabel("z")

# draw the figure, the color is r = read

figure1 = ax.plot(first_2000, second_2000, third_2000, c='r')

figure2 = ax.plot(first_1500, second_1500, third_1500, c='b')

# ############ fourth subplot ############

ax = fig.add_subplot(2, 2, 4, projection='3d')

# set figure information

ax.set_title("3D_Curve4")

ax.set_xlabel("x")

ax.set_ylabel("y")

ax.set_zlabel("z")

# draw the figure, the color is r = read

figure1 = ax.plot(first_2000, second_2000, third_2000, c='r')

figure2 = ax.plot(first_1500, second_1500, third_1500, c='b')

plt.show()
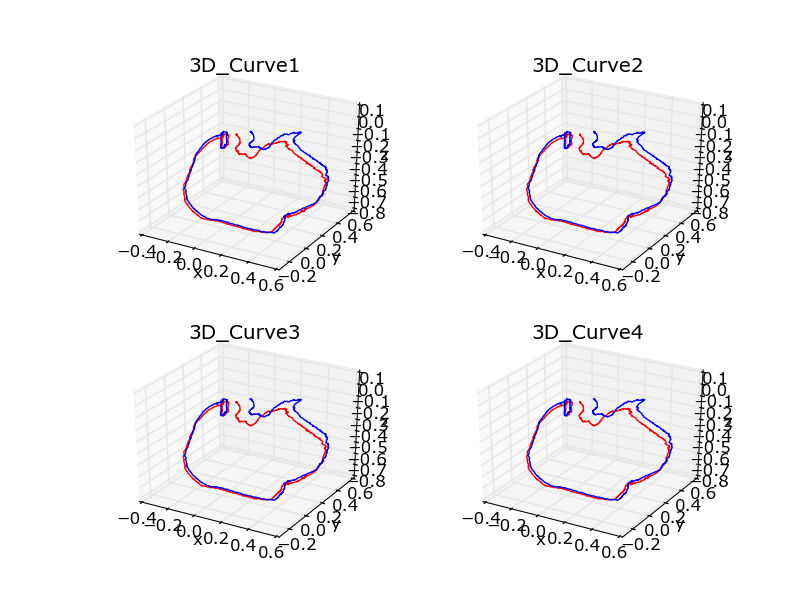
主要需要解释下面这行代码:
ax = fig.add_subplot(2, 2, 1, projection='3d')
这行代码主要是说,将当前空间拆分建立新的子图,子图个数为四,按照2x2矩阵排列方式进行,当前子图为四个子图中的第一个,且为3D模式。
以上就是就是如何使用matplotlib绘制三位曲线。总的来说比较简单,没有什么难度,Python的确是一个非常好用的编程语言。更多关于matplotlib的使用方法大家可以参考他们的官方网站,里面有相关的tutorial以及examples。
Matplotlib Introduction:http://matplotlib.org/index.html
Matplotlib Samples:http://matplotlib.org/examples/index.html
Python学习(一) —— matplotlib绘制三维轨迹图的更多相关文章
- Python学习-使用matplotlib画动态多图
最近常常使用matplotlib进行数学函数图的绘制,可是怎样使用matplotlib绘制动态图,以及绘制动态多图.直到今天才学会. 1.參考文字 首先感谢几篇文字的作者.帮我学会了怎样绘制.大家也能 ...
- python学习之matplotlib绘制动图(FuncAnimation()参数)
1.函数FuncAnimation(fig,func,frames,init_func,interval,blit)是绘制动图的主要函数,其参数如下: a.fig 绘制动图的画布名称 b.func自定 ...
- 使用python绘制根轨迹图
最近在学自动控制原理,发现根轨迹这一张全是绘图的,然而书上教的全是使用matlab进行计算机辅助绘图.但国内对于使用python进行这种绘图的资料基本没有,后来发现python-control包已经将 ...
- Python使用matplotlib绘制三维曲线
本文主要演示如何使用matplotlib绘制三维图形 代码如下: # -*- coding: UTF-8 -*- import matplotlib as mpl from mpl_toolkits. ...
- 【转】使用Python matplotlib绘制股票走势图
转载出处 一.前言 matplotlib[1]是著名的python绘图库,它提供了一整套绘图API,十分适合交互式绘图.本人在工作过程中涉及到股票数据的处理如绘制K线等,因此将matplotlib的使 ...
- Matplotlib学习---用matplotlib画箱线图(boxplot)
箱线图通过数据的四分位数来展示数据的分布情况.例如:数据的中心位置,数据间的离散程度,是否有异常值等. 把数据从小到大进行排列并等分成四份,第一分位数(Q1),第二分位数(Q2)和第三分位数(Q3)分 ...
- python学习之matplotlib实战
import numpy as np def main(): # print("hello") # line import matplotlib.pyplot as plt x = ...
- 【Python环境】matplotlib - 2D 与 3D 图的绘制
2015-10-30数据科学自媒体 类MATLAB API 最简单的入门是从类 MATLAB API 开始,它被设计成兼容 MATLAB 绘图函数. 让我们加载它: from pylab import ...
- matplotlib绘制三维图
本文参考官方文档:http://matplotlib.org/mpl_toolkits/mplot3d/tutorial.html 起步 新建一个matplotlib.figure.Figure对象, ...
随机推荐
- python如何保证输入键入数字
要求:python写一个要求用户输入数字,如果不是数字就一直循环要求输入,直到输入数字为止的代码 错误打开方式: while True: ten=input('Enter a number:') if ...
- CrawlScript脚本语言实现网络爬虫
前段时间我们学习了几种爬虫技术,我们来回顾一下,webCollector,htmlParser,Jsoup,各有优劣,但是如果能灵活运用,其实都是很不错的.那么,今天呢,我们来学习一种脚本语言,这是一 ...
- 使用arcpy.mapping模块批量出图
出图是项目里常见的任务,有的项目甚至会要上百张图片,所以批量出土工具很有必要.arcpy.mapping就是ArcGIS里的出图模块,能快速完成一个出图工具. arcpy.mapping模块里常用 ...
- win8效果的横向布局
有一个月没写过博客了,自己的博客也没有看过,前段时间一直在忙着写代码,公司有一个制漆的产品,与传统纵向布局不一样,要求页面横向布局,类似win8的那种布局效果,最开始,我也没有什么头绪,然后硬着头皮做 ...
- JS中的异步以及事件轮询机制
一.JS为何是单线程的? JavaScript语言的一大特点就是单线程,也就是说,同一个时间只能做一件事.那么,为什么JavaScript不能有多个线程呢?这样能提高效率啊.(在JAVA和c#中的异步 ...
- python 、mmap 实现内存数据共享
import mmap mmap_file = None ##从内存中读取信息, def read_mmap_info(): global mmap_file mmap_file.seek(0) ## ...
- 关于Union和Union All的区别以及用法
有些时候我们在查询的时候会碰到这么一个问题,就是一条SQL不能查出来你想要的结果;首先,我们必须明确一条查询SQL执行之后数据库会给我们返回什么,他会返回符合条件的一个结果集,而当你一条查询SQL不能 ...
- Apache优化
控制MaxClients的设置,以避免服务器产生太多的子进程而发生交换.进程间的数据交换会占用很大内存,数据交换产生的滞后使用户总感觉"不够快",所以用户就可能去按"停止 ...
- 青客宝redis内部分享ppt
Redis:最好的缓存数据库 说Redis是缓存服务,估计有些人会不开心,因为Redis也可以把数据库持久化,但是在大多数情况Redis的竞争力是提供缓存服务.说到缓存服务必然会想到Memcached ...
- POPTEST老李谈Debug和Release的区别(c#)2
二.哪些情况下 Release 版会出错 有了上面的介绍,我们再来逐个对照这些选项看看 Release 版错误是怎样产生的 1. Runtime Library: 2. 优化:这类错误主要有以下几种: ...