
LSTM时间序列预测及网络层搭建
一、LSTM预测未来一年某航空公司的客运流量
给你一个数据集,只有一列数据,这是一个关于时间序列的数据,从这个时间序列中预测未来一年某航空公司的客运流量。数据形式:

二、实战
1)数据下载
你可以google passenger.csv文件,即可找到对应的项目数据,如果没有找到,这里提供数据的下载链接:https://pan.baidu.com/s/1a7h5ZknDyT0azW9mv5st7w 提取码:u5h3
2)jupyter notebook
桌面新建airline文件夹,passenger.csv移动进去,按住shift+右键,选择在此处新建命令窗口,输入jupyter notebook,新建名为airline_predict的脚本
3)查看数据:
import pandas as pd

df = pd.read_csv('passenger.csv', header=None)

df.columns = ['time', 'passengers']

df.head(12)
结果如下:我们发现数据以年为单位,记录了每一年中每一月份的乘客量

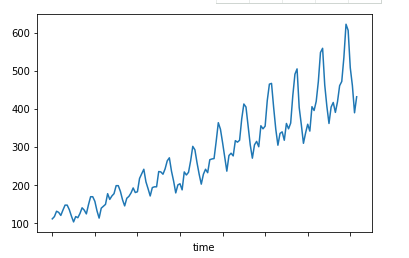
我们来做出趋势图,看看客运量是如何变化的:
df = df.set_index('time')#将第一列设置为行索引

df.head(12)

import matplotlib.pyplot as plt

df['passengers'].plot()

plt.show()
结果如下:从图上看出,客运量还是逐年增加的

4)处理数据,划分训练集和测试集
import pandas as pd

import numpy as np

from sklearn.preprocessing import MinMaxScaler

class Airline_Predict:

    def __init__(self, filename, sequence_length=10, split=0.8):

        self.filename = filename

        self.sequence_length = sequence_length

        self.split = split

    def load_data(self):

        df = pd.read_csv(self.filename, sep=',', usecols=[1], header=None)

        data_all = np.array(df).astype('float')

        print(data_all.shape)#(144, 1)

        #数据归一化

        MMS = MinMaxScaler()

        data_all = MMS.fit_transform(data_all)

        print(data_all.shape)

        #构造输入lstm的3D数据:(133, 11, 1)

        #其中特征是10个,第11个是数值标签

        data = []

        for i in range( len(data_all) - self.sequence_length - 1 ):

            data.append( data_all[ i: i+self.sequence_length+1 ] )

        #global reshaped_data

        reshaped_data = np.array(data).astype('float64')

        print(reshaped_data.shape)#(133, 11, 1)

        #打乱第一维数据

        np.random.shuffle(reshaped_data)

        #对133组数据处理,每组11个数据,前10个作为特征,第11个是数值标签:(133, 10,1)

        x = reshaped_data[:, :-1]

        print('samples shape:', x.shape, '\n')#(133, 10, 1)

        y = reshaped_data[:, -1]

        print('labels shape:', y.shape, '\n')#(133, 1)

        #构建训练集

        split_boundary = int(reshaped_data.shape[0] * self.split)

        train_x = x[:split_boundary]

        print('train_x shape:', train_x.shape)

        #构建测试集

        test_x = x[ split_boundary: ]

        print('test_x shape:', test_x.shape)

        #训练集标签

        train_y = y[ : split_boundary ]

        print('train_y shape', train_y.shape)

        #测试集标签

        test_y = y[ split_boundary: ]

        print('test_y shape', test_y.shape)

        return train_x, train_y, test_x, test_y, MMS

filename = 'passenger.csv'

AirLine = Airline_Predict(filename)

train_x, train_y, test_x, test_y, MMS = AirLine.load_data()
5)训练模型
#coding=gbk

import pandas as pd

import numpy as np

from sklearn.preprocessing import MinMaxScaler

import warnings

warnings.filterwarnings('ignore')

from keras.models import Sequential

from keras.layers import LSTM, Dense, Activation

import matplotlib.pyplot as plt

class Airline_Predict:

    def __init__(self, filename, sequence_length=10, split=0.8):

        self.filename = filename

        self.sequence_length = sequence_length

        self.split = split

    def load_data(self):

        df = pd.read_csv(self.filename, sep=',', usecols=[1], header=None)

        data_all = np.array(df).astype('float')

        print(data_all.shape)#(144, 1)

        #数据归一化

        MMS = MinMaxScaler()

        data_all = MMS.fit_transform(data_all)

        print(data_all.shape)

        #构造输入lstm的3D数据:(133, 11, 1)

        #其中特征是10个,第11个是数值标签

        data = []

        for i in range( len(data_all) - self.sequence_length - 1 ):

            data.append( data_all[ i: i+self.sequence_length+1 ] )

        #global reshaped_data

        reshaped_data = np.array(data).astype('float64')

        print(reshaped_data.shape)#(133, 11, 1)

        #打乱第一维数据

        np.random.shuffle(reshaped_data)

        #对133组数据处理,每组11个数据,前10个作为特征,第11个是数值标签:(133, 10,1)

        x = reshaped_data[:, :-1]

        print('samples shape:', x.shape, '\n')#(133, 10, 1)

        y = reshaped_data[:, -1]

        print('labels shape:', y.shape, '\n')#(133, 1)

        #构建训练集

        split_boundary = int(reshaped_data.shape[0] * self.split)

        train_x = x[:split_boundary]

        print('train_x shape:', train_x.shape)

        #构建测试集

        test_x = x[ split_boundary: ]

        print('test_x shape:', test_x.shape)

        #训练集标签

        train_y = y[ : split_boundary ]

        print('train_y shape', train_y.shape)

        #测试集标签

        test_y = y[ split_boundary: ]

        print('test_y shape', test_y.shape)

        return train_x, train_y, test_x, test_y, MMS

    def build_model(self):

        #LSTM函数的input_dim参数是输入的train_x的最后一个维度

        #train_x的维度为(n_samples, time_sequence_steps, input_dim)

        #在keras 的官方文档中,说了LSTM是整个Recurrent层实现的一个具体类,它需要的输入数据维度是:

        #形如(samples,timesteps,input_dim)的3D张量

        #而这个time_sequence_steps就是我们采用的时间窗口,即把一个时间序列当成一条长链,我们固定一个一定长度的窗口对这个长链进行采用

        #这里使用了两个LSTM进行叠加,第二个LSTM的第一个参数指的是输入的维度,这和第一个LSTM的输出维度并不一样,这也是LSTM比较随意的地方

        #最后一层采用了线性层

        model = Sequential()

        model.add( LSTM( input_dim=1, output_dim=50, return_sequences=True ) )

        print( "model layers:",model.layers )

        model.add( LSTM(100, return_sequences=False) )

        model.add( Dense( output_dim=1 ) )

        model.add( Activation('linear') )

        model.compile( loss='mse', optimizer='rmsprop' )

        return model

    def train_model(self, train_x, train_y, test_x, test_y):

        model = self.build_model()

        try:

            model.fit( train_x, train_y, batch_size=512, nb_epoch=100, validation_split=0.1 )

            predict = model.predict(test_x)

            #print(predict.size)

            predict = np.reshape( predict, (predict.size, ) )#变成向量

            test_y = np.reshape( test_y, (test_y.size, ) )

        except KeyboardInterrupt:

            print('predict:',predict)

            print('test_y',test_y)

        print('After predict:\n',predict)

        print('The right test_y:\n',test_y)

        try:

            fig1 = plt.figure(1)

            plt.plot(predict, 'r')

            plt.plot(test_y, 'g-')

            plt.title('This pic is drawed using Standard Data')

            plt.legend(['predict', 'true'])

        except Exception as e:

            print(e)

        return predict, test_y

filename = 'passenger.csv'

AirLine = Airline_Predict(filename)

train_x, train_y, test_x, test_y, MMS = AirLine.load_data()

predict_y, test_y = AirLine.train_model(train_x, train_y, test_x, test_y)

#对标注化后的数据还原

predict_y = MMS.inverse_transform( [ [i] for i in predict_y ] )

test_y = MMS.inverse_transform( [ [i] for i in test_y ] )

fig2 = plt.figure(2)

plt.plot(predict_y, 'g:', label='prediction')

plt.plot(test_y, 'r-', label='True')

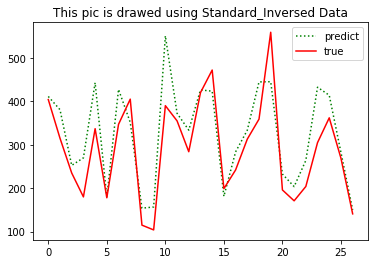
plt.title('This pic is drawed using Standard_Inversed Data')

plt.legend(['predict', 'true'])

plt.show()

print('predict:',np.reshape(predict_y, (predict_y.size,)) )

print('True:',np.reshape(test_y, (test_y.size,)))

三、代码结构

LSTM时间序列预测及网络层搭建的更多相关文章
- (数据科学学习手札40)tensorflow实现LSTM时间序列预测
一.简介 上一篇中我们较为详细地铺垫了关于RNN及其变种LSTM的一些基本知识,也提到了LSTM在时间序列预测上优越的性能,本篇就将对如何利用tensorflow,在实际时间序列预测任务中搭建模型来完 ...
- Kesci: Keras 实现 LSTM——时间序列预测
博主之前参与的一个科研项目是用 LSTM 结合 Attention 机制依据作物生长期内气象环境因素预测作物产量.本篇博客将介绍如何用 keras 深度学习的框架搭建 LSTM 模型对时间序列做预测. ...
- Pytorch循环神经网络LSTM时间序列预测风速
#时间序列预测分析就是利用过去一段时间内某事件时间的特征来预测未来一段时间内该事件的特征.这是一类相对比较复杂的预测建模问题,和回归分析模型的预测不同,时间序列模型是依赖于事件发生的先后顺序的,同样大 ...
- keras-anomaly-detection 代码分析——本质上就是SAE、LSTM时间序列预测
keras-anomaly-detection Anomaly detection implemented in Keras The source codes of the recurrent, co ...
- LSTM时间序列预测学习
一.文件准备工作 下载好的例程序 二.开始运行 1.在程序所在目录中(chapter_15)打开终端 输入下面的指令运行 python train_lstm.py 此时出现了报错提示没有安装mat ...
- Python中利用LSTM模型进行时间序列预测分析
时间序列模型 时间序列预测分析就是利用过去一段时间内某事件时间的特征来预测未来一段时间内该事件的特征.这是一类相对比较复杂的预测建模问题,和回归分析模型的预测不同,时间序列模型是依赖于事件发生的先后顺 ...
- 时间序列深度学习:状态 LSTM 模型预测太阳黑子
目录 时间序列深度学习:状态 LSTM 模型预测太阳黑子 教程概览 商业应用 长短期记忆(LSTM)模型 太阳黑子数据集 构建 LSTM 模型预测太阳黑子 1 若干相关包 2 数据 3 探索性数据分析 ...
- 使用tensorflow的lstm网络进行时间序列预测
https://blog.csdn.net/flying_sfeng/article/details/78852816 版权声明:本文为博主原创文章,未经博主允许不得转载. https://blog. ...
- 基于 Keras 用 LSTM 网络做时间序列预测
目录 基于 Keras 用 LSTM 网络做时间序列预测 问题描述 长短记忆网络 LSTM 网络回归 LSTM 网络回归结合窗口法 基于时间步的 LSTM 网络回归 在批量训练之间保持 LSTM 的记 ...
随机推荐
- CSS知识点总结[部分]
css是英文Cascading Style Sheets的缩写,称为层叠样式表,用于对页面进行美化. 存在方式有三种:元素内联.页面嵌入和外部引入,比较三种方式的优缺点. 注释为 /* 注释内容 */ ...
- springMVC (优秀篇)
本文依然是复制的 Spring3 MVC结构简单,应了那句话简单就是美,而且他强大不失灵活,性能也很优秀. 官方的下载网址是:http://www.springsource.org/download ...
- BZOJ 4326 运输计划
二分答案+树链剖分+树上差分 我们假设x是最小的花费,可以想到给定x,所有运输计划中花费大于x的计划必须经过虫洞,且最长的一条的花费减去虫洞所在边的花费要小于等于x 那么对于x,虫洞所在的位置肯定是确 ...
- Appium-desktop安装启用Inspector一直报错An unknown server-side error occurred...
遇到的问题是: 启用Appium-desktop的Inspector一直报错:An unknown server-side error occurred while processing the co ...
- 【XSY1594】棋盘控制 概率DP
题目描述 给你一个\(n\times m\)的棋盘,每次随机在棋盘上放一个国际象棋中的车,不能和以前放的重叠.每个车可以控制当前行和当前列.当所有行和所有列都被控制时结束游戏.问你结束时期望放了多少个 ...
- day5 range 用法示例
函数语法 range(start, stop[, step]) 参数说明: start: 计数从 start 开始.默认是从 0 开始.例如range(5)等价于range(0, 5); stop: ...
- Collect devices information
Collect devices information root@vpx-test# kenv > kenv.txt root@vpx-test# sysctl -a > sysctl_a ...
- mysql索引技巧
索引 索引是对数据表一列或多列的值进行排序的一种结构,用于加速基于索引字段的数据排序以及优化查询的执行速度,避免全表扫描.索引是直接影响数据库性能的数据库模式对象,因此十分重要.在定义主键和唯一键约束 ...
- Educational Codeforces Round 51 (Rated for Div. 2) G. Distinctification(线段树合并 + 并查集)
题意 给出一个长度为 \(n\) 序列 , 每个位置有 \(a_i , b_i\) 两个参数 , \(b_i\) 互不相同 ,你可以进行任意次如下的两种操作 : 若存在 \(j \not = i\) ...
- 【BZOJ1023】仙人掌图(仙人掌,动态规划)
[BZOJ1023]仙人掌图(仙人掌,动态规划) 题面 BZOJ 求仙人掌的直径(两点之间最短路径最大值) 题解 一开始看错题了,以为是求仙人掌中的最长路径... 后来发现看错题了一下就改过来了.. ...