
mysql+thinkphp +amcharts 完成图表统计功能
思路:从mysql数据库查询数据,经过thinkphp 后端控制器做逻辑处理,返回给前端,前端调用Amcharts 插件
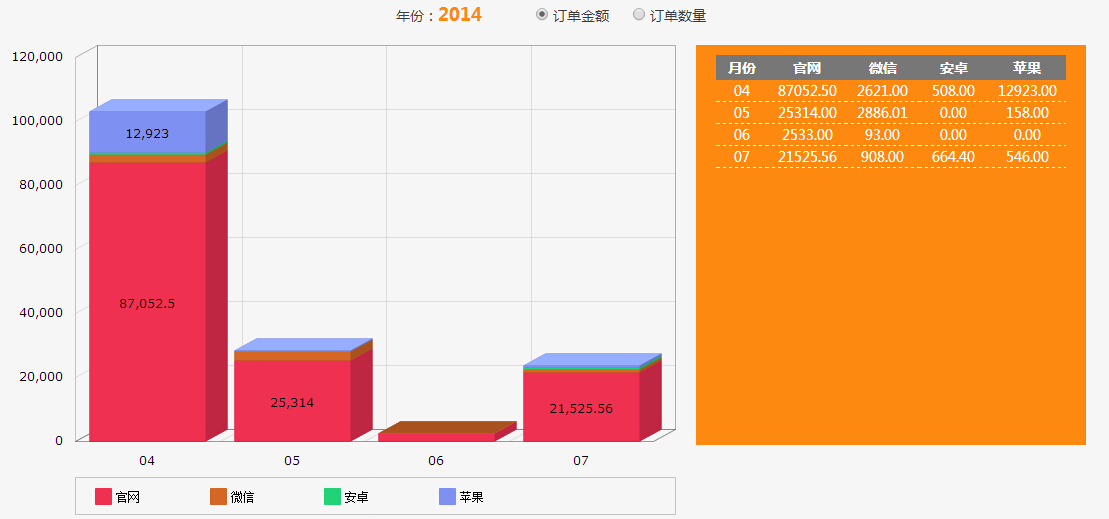
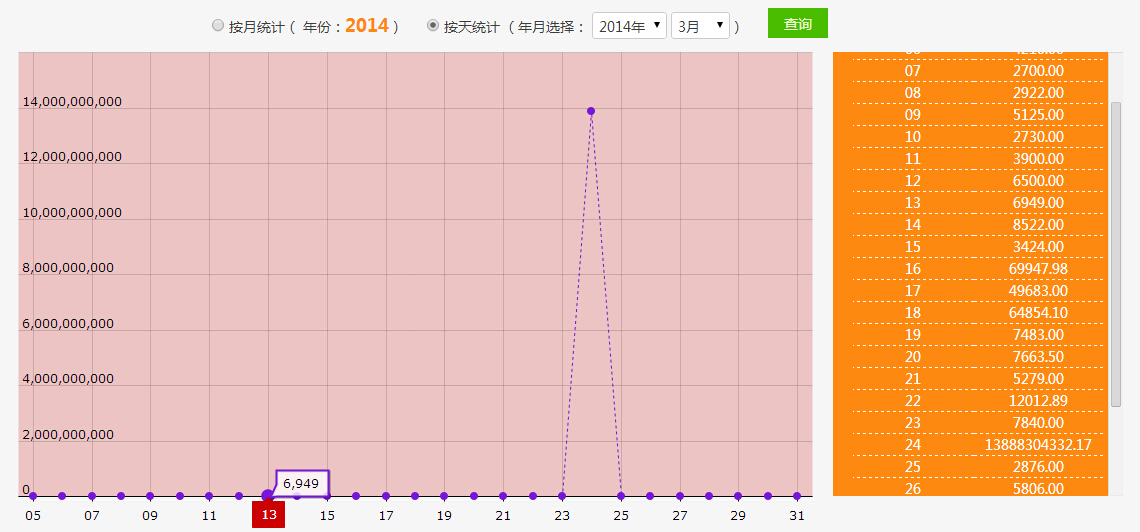
1.数据查询:
public function order($time='',$radio=1){

        if($time== ''){

            $time = Date("Y");

        }

        $bt = $time."-01-01 00:00:00";

        $et = (string)((int)$time+1)."-01-01 00:00:00";

        $sql='';

        if($radio==1){

            $sql="SELECT right(tt.month,2) as month, IFNULL( we.web, 0 ) as web, IFNULL( wx.weixin, 0 ) as weixin, IFNULL( ad.andriod, 0 ) as andriod , IFNULL( ip.iphone, 0 ) as iphone

            FROM (

            (

            SELECT DATE_FORMAT(  `AddTime` ,  '%Y-%m' ) AS

            MONTH FROM  `order`

            WHERE State = 2

            AND AddTime >= '$bt'

            AND AddTime < '$et'

            GROUP BY MONTH

            ) AS tt

            LEFT JOIN (

            SELECT DATE_FORMAT(  `AddTime` ,  '%Y-%m' ) AS

            MONTH , SUM(  `PayMoney` ) AS web

            FROM  `order`

            WHERE  `OrderSource` =1

            AND State = 2

            AND AddTime >= '$bt'

            AND AddTime < '$et'

            GROUP BY MONTH

            ) AS we ON tt.month = we.month

            LEFT JOIN (

            SELECT DATE_FORMAT(  `AddTime` ,  '%Y-%m' ) AS

            MONTH , SUM(  `PayMoney` ) AS weixin

            FROM  `order`

            WHERE  `OrderSource` =2

            AND State = 2

            AND AddTime >= '$bt'

            AND AddTime < '$et'

            GROUP BY MONTH

            ) AS wx ON tt.month = wx.month

            LEFT JOIN (

            SELECT DATE_FORMAT(  `AddTime` ,  '%Y-%m' ) AS

            MONTH , SUM(  `PayMoney` ) AS andriod

            FROM  `order`

            WHERE  `OrderSource` =3

            AND State = 2

            AND AddTime >= '$bt'

            AND AddTime < '$et'

            GROUP BY MONTH

            ) AS ad ON tt.month = ad.month

            LEFT JOIN (

            SELECT DATE_FORMAT(  `AddTime` ,  '%Y-%m' ) AS

            MONTH , SUM(  `PayMoney` ) AS iphone

            FROM  `order`

            WHERE  `OrderSource` =4

            AND State = 2

            AND AddTime >= '$bt'

            AND AddTime < '$et'

            GROUP BY MONTH

            ) AS ip ON tt.month = ip.month

            )";

        }else{

            $sql="SELECT right(tt.month,2) as month, IFNULL( we.web, 0 ) as web, IFNULL( wx.weixin, 0 ) as weixin, IFNULL( ad.andriod, 0 ) as andriod, IFNULL( ip.iphone, 0 ) as iphone

            FROM (

            (

            SELECT DATE_FORMAT(  `AddTime` ,  '%Y-%m' ) AS

            MONTH FROM  `order`

            WHERE State = 2

            AND AddTime >= '$bt'

            AND AddTime < '$et'

            GROUP BY MONTH

            ) AS tt

            LEFT JOIN (

            SELECT DATE_FORMAT(  `AddTime` ,  '%Y-%m' ) AS

            MONTH , count(  `id` ) AS web

            FROM  `order`

            WHERE  `OrderSource` =1

            AND State = 2

            AND AddTime >= '$bt'

            AND AddTime < '$et'

            GROUP BY MONTH

            ) AS we ON tt.month = we.month

            LEFT JOIN (

            SELECT DATE_FORMAT(  `AddTime` ,  '%Y-%m' ) AS

            MONTH , count(  `id` ) AS weixin

            FROM  `order`

            WHERE  `OrderSource` =2

            AND State = 2

            AND AddTime >= '$bt'

            AND AddTime < '$et'

            GROUP BY MONTH

            ) AS wx ON tt.month = wx.month

            LEFT JOIN (

            SELECT DATE_FORMAT(  `AddTime` ,  '%Y-%m' ) AS

            MONTH , count(  `id` ) AS andriod

            FROM  `order`

            WHERE  `OrderSource` =3

            AND State = 2

            AND AddTime >= '$bt'

            AND AddTime < '$et'

            GROUP BY MONTH

            ) AS ad ON tt.month = ad.month

            LEFT JOIN (

            SELECT DATE_FORMAT(  `AddTime` ,  '%Y-%m' ) AS

            MONTH , count(  `id` ) AS iphone

            FROM  `order`

            WHERE  `OrderSource` =4

            AND State = 2

            AND AddTime >= '$bt'

            AND AddTime < '$et'

            GROUP BY MONTH

            ) AS ip ON tt.month = ip.month

            )";

        }

        $m = new Model();//实例化对象模型

        //echo $sql;

        $o = $m->query($sql);

        //dump(json_encode($o));

        $this-> o = json_encode($o);

        $this-> ol = $o;

        $this-> time = $time;

        $this-> radio = $radio;

        $this-> timearr = $temp;

        $this ->display('order');

        }

    public function recharge($time='',$radio=1,$year=NULL,$month=NULL){

        $this->meta_title = '充值信息统计';

        $sql= '';

        if($radio==1){//按月统计

            if($time== ''){

            $time = Date("Y");

            }

            $bt = $time."-01-01 00:00:00";

            $et = (string)((int)$time+1)."-01-01 00:00:00";

            $sql="SELECT right(tt.month,2) as month, IFNULL( we.usum, 0 ) as usum

            FROM (

            (

            SELECT DATE_FORMAT(  `AddTime` ,  '%Y-%m' ) AS

            MONTH FROM  `recharge`

            WHERE PayType in(0,1)

            AND AddTime >= '$bt'

            AND AddTime < '$et'

            GROUP BY MONTH

            ) AS tt

            LEFT JOIN (

            SELECT DATE_FORMAT(  `AddTime` ,  '%Y-%m' ) AS

            MONTH , sum(  `Money` ) AS usum

            FROM  `recharge`

            WHERE PayType in(0,1)

            AND AddTime >= '$bt'

            AND AddTime < '$et'

            GROUP BY MONTH

            ) AS we ON tt.month = we.month

            )";

            $this-> showname = '月';

        }else{//按天统计

            if(!$year){

                $year = Date("Y");

            }

            $time = Date("Y");

            if(!$month){

                $month = Date("m");

            }

            $bt = $year.'-'.$month."-01 00:00:00";

            $et = date('Y-m-d H:i:s',strtotime('+1 month',strtotime($bt)));

             $sql="SELECT right(tt.month,2) as month, IFNULL( we.usum, 0 ) as usum

            FROM (

            (

            SELECT DATE_FORMAT(  `AddTime` ,  '%Y-%m-%d' ) AS

            MONTH FROM  `recharge`

            WHERE PayType in(0,1)

            AND AddTime >= '$bt'

            AND AddTime < '$et'

            GROUP BY MONTH

            ) AS tt

            LEFT JOIN (

            SELECT DATE_FORMAT(  `AddTime` ,  '%Y-%m-%d' ) AS

            MONTH , sum(  `Money` ) AS usum

            FROM  `recharge`

            WHERE PayType in(0,1)

            AND AddTime >= '$bt'

            AND AddTime < '$et'

            GROUP BY MONTH

            ) AS we ON tt.month = we.month

            )";

            $this-> showname = '天';

        }

        $m = new Model();//实例化对象模型

        //echo $sql;

        $o = $m->query($sql);

        //dump($o);

        $this-> o = json_encode($o);

        $this-> ol = $o;

        $this-> time = $time;

        $this-> radio = $radio;

        $this-> year = $year;

        $this-> month = $month;

        $this ->display('recharge');

    }
用到分组查询,sql 函数 有
A. right(tt.month,2) as month
B. IFNULL( we.usum, 0 ) as usum
C. count( `id` ) AS unum
D. sum( `Money` ) AS usum
E. SELECT DATE_FORMAT( `AddTime` , '%Y-%m' ) AS
MONTH FROM `table`
WHERE XXXXX
GROUP BY MONTH(分组group by 直接用select 后面的month即可)
'%Y-%m' 是时间格式,DATE_FORMAT 用于时间格式为“2012-01-01 00:01:22”的这种形式。
F. SELECT FROM_UNIXTIME( `AddTime` , '%Y-%m-%d') AS
MONTH , count( `id` ) AS unum
FROM `table`
WHERE XXXXX
GROUP BY MONTH
FROM_UNIXTIME 用于时间戳格式。
分组的思想是先查询出有哪些组,然后在查询出符合的数据,然后用left join 来组合。
2. 前端数据整合
A. 数据格式
给前端的数据格式为JSON:
var chartData = [
{
"month": "01",
"web": 2.5,
"weixin": 2.5,
"andriod": 2.1,
"iphone": 1.3
},
{
"month": "02",
"web": 2.6,
"weixin": 2.7,
"andriod": 2.2,
"iphone": 1.3
},
{
"month": "03",
"web": 2.5,
"weixin": 2.5,
"andriod": 2.1,
"iphone": 1.3
},
{
"month": "04",
"web": 2.6,
"weixin": 2.7,
"andriod": 2.2,
"iphone": 1.3
},
{
"month": "05",
"web": 2.8,
"weixin": 2.9,
"andriod": 2.4,
"iphone": 1.3
},
{
"month": "06",
"web": 2.8,
"weixin": 2.9,
"andriod": 2.4,
"iphone": 1.3
},
{
"month": "07",
"web": 2.5,
"weixin": 2.5,
"andriod": 2.1,
"iphone": 1.3
},
{
"month": "08",
"web": 2.6,
"weixin": 2.7,
"andriod": 2.2,
"iphone": 1.3
},
{
"month": "09",
"web": 2.8,
"weixin": 2.9,
"andriod": 2.4,
"iphone": 1.3
},
{
"month": "10",
"web": 2.8,
"weixin": 2.9,
"andriod": 2.4,
"iphone": 1.3
},
{
"month": "11",
"web": 2.8,
"weixin": 2.9,
"andriod": 2.4,
"iphone": 1.3
},
{
"month": "12",
"web": 2.8,
"weixin": 2.9,
"andriod": 2.4,
"iphone": 1.3
}
];
thinkphp 查询出来的数据时数组,用json_encode 转换成JSON 数组
$o = $m->query($sql);
$this-> o = json_encode($o);
$this-> ol = $o;
B. html 代码(要画图的层)
<div id="chartdiv" style="width: 700px; height: 500px;float:left"></div>
C. 画图
柱状图:
var chart;

            var chartData = <?=$o?>;

                        AmCharts.ready(function () {

                // SERIAL CHART

                chart = new AmCharts.AmSerialChart();

                chart.dataProvider = chartData;

                chart.categoryField = "month";

                chart.plotAreaBorderAlpha = 0.2;

                // AXES

                // category

                var categoryAxis = chart.categoryAxis;

                categoryAxis.gridAlpha = 0.1;

                categoryAxis.axisAlpha = 0;

                categoryAxis.gridPosition = "start";

                // value

                var valueAxis = new AmCharts.ValueAxis();

                valueAxis.stackType = "regular";

                valueAxis.gridAlpha = 0.1;

                valueAxis.axisAlpha = 0;

                chart.addValueAxis(valueAxis);

                // GRAPHS

                // first graph

                var graph = new AmCharts.AmGraph();

                graph.title = "官网";

                graph.labelText = "[[value]]";

                graph.valueField = "web";

                graph.type = "column";

                graph.lineAlpha = 0;

                graph.fillAlphas = 1;

                graph.lineColor = "#ef3051";

                graph.balloonText = "<span style='color:#555555;'>[[category]]</span><br><span style='font-size:14px'>[[title]]:<b>[[value]]</b></span>";

                chart.addGraph(graph);

                // second graph

                graph = new AmCharts.AmGraph();

                graph.title = "微信";

                graph.labelText = "[[value]]";

                graph.valueField = "weixin";

                graph.type = "column";

                graph.lineAlpha = 0;

                graph.fillAlphas = 1;

                graph.lineColor = "#d46724";

                graph.balloonText = "<span style='color:#555555;'>[[category]]</span><br><span style='font-size:14px'>[[title]]:<b>[[value]]</b></span>";

                chart.addGraph(graph);

                // third graph

                graph = new AmCharts.AmGraph();

                graph.title = "安卓";

                graph.labelText = "[[value]]";

                graph.valueField = "andriod";

                graph.type = "column";

                //graph.newStack = true; // this line starts new stack

                graph.lineAlpha = 0;

                graph.fillAlphas = 1;

                graph.lineColor = "#21d277";

                graph.balloonText = "<span style='color:#555555;'>[[category]]</span><br><span style='font-size:14px'>[[title]]:<b>[[value]]</b></span>";

                chart.addGraph(graph);

                // fourth graph

                graph = new AmCharts.AmGraph();

                graph.title = "苹果";

                graph.labelText = "[[value]]";

                graph.valueField = "iphone";

                graph.type = "column";

                graph.lineAlpha = 0;

                graph.fillAlphas = 1;

                graph.lineColor = "#7e90f2";

                graph.balloonText = "<span style='color:#555555;'>[[category]]</span><br><span style='font-size:14px'>[[title]]:<b>[[value]]</b></span>";

                chart.addGraph(graph);

                // LEGEND

                var legend = new AmCharts.AmLegend();

                legend.borderAlpha = 0.2;

                legend.horizontalGap = 10;

                chart.addLegend(legend);

                chart.depth3D = 25;

                chart.angle = 30;

                // WRITE

                chart.write("chartdiv");

            });

            // this method sets chart 2D/3D

            function setDepth() {

                if (document.getElementById("rb1").checked) {

                    chart.depth3D = 0;

                    chart.angle = 0;

                } else {

                    chart.depth3D = 25;

                    chart.angle = 30;

                }

                chart.validateNow();

            }
折线图:
    var chart;

    var chartData = <?=$o?>;

AmCharts.ready(function () {

           // SERIAL CHART

    chart = new AmCharts.AmSerialChart();

    chart.pathToImages = "__IMG__/amcharts/images/";

    chart.marginLeft = 20;

    chart.marginRight = 20;

    chart.marginTop = 20;

    chart.dataProvider = chartData;

    chart.categoryField = "month";

    // AXES

    // category

    var categoryAxis = chart.categoryAxis;

    categoryAxis.parseDates = false; // as our data is date-based, we set parseDates to true

    categoryAxis.minPeriod = "MM"; // our data is daily, so we set minPeriod to DD

    // value axis

    var valueAxis = new AmCharts.ValueAxis();

    valueAxis.inside = true;

    valueAxis.tickLength = 0;

    valueAxis.axisAlpha = 0;

    //valueAxis.minimum = 0;

    //valueAxis.maximum = 100000000;

    chart.addValueAxis(valueAxis);

    // GRAPH

    var graph = new AmCharts.AmGraph();

    graph.dashLength = 3;

    graph.lineColor = "#7717D7";

    graph.valueField = "usum";

    graph.dashLength = 3;

    graph.bullet = "round";

    chart.addGraph(graph);

    // CURSOR

    var chartCursor = new AmCharts.ChartCursor();

    chartCursor.cursorAlpha = 0;

    chart.addChartCursor(chartCursor);

    // GUIDES are used to create horizontal range fills

    var guide = new AmCharts.Guide();

    guide.value = 0;

    guide.toValue = 1000000000000;

    guide.fillColor = "#CC0000";

    guide.fillAlpha = 0.2;

    guide.lineAlpha = 0;

    valueAxis.addGuide(guide);

    // WRITE

    chart.write("chartdiv");

});

    // this method sets chart 2D/3D

    function setDepth() {

        if (document.getElementById("rb1").checked) {

            chart.depth3D = 0;

            chart.angle = 0;

        } else {

            chart.depth3D = 25;

            chart.angle = 30;

        }

        chart.validateNow();

    }
amcharts 插件要用到的文件:
amcharts.js amcharts图片文件夹(如下)

mysql+thinkphp +amcharts 完成图表统计功能的更多相关文章
- 若依项目整合eCharts实现图表统计功能
eCharts是一款强大的图表统计工具,具体介绍可查看其官网 http://echarts.baidu.com/echarts2/index.html 下面记录一下如何在若依项目中使用eCharts. ...
- Mysql的with rollup分组统计功能(5.1以上版本)
RollUp是上卷功能,类似于数据挖掘中的上卷操作. ROLLUp的功能和Order by功能是互斥的. mysql> SELECT year, SUM(profit) FROM sales G ...
- mtools 是由MongoDB 官方工程师实现的一套工具集,可以很快速的日志查询分析、统计功能,此外还支持本地集群部署管理.
mtools 是由MongoDB 官方工程师实现的一套工具集,可以很快速的日志查询分析.统计功能,此外还支持本地集群部署管理 https://www.cnblogs.com/littleatp/p/9 ...
- 通过百度echarts实现数据图表展示功能
现在我们在工作中,在开发中都会或多或少的用到图表统计数据显示给用户.通过图表可以很直观的,直接的将数据呈现出来.这里我就介绍说一下利用百度开源的echarts图表技术实现的具体功能. 1.对于不太理解 ...
- 世界上最好的语言搭建短链接及统计功能(附API代码)
前言 在这个营销的时代,短链接和二维码是企业进行营销中非常重要的工具,不仅仅是缩短了链接,而且还可以通过扩展获得更多的数据,诸如点击数.下载量.来源以及时间等等. 网上搜寻了一下比较有名有U.NU和0 ...
- Springboot项目配置druid数据库连接池,并监控统计功能
pom.xml配置依赖 <!-- https://mvnrepository.com/artifact/com.alibaba/druid --> <dependency> & ...
- MySQL 8.0有什么新功能
https://mysqlserverteam.com/whats-new-in-mysql-8-0-generally-available/ 我们自豪地宣布MySQL 8.0的一般可用性. 现在下载 ...
- go语言实战教程之 后台管理页面统计功能开发(1)
本节内容我们将学习开发实现后台管理平台页面统计功能开发的功能接口,本章节内容将涉及到多种请求路由的方式. 功能介绍 后台管理平台不仅是功能管理平台,同时还是数据管理平台.从数据管理平台角度来说,在管理 ...
- 使用SignalR ASP.NET Core来简单实现一个后台实时推送数据给Echarts展示图表的功能
什么是 SignalR ASP.NET Core ASP.NET Core SignalR 是一种开放源代码库,可简化将实时 web 功能添加到应用程序的功能. 实时 web 功能使服务器端代码可以立 ...
随机推荐
- UVaLive 4254 Processor (二分+优先队列)
题意:有n个任务,每个任务有三个参数,r,d,w,表示该任务必须在[r,d]之间执行,工作量是w,处理器执行速度可以变化,当执行速度是s的时候, 一个工作量是w的任务需要需要的执行时间是w/s个工作单 ...
- Django 之验证码实现
1. django-simple-captcha 模块 安装 django-simple-captcha pip install django-simple-captcha pip install P ...
- 自定义log4j的appender写es日志
本篇和大家分享的是自定义log4j的appender,用es来记录日志并且通过kibana浏览es记录:就目前互联网或者一些中大型公司通常会用到第三方组合elk,其主要用写数据到es中,然后通过可视化 ...
- 洛谷P1447 [NOI2010]能量采集(容斥)
传送门 很明显题目要求的东西可以写成$\sum_{i=1}^{n}\sum_{j=1}^m gcd(i,j)*2-1$(一点都不明显) 如果直接枚举肯定爆炸 那么我们设$f[i]$表示存在公因数$i$ ...
- 洛谷 P2048 [NOI2010]超级钢琴(优先队列,RMQ)
传送门 我们定义$(p,l,r)=max\{sum[t]-sum[p-1],p+l-1\leq t\leq p+r-1 \}$ 那么因为对每一个$p$来说$sum[p-1]$是一个定值,所以我们只要在 ...
- openinstall的免费服务对App推广有哪些帮助?
想在微信中下载 App,需要“点击右上角打开浏览器”,太麻烦: 想深入查看微信分享内容,需要手动打开 App 搜索,不方便: 想给 App 做推广,Android 需要多个渠道人工打包,效率低: .. ...
- linux下提示/usr/lib64/libstdc++.so.6: version `GLIBCXX_3.4.14' not found 解决办法
1.查看gcc版本中包含哪些库. strings /usr/lib64/libstdc++.so.6 | grep GLIBC GLIBCXX_3. GLIBCXX_3.4.1 GLIBCXX_3.4 ...
- Python-8-print和import进阶
1.打印多个参数 用逗号隔开: >>> print('Age:', 42) Age: 42 参数之间自动插入了一个空格字符 >>> name = 'Gumby' & ...
- MySQL的slave_exec_mode参数作用
主从复制中常会遇到的问题就是1062主键重复 如果在读写分离的架构中,slave同步失败会对业务造成很大的影响的 因此,很有必要对主从复制做些监控,做些自动化的处理.涉及到MySQL的一个参数slav ...
- [LOJ 2070] 「SDOI2016」平凡的骰子
[LOJ 2070] 「SDOI2016」平凡的骰子 [题目链接] 链接 [题解] 原题求的是球面面积 可以理解为首先求多面体重心,然后算球面多边形的面积 求重心需要将多面体进行四面体剖分,从而计算出 ...