Linux 网络流量查看 Linux ip traffic monitor
Network monitoring on Linux
This post mentions some linux command line tools that can be used to monitor the network usage. These tools monitor the traffic flowing through network interfaces and measure the speed at which data is currently being transferred. Incoming and outgoing traffic is shown separately.
Some of the commands, show the bandwidth used by individual processes. This makes it easy to detect a process that is overusing network bandwidth.
The tools have different mechanisms of generating the traffic report. Some of the tools like nload read the "/proc/net/dev" file to get traffic stats, whereas some tools use the pcap library to capture all packets and then calculate the total size to estimate the traffic load.
Here is a list of the commands, sorted by their features.
Overall bandwidth - nload, bmon, slurm, bwm-ng, cbm, speedometer, netload

Overall bandwidth (batch style output) - vnstat, ifstat, dstat, collectl

Bandwidth per socket connection - iftop, iptraf, tcptrack, pktstat, netwatch, trafshow

Bandwidth per process - nethogs
1. Nload
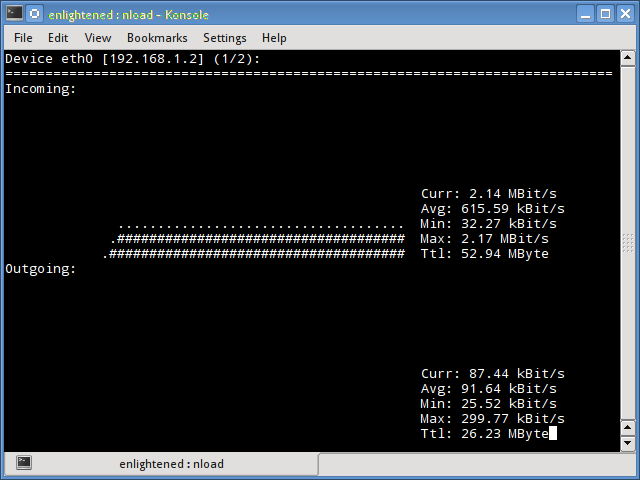
Nload is a commandline tool that allows users to monitor the incoming and outgoing traffic separately. It also draws out a graph to indicate the same, the scale of which can be adjusted. Easy and simple to use, and does not support many options.
So if you just need to take a quick look at the total bandwidth usage without details of individual processes, then nload will be handy.
$ nload
Installing Nload - Fedora and Ubuntu have got it in the default repos. CentOS users need to get nload from Epel repositories.
# fedora or centos

$ yum install nload -y

# ubuntu/debian

$ sudo apt-get install nload
2. iftop
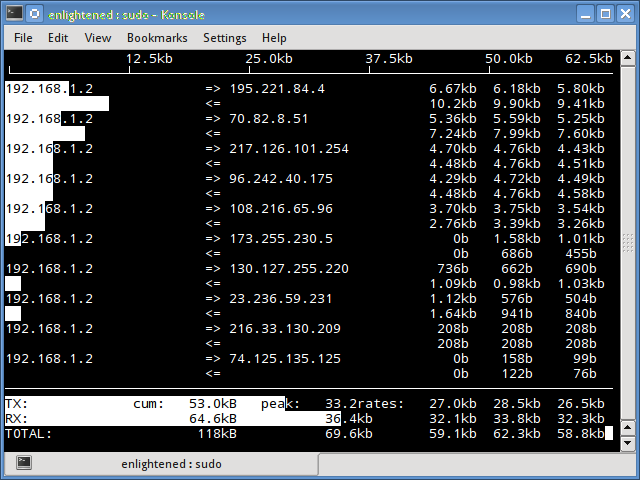
Iftop measures the data flowing through individual socket connections, and it works in a manner that is different from Nload. Iftop uses the pcap library to capture the packets moving in and out of the network adapter, and then sums up the size and count to find the total bandwidth under use.
Although iftop reports the bandwidth used by individual connections, it cannot report the process name/id involved in the particular socket connection. But being based on the pcap library, iftop is able to filter the traffic and report bandwidth usage over selected host connections as specified by the filter.
$ sudo iftop -n
The n option prevents iftop from resolving ip addresses to hostname, which causes additional network traffic of its own.
Install iftop - Ubuntu/Debian/Fedora users get it from default repos. CentOS users get it from Epel.
# fedora or centos

yum install iftop -y

# ubuntu or debian

$ sudo apt-get install iftop
3. iptraf
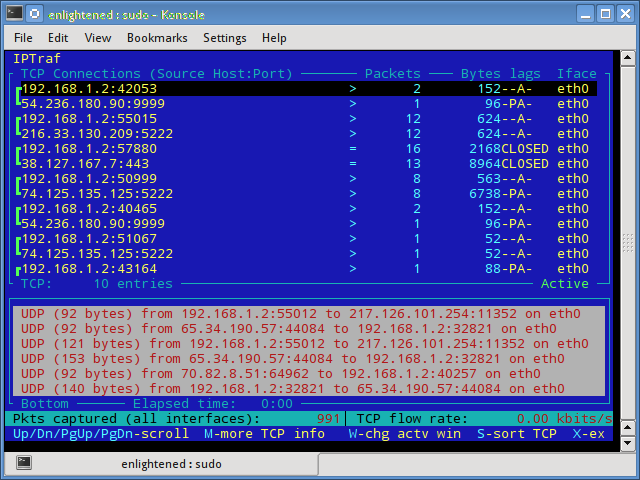
Iptraf is an interactive and colorful IP Lan monitor. It shows individual connections and the amount of data flowing between the hosts. Here is a screenshot
$ sudo iptraf
Install iptraf
# Centos (base repo)

$ yum install iptraf

# fedora or centos (with epel)

$ yum install iptraf-ng -y

# ubuntu or debian

$ sudo apt-get install iptraf iptraf-ng
4. nethogs
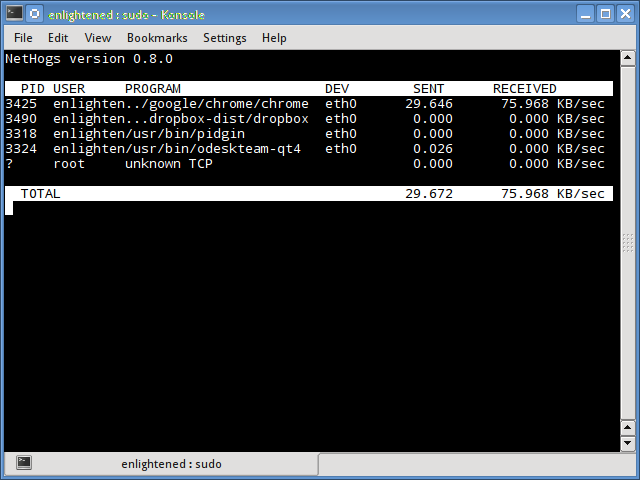
Nethogs is a small 'net top' tool that shows the bandwidth used by individual processes and sorts the list putting the most intensive processes on top. In the event of a sudden bandwidth spike, quickly open nethogs and find the process responsible. Nethogs reports the PID, user and the path of the program.
$ sudo nethogs
Install Nethogs - Ubuntu, Debian, Fedora users get from default repos. CentOS users need Epel
# ubuntu or debian (default repos)

$ sudo apt-get install nethogs

# fedora or centos (from epel)

$ sudo yum install nethogs -y
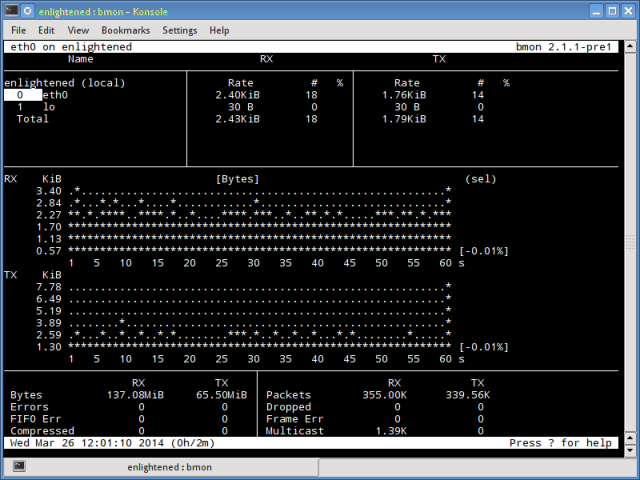
5. bmon
Bmon (Bandwidth Monitor) is a tool similar to nload that shows the traffic load over all the network interfaces on the system. The output also consists of a graph and a section with packet level details.
Install Bmon - Ubuntu, Debian and Fedora users can install from default repos. CentOS users need to setup repoforge, since its not available in Epel.
# ubuntu or debian

$ sudo apt-get install bmon

# fedora or centos (from repoforge)

$ sudo yum install bmon
Bmon supports many options and is capable of producing reports in html format. Check the man page for more information
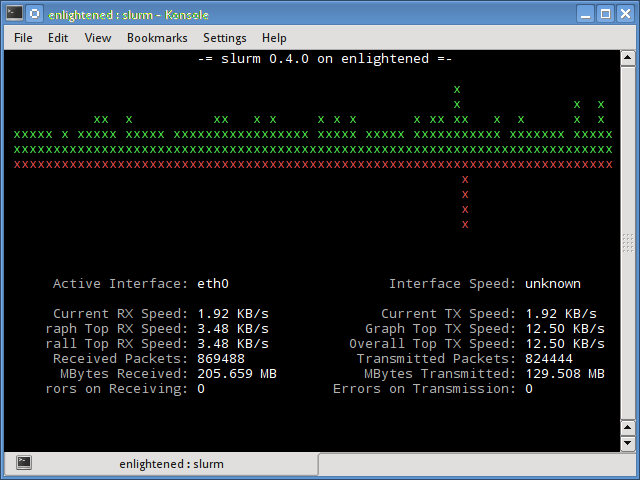
6. slurm
Slurm is 'yet' another network load monitor that shows device statistics along with an ascii graph. It supports 3 different styles of graphs each of which can be activated using the c, s and l keys. Simple in features, slurm does not display any further details about the network load.
$ slurm -s -i eth0
Install slurm
# debian or ubuntu

$ sudo apt-get install slurm

# fedora or centos

$ sudo yum install slurm -y
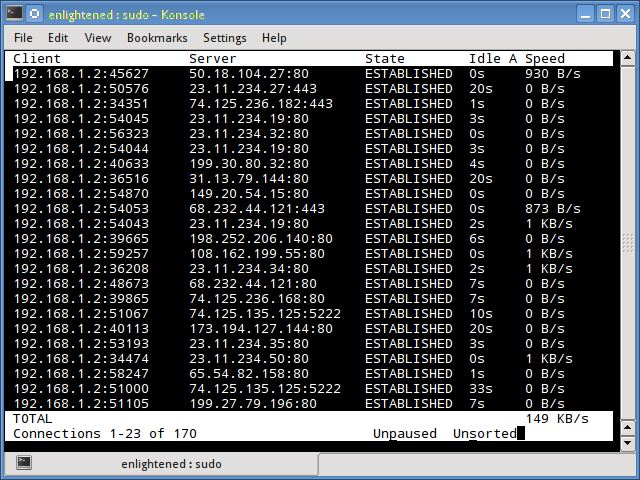
7. tcptrack
Tcptrack is similar to iftop, and uses the pcap library to capture packets and calculate various statistics like the bandwidth used in each connection. It also supports the standard pcap filters that can be used to monitor specific connections.
Install tcptrack - Ubuntu, Debian and Fedora have it in default repos. CentOS users need to get it from RepoForge as it is not available in Epel either.
# ubuntu, debian

$ sudo apt-get install tcptrack

# fedora, centos (from repoforge repository)

$ sudo yum install tcptrack
8. Vnstat
Vnstat is bit different from most of the other tools. It actually runs a background service/daemon and keeps recording the size of data transfer all the time. Next it can be used to generate a report of the history of network usage.
$ service vnstat status

 * vnStat daemon is running
Running vnstat without any options would simply show the total amount of data transfer that took place since the date the daemon is running.
$ vnstat

Database updated: Mon Mar 17 15:26:59 2014

   eth0 since 06/12/13

          rx:  135.14 GiB      tx:  35.76 GiB      total:  170.90 GiB

   monthly

                     rx      |     tx      |    total    |   avg. rate

     ------------------------+-------------+-------------+---------------

       Feb '14      8.19 GiB |    2.08 GiB |   10.27 GiB |   35.60 kbit/s

       Mar '14      4.98 GiB |    1.52 GiB |    6.50 GiB |   37.93 kbit/s

     ------------------------+-------------+-------------+---------------

     estimated      9.28 GiB |    2.83 GiB |   12.11 GiB |

   daily

                     rx      |     tx      |    total    |   avg. rate

     ------------------------+-------------+-------------+---------------

     yesterday    236.11 MiB |   98.61 MiB |  334.72 MiB |   31.74 kbit/s

         today    128.55 MiB |   41.00 MiB |  169.56 MiB |   24.97 kbit/s

     ------------------------+-------------+-------------+---------------

     estimated       199 MiB |      63 MiB |     262 MiB |
To monitor the bandwidth usage in realtime, use the '-l' option (live mode). It would then show the total bandwidth used by incoming and outgoing data, but in a very precise manner without any internal details about host connections or processes.
$ vnstat -l -i eth0

Monitoring eth0...    (press CTRL-C to stop)

   rx:       12 kbit/s    10 p/s          tx:       12 kbit/s    11 p/s
Vnstat is more like a tool to get historic reports of how much bandwidth is used everyday or over the past month. It is not strictly a tool for monitoring the network in real time.
Vnstat supports many options, details about which can be found in the man page.
Install vnstat
# ubuntu or debian

$ sudo apt-get install vnstat

# fedora or centos (from epel)

$ sudo yum install vnstat
9. bwm-ng
Bwm-ng (Bandwidth Monitor Next Generation) is another very simple real time network load monitor that reports a summary of the speed at which data is being transferred in and out of all available network interfaces on the system.
$ bwm-ng
bwm-ng v0.6 (probing every 0.500s), press 'h' for help

  input: /proc/net/dev type: rate

  /         iface                   Rx                   Tx                T

ot==========================================================================

==           eth0:           0.53 KB/s            1.31 KB/s            1.84

KB             lo:           0.00 KB/s            0.00 KB/s            0.00

KB--------------------------------------------------------------------------

--          total:           0.53 KB/s            1.31 KB/s            1.84

KB/s
If the console size is sufficiently large, bwm-ng can also draw bar graphs for the traffic using the curses2 output mode.
$ bwm-ng -o curses2
Install Bwm-NG - On CentOS bwm-ng can be installed from Epel.
# ubuntu or debian

$ sudo apt-get install bwm-ng

# fedora or centos (from epel)

$ sudo apt-get install bwm-ng
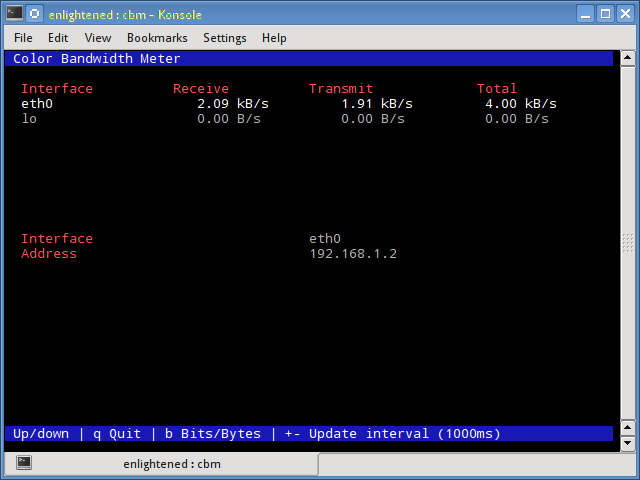
10. cbm - Color Bandwidth Meter
A tiny little simple bandwidth monitor that displays the traffic volume through network interfaces. No further options, just the traffic stats are display and updated in realtime.
$ sudo apt-get install cbm
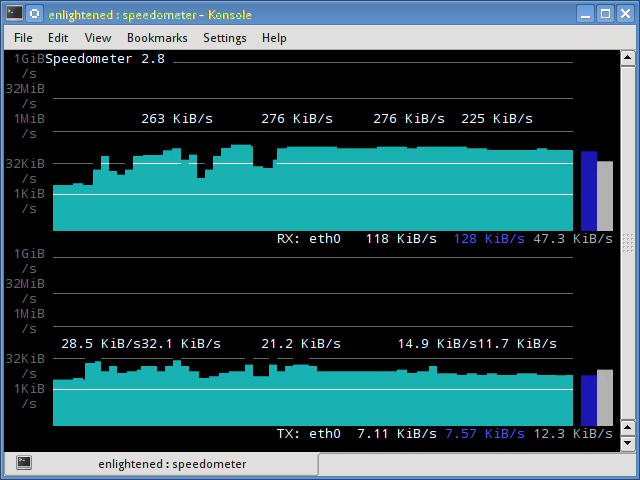
11. speedometer
Another small and simple tool that just draws out good looking graphs of incoming and outgoing traffic through a given interface.
$ speedometer -r eth0 -t eth0
Install speedometer
# ubuntu or debian users

$ sudo apt-get install speedometer
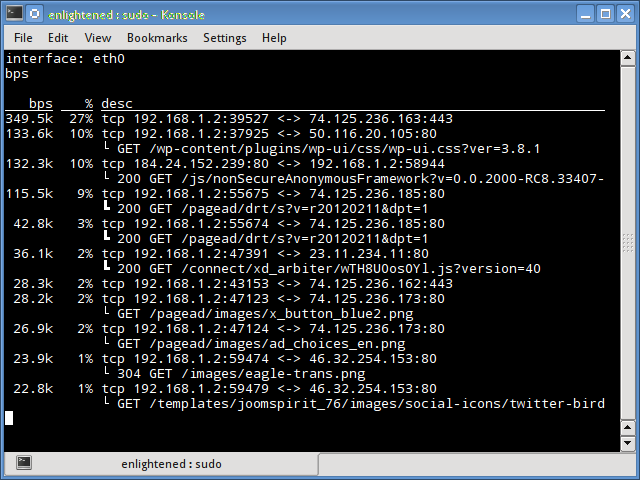
12. Pktstat
Pktstat displays all the active connections in real time, and the speed at which data is being transferred through them. It also displays the type of the connection, i.e. tcp or udp and also details about http requests if involved.
$ sudo pktstat -i eth0 -nt
$ sudo apt-get install pktstat
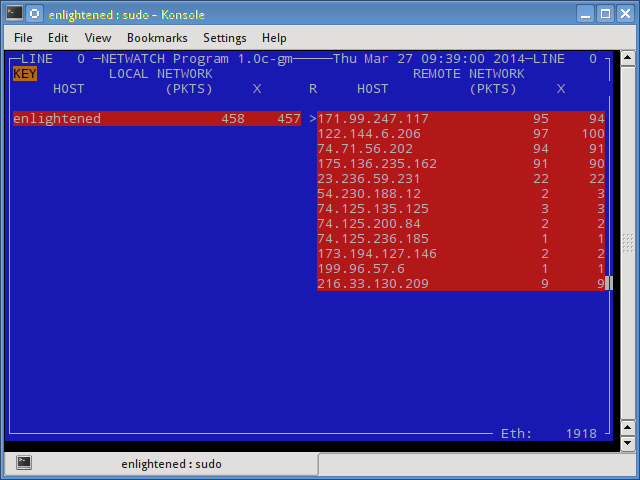
13. Netwatch
Netwatch is part of the netdiag collection of tools, and it too displays the connections between local host and other remote hosts, and the speed at which data is transferring on each connection.
$ sudo netwatch -e eth0 -nt
$ sudo apt-get install netdiag
14. Trafshow
Like netwatch and pktstat, trafshow reports the current active connections, their protocol and the data transfer speed on each connection. It can filter out connections using pcap type filters.
Monitor only tcp connections
$ sudo trafshow -i eth0 tcp

$ sudo apt-get install netdiag
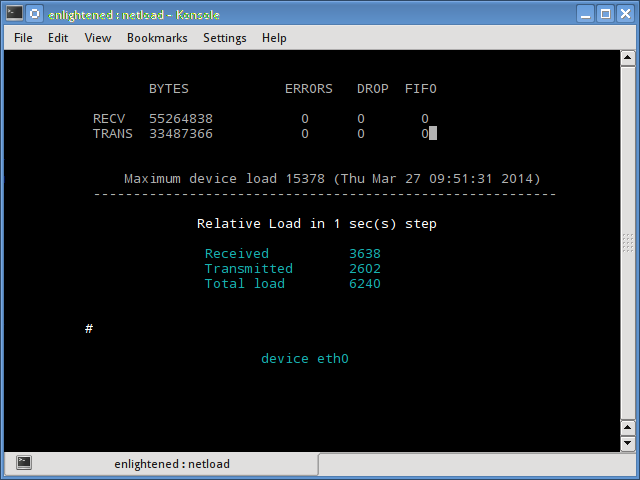
15. Netload
The netload command just displays a small report on the current traffic load, and the total number of bytes transferred since the program start. No more features are there. Its part of the netdiag.
$ netload eth0
$ sudo apt-get install netdiag
16. ifstat
The ifstat reports the network bandwidth in a batch style mode. The output is in a format that is easy to log and parse using other programs or utilities.
$ ifstat -t -i eth0 0.5

  Time           eth0

HH:MM:SS   KB/s in  KB/s out

09:59:21      2.62      2.80

09:59:22      2.10      1.78

09:59:22      2.67      1.84

09:59:23      2.06      1.98

09:59:23      1.73      1.79
Install ifstat - Ubuntu, Debian and Fedora users have it in the default repos. CentOS users need to get it from Repoforge, since its not there in Epel.
# ubuntu, debian

$ sudo apt-get install ifstat

# fedora, centos (Repoforge)

$ sudo yum install ifstat
17. dstat
Dstat is a versatile tool (written in python) that can monitor different system statistics and report them in a batch style mode or log the data to a csv or similar file. This example shows how to use dstat to report network bandwidth
$ dstat -nt

-net/total- ----system----

 recv  send|     time

   0     0 |23-03 10:27:13

1738B 1810B|23-03 10:27:14

2937B 2610B|23-03 10:27:15

2319B 2232B|23-03 10:27:16

2738B 2508B|23-03 10:27:17
Install dstat
$ sudo apt-get install dstat
18. collectl
Collectl reports system statistics in a style that is similar to dstat, and like dstat it is gathers statistics about various different system resources like cpu, memory, network etc. Over here is a simple example of how to use it to report network usage/bandwidth.
$ collectl -sn -oT -i0.5

waiting for 0.5 second sample...

#         <----------Network---------->

#Time       KBIn  PktIn  KBOut  PktOut

10:32:01      40     58     43      66

10:32:01      27     58      3      32

10:32:02       3     28      9      44

10:32:02       5     42     96      96

10:32:03       5     48      3      28
Install Collectl
# Ubuntu/Debian users

$ sudo apt-get install collectl

#Fedora

$ sudo yum install collectl
Summary
Those were a few handy commands to quickly check the network bandwidth on your linux server. However these need the user to login to the remote server over ssh. Alternatively web based monitoring tools can also be used for the same task.
Ntop and Darkstat are some of the basic web based network monitoring tools available for Linux. Beyond these lie the enterprise level monitoring tools like Nagios that provide a host of features to not just monitor a server but entire infrastructure.
Linux 网络流量查看 Linux ip traffic monitor的更多相关文章
- linux网络流量实时监控工具之iptraf
这个工具还是很强大 linux网络流量实时监控工具之iptraf [我的Linux,让Linux更易用]IPTraf是一个网络监控工具,功能比nload更强大,可以监控所有的流量,IP流量,按协议分的 ...
- linux网络流量实时监控工具之iptraf 【个人比较喜欢用的流量监控软件】
linux网络流量实时监控工具之iptraf IPTraf是一个网络监控工具,功能比nload更强大,可以监控所有的流量,IP流量,按协议分的流量,还可以设置过滤器等,如下图 对监控网络来说,这个更适 ...
- Linux 网络流量实时监控工具之ntopng详解
大纲一.前言二.ntopng 简介三.ntopng 功能说明 四.ntopng 安装详解五.ntopng 配置详解 六.ntopng 使用详解注,操作系统 CentOS 5.5 X86_64,软件版本 ...
- 网络流量查看工具为 iftop
作者: daodaoliang 时间: 2016年5月23日 版本: v0.0.1 邮箱: daodaoliang@yeah.net 日常用的网络流量查看工具为 iftop, 但是他仅仅只能简单的查看 ...
- 【转】如何查看linux版本 如何查看LINUX是多少位
原文网址:http://sopace.blog.51cto.com/1227753/670526 如何得知自己正在使用的linux是什么版本呢,下面的几种方法将给你带来答案! 1. 查看内核版本命令: ...
- Linux网络服务01——Linux网络基础设置
Linux网络服务01--Linux网络基础设置 一.查看及测试网络 1.使用ifconfig命令查看网络接口 (1)查看活动的网络接口 ifconfig命令 [root@crushlinux ~]# ...
- 尚学linux课程---4、linux网络配置及linux文件
尚学linux课程---4.linux网络配置及linux文件 一.总结 一句话总结: linux下的etc目录是配置文件的目录,所以很多的文件配置操作都可以看到它的身影:比如 init系列命名,比如 ...
- 在Linux终端中查看公有IP的方法详解
首先回顾一下一般的查看IP的命令: ifconfigLinux查看IP地址的命令--ifconfigifconfig命令用于查看和更改网络接口的地址和参数 $ifconfig -a lo0: fla ...
- Linux网络流量相关
一直以来对Linux网络这块都感觉比较乱 遇到一个UDP丢包的问题:在测试中,一台VM虚拟机,CPU利用率55%左右,内存利用率7%左右,网卡流量也远没到限制的时候出现了丢包情况 使用netstat ...
随机推荐
- Python初体验(一)—【配置环境变量】【变量】【input】【条件语句】【循环语句】
写在前面的: 作为一个控制专业的女研究生,不知道每天在研究什么,但总归逃脱不了码代码的命运.之前也学习过一些C语言.C++,基础嘛,稍稍微有一些.本不想走上码农的道路,天真烂漫的过此生(白日梦过程中. ...
- c++之sleep函数
c++之sleep函数 c++中使用sleep函数需要导入第三方库,标准库中没有该函数实现. 我们导入window.h使用Sleep()方法,注意:第一个S要大写,括号中的表示的整数倍的毫秒 Slee ...
- AngularJS入门之Services
关于AngularJS中的DI 在开始说AngularJS的Service之前,我们先来简单讲讲DI(Dependency Injection,通常中文称之为“依赖注入”). DI是一种软件设计模式, ...
- java基本语法二
1 运算符 1.1 运算符的概念 运算符是一种特殊的符号,用以表示数据的运算.赋值和比较等. 在java语言中,运算符有如下的分类: ①算术运算符. ②赋值运算符. ③比较运算符(关系运算符). ④逻 ...
- 数据库MySQL(课下作业,必做)
数据库MySQL(课下作业,必做) 题目要求: 下载附件中的world.sql.zip, 参考http://www.cnblogs.com/rocedu/p/6371315.html#SECDB,导入 ...
- 【转】Unity Animator卡顿研究
Unity Animator卡顿研究 发表于2017-07-26 点赞3 评论3 分享 分享到 2.3k浏览 想免费获取内部独家PPT资料库?观看行业大牛直播?点击加入腾讯游戏学院游戏程序行业精英群 ...
- java命令行编译和运行引用jar包的文件
经常遇到需要添加第三方jar文件的情况.在命令行状态下要加载外部的jar文件非常麻烦,很不好搞,在网上折腾了很久终于搞定了,在这里做个笔记: 2.运行:java -Djava.ext.dirs=./l ...
- python-在定义函数时,不定长参数中,默认值参数不能放在必选参数前面
如果一个函数的参数中含有默认参数,则这个默认参数后的所有参数都必须是默认参数,否则会报错:SyntaxError: non-default argument follows default argum ...
- Android 开发工具类 16_NotificationActivity
在前台运行的 Activity 可以通过Dialog.Toast 向用户发出提示信息,而后台运行的程序,如下载.收到信息等 Service 应用,则需要使用 Notification(通知)向用户发出 ...
- linux内核学习之保护模式(一)
来源:http://blog.csdn.net/yishuige/article/details/50434746 这一章涉及intel8086系列cpu的保护模式编程,应该是学习内核编程,驱动编程及 ...