
d3js 折线图+柱图
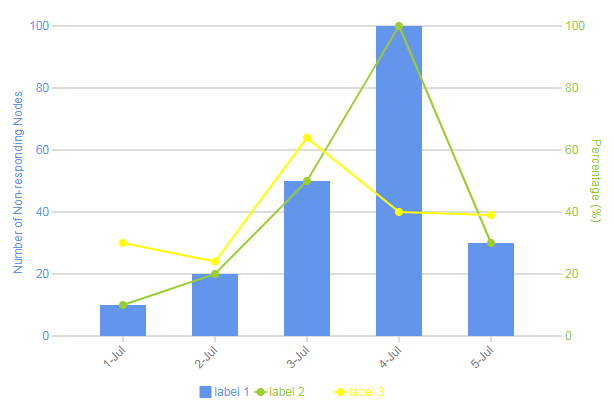
<!DOCTYPE html>

<html>

<body>

<div id="vis"><svg></svg></div>

<div id="text"></div>

<style>

  div.CCMixed-tooltip {

    border-radius: 5px;

    visibility:hidden;

    background: rgba(255,255,255,0.9);

    position: absolute;

    padding: 8px;

    box-shadow: 0px 0px 5px #888888;

    font-family: Arial, serif;

    font-size: 12px;

    color: #777;

  }

  .CCMixed-axis, .legend {

    font-family: Arial, serif;

    font-size: 12px;

    fill: #777;

  }

  .CCMixed-axis path,

  .CCMixed-axis line {

    fill: none;

    stroke: #DDD;

    stroke-width: 2;

  }

</style>

<script src="http://d3js.org/d3.v3.min.js"></script>

<script src="http://code.jquery.com/jquery-3.1.1.min.js"></script>

<script>

  var CCMixedChart = {};

  CCMixedChart.draw = function(elem, config){

    var colorFunction = config.colorFunction;

    var canvas = d3.select("#" + elem);

    canvas.select("svg").selectAll("*").remove();

    var margin = {top: 20, right: 40, bottom: 40, left: 50};

    var width = +config.width - margin.left - margin.right;

    var height = +config.height - margin.top - margin.bottom - config.addtionalXAxisSpace;

    var svg = canvas.select("svg")

      .attr("width", config.width)

      .attr("height", config.height + config.addtionalXAxisSpace)

      .append("g").attr("class", "canvas")

      .attr("transform", "translate(" +  margin.left + "," + margin.top + ")");

    // draw legends

    if(config.showLegend){

      height = height - drawLegends() * 20 - 10;

    }

    var x = d3.scale.ordinal().rangeRoundBands([0, width], 0.5).domain(config.xAxis);

    var yLeftMax = 0;

    var yRightMax = 0;

    for(var i=0; i<config.series.length; i++){

      config.series[i].visible = true;

      for(var j=0; j<config.series[i].data.length; j++){

        if(config.series[i].yAxis == "left" && yLeftMax < config.series[i].data[j]){

          yLeftMax = config.series[i].data[j];

        }

        if(config.series[i].yAxis == "right" && yRightMax < config.series[i].data[j]){

          yRightMax = config.series[i].data[j];

        }

      }

    }

    var yLeft = d3.scale.linear().range([height, 0]).domain([0, yLeftMax]);

    var yRight = d3.scale.linear().range([height, 0]).domain([0, yRightMax]);

    // draw xAxis

    drawXAxis(x);

    // draw left yAxis

    drawYAxis(yLeft, "left", config.yAxisLeft);

    drawYAxis(yRight, "right", config.yAxisRight);

    // draw charts

    for(var i=0; i<config.series.length; i++){

      var chart = config.series[i];

      if(chart.type == 'bar'){

        drawBarChart(chart);

      } else if(chart.type == 'line'){

        drawLineChart(chart)

      }

    }

    // draw tooltip

    var tooltip = canvas.append("div").attr("class", "CCMixed-tooltip");

    // draw invisible bars for hover/click events

    svg.append("g").attr("class", "bars bars-action").selectAll(".bar-hover")

      .data(config.xAxis)

      .enter().append("rect")

        .attr("class", "bar-hover")

        .attr("x", function(d) { return x(d)-x.rangeBand()/2; })

        .attr("y", 0)

        .attr("width", x.rangeBand()*2)

        .attr("height", height)

        .style("opacity", "0")

        .style("fill", "gold")

        .style("cursor", "pointer")

        .on("mouseover", function(d, i){mouseOver(this, d.replace(/ /g, '_'), i)})

        .on("mouseout", function(d, i){mouseOut(this, d.replace(/ /g, '_'), i)})

        .on("mousemove", function(){updateTooltipPos(d3.event)})

        .on("click", function(d, i){

          if(config.clickFunction){

            config.clickFunction(config, d, i);

          }

          // stop the propagation of event

          d3.event.stopPropagation();

        });

    function drawLegends(){

      var legend = svg.append("g").attr("class", "legends CCMixed-legend");

      var lx = 0;

      var ly = 0;

      var rows = 1;

      for(var i=0; i<config.series.length; i++){

        var chart = config.series[i];

        if(chart.type == 'bar'){

          drawBarLegend(chart);

        } else if(chart.type == 'line'){

          drawLineLegend(chart)

        }

      }

      var tx = 0;

      if(rows == 1){

        tx = (width - lx) / 2;

      }

      legend.attr("transform", "translate(" + tx + ", "+ (config.height+config.addtionalXAxisSpace-(rows+1)*20) + ")");

      function drawBarLegend(chart){

        var barLegend = legend.append("g")

          .attr("class", "legend legend-"+chart.label.replace(/ /g, '_'))

          .style("cursor", "pointer")

          .attr("transform", getLegendTransfrom(chart))

          .style("fill", colorFunction(chart.colorKey));

        barLegend.append("rect")

          .attr("x",  0)

          .attr("y",  0)

          .attr("width", 12)

          .attr("height", 12);

        barLegend.append("text")

          .attr("x",  10)

          .attr("y",  0)

          .attr("dy", "0.85em")

          .attr("dx", "0.4em")

          .style("text-anchor", "begin")

          .text(chart.label);

        barLegend.on("mouseover", function(){

          svg.select(".bars-"+chart.label.replace(/ /g, '_')).selectAll(".bar")

            .style("stroke","gold").style("stroke-width", 3);

        }).on("mouseout", function(){

          svg.select(".bars-"+chart.label.replace(/ /g, '_')).selectAll(".bar")

            .style("stroke-width", 0);

        }).on("click", function(){

          toggleVisibility(chart);

        });

      }

      function drawLineLegend(chart){

        var lineLegend = legend.append("g")

          .attr("class", "legend legend-"+chart.label.replace(/ /g, '_'))

          .style("cursor", "pointer")

          .style("fill", colorFunction(chart.colorKey))

          .attr("transform", getLegendTransfrom(chart));

        lineLegend.append("circle")

          .attr("r", 4)

          .attr("cx", 6)

          .attr("cy", 6)

        lineLegend.append("line")

          .attr("x1", 0)

          .attr("y1", 6)

          .attr("x2", 12)

          .attr("y2", 6)

          .style("stroke", colorFunction(chart.colorKey))

          .style("stroke-width", 2)

        lineLegend.append("text")

          .attr("x",   10)

          .attr("y",  0)

          .attr("dy", "0.85em")

          .attr("dx", "0.4em")

          .style("text-anchor", "begin")

          .text(chart.label)

        lineLegend.on("mouseover", function(d){

          svg.select(".line-"+chart.label.replace(/ /g, '_'))

            .style("stroke-width", 4);

          svg.select(".circles-"+chart.label.replace(/ /g, '_')).selectAll(".circle")

            .attr("r", 6).style("stroke","gold").style("stroke-width", 2);

        }).on("mouseout", function(d){

          svg.select(".line-"+chart.label.replace(/ /g, '_'))

            .style("stroke-width", 2);

          svg.select(".circles-"+chart.label.replace(/ /g, '_')).selectAll(".circle")

            .attr("r", 4).style("stroke-width", 0);

        }).on("click", function(){

          toggleVisibility(chart);

        });

      }

      function toggleVisibility (chart){

        if(chart.type == "bar"){

          var elem = svg.select(".bars-"+chart.label.replace(/ /g, '_'));

          toggle(elem, chart);

        } else if(chart.type == "line"){

          var elem = svg.select(".line-"+chart.label.replace(/ /g, '_'));

          toggle(elem, chart);

          elem = svg.select(".circles-"+chart.label.replace(/ /g, '_'));

          toggle(elem, chart);

        }

        var showLeft = false;

        var showRight = false;

        for(var i=0; i<config.series.length; i++){

          if(config.series[i].yAxis == "left" && config.series[i].visible){

            showLeft = true;

          }

          if(config.series[i].yAxis == "right" && config.series[i].visible){

            showRight = true;

          }

        }

        if(showLeft){

          svg.select(".axis-left").selectAll(".tick").select("text").style("visibility", "visible");

          svg.select(".axis-left").select(".title").style("visibility", "visible");

        } else {

          svg.select(".axis-left").selectAll(".tick").select("text").style("visibility", "hidden");

          svg.select(".axis-left").select(".title").style("visibility", "hidden");

        }

        if(showRight){

          svg.select(".axis-right").selectAll(".tick").select("text").style("visibility", "visible");

          svg.select(".axis-right").select(".title").style("visibility", "visible");

        } else {

          svg.select(".axis-right").selectAll(".tick").select("text").style("visibility", "hidden");

          svg.select(".axis-right").select(".title").style("visibility", "hidden");

        }

        function toggle(elem, chart){

          if(elem.style("visibility") == "visible"){

            elem.style("visibility", "hidden");

            chart.visible = false;

            var legend = svg.select(".legends").select(".legend-"+chart.label.replace(/ /g, '_')).style("fill", "#777");

            if(chart.type == "line"){

              legend.select("line").style("stroke", "#777");

            }

          } else {

            elem.style("visibility", "visible");

            chart.visible = true;

            var legend = svg.select(".legends").select(".legend-"+chart.label.replace(/ /g, '_')).style("fill", colorFunction(chart.colorKey));

            if(chart.type == "line"){

              legend.select("line").style("stroke", colorFunction(chart.colorKey));

            }

          }

        }

      };

      function getLegendTransfrom(chart){

        var translate = "translate(" +  lx + "," + ly + ")";

        lx = lx + chart.label.length * 5 + 30;

        if(chart.type == "line"){

          lx = lx + 15;

        } else if(chart.type == "bar"){

          lx = lx - 10;

        }

        if(lx + chart.label.length * 5  >= width){

          lx = 0;

          ly = ly + 20;

          rows = rows + 1;

        }

        return translate;

      }

      return rows;

    }

    function drawBarChart(chart){

      var yScale = yLeft;

      if(chart.yAxis == "right"){

        yScale = yRight;

      }

      svg.append("g")

        .attr("class", function(d, i){return "bars bars-"+chart.label.replace(/ /g, '_');})

      .selectAll(".bar")

        .data(chart.data)

        .enter().append("rect")

          .attr("class", function(d, i){return "bar bar-"+config.xAxis[i].replace(/ /g, '_');})

          .attr("x", function(d, i) { return x(config.xAxis[i]); })

          .attr("y", function(d) { return yScale(d); })

          .attr("width", x.rangeBand())

          .attr("height", function(d) { return height - yScale(d); })

          .style("fill", colorFunction(chart.colorKey));

    }

    function drawLineChart(chart){

      var yScale = yLeft;

      if(chart.yAxis == "right"){

        yScale = yRight;

      }

      var line = d3.svg.line()

        .x(function(d, i) {

          return x(config.xAxis[i]) + x.rangeBand()/2;

        })

        .y(function(d) {

          return yScale(d);

        });

      svg.append("g").append("path")

        .style("stroke", colorFunction(chart.colorKey))

        .attr("class", function(d, i){return "line-"+chart.label.replace(/ /g, '_');})

        .style("stroke-width", 2)

        .style("fill", "none")

        .attr("d", line(chart.data));

      svg.append("g")

        .attr("class", function(d, i){return "circles circles-"+chart.label.replace(/ /g, '_');})

      .selectAll(".circle")

        .data(chart.data)

        .enter().append("circle")

        .attr("class", function(d, i){return "circle circle-"+config.xAxis[i].replace(/ /g, '_');})

        .attr("r", 4)

        .style("fill", colorFunction(chart.colorKey))

        .attr("cx", function(d, i){return x(config.xAxis[i]) + x.rangeBand()/2;})

        .attr("cy", function(d){return yScale(d);});

    }

    function mouseOver(elem, d, i){

      d3.select(elem).style("opacity", "0.3");

      svg.select(".axis-x").select(".axis-"+d).style("font-weight","bold").style("font-size","14px");

      svg.selectAll(".circles").select(".circle-"+d).attr("r", 7).style("stroke","gold").style("stroke-width",2);

      svg.selectAll(".bars").select(".bar-"+d).style("stroke","gold").style("stroke-width", 2);

      var html;

      if(config.tooltipFunction){

        html = config.tooltipFunction(config, d, i);

      } else {

        html = getTooltips(d, i);

      }

      tooltip.html(html).style("visibility", "visible");

      function getTooltips(d, i){

        var html = d + "<br/>";

        for(var j=0; j<config.series.length; j++){

          html = html + "<b>" + config.series[j].label + "</b>: " + config.series[j].data[i] + "<br/>";

        }

        return html;

      }

    };

    function mouseOut(elem, d, i){

      d3.select(elem).style("opacity", "0");

      svg.select(".axis-x").select(".axis-"+d).style("font-weight","normal").style("font-size","12px");

      svg.selectAll(".circles").select(".circle-"+d).attr("r", 4).style("stroke-width",0);

      svg.selectAll(".bars").select(".bar-"+d).style("stroke-width",0);

      tooltip.style("visibility", "hidden");

    }

    function updateTooltipPos (e){

      tooltip.style("top", (e.pageY + 15) + "px")

        .style("left", (e.pageX + 15) + "px");

    };

    function drawXAxis(x){

      // draw x

      svg.append("g")

        .attr("class", "CCMixed-axis axis-x")

        .attr("transform", "translate(0," + height + ")")

        .call(customXAxis)

      .selectAll("text")

        .data(config.xAxis)

        .attr("class", function(d, i){return "axis-"+config.xAxis[i].replace(/ /g, '_');})

        .style("text-anchor", "end")

        .attr("dy", "0.3em")

        .attr("dx", "-0.7em")

        .attr("transform", "rotate(-45)")

        .text(function(d, i){

          // skip one if too many ticks

          //alert(config.xAxis.length);

          if(config.xAxis.length >= 10 && i % 2 == 1){

            return "";

          } else {

            return d

          }

        });

      function customXAxis(g) {

        var xAxis = d3.svg.axis()

          .scale(x)

          .orient("bottom");

        g.call(xAxis);

        g.select(".domain").remove();

      }

    }

    function drawYAxis(y, orient, setting){

      var axisY = svg.append("g")

        .attr("class", "CCMixed-axis axis-"+orient)

        .style("fill", colorFunction(setting.colorKey))

        .call(customYAxis)

      if(orient == 'right'){

        axisY.attr("transform", "translate(" + width + ", 0)")

      }

      if(setting.title){

        var axisYLabel = axisY.append("text")

          .text(setting.title)

          .attr("class", "title")

        if(orient == "left"){

          axisYLabel.attr("transform", "rotate(-90)")

            .attr("y", -30)

            .attr("x", -1*height/2)

            .attr("dx", setting.title.length * 0.25 + "em")

            .style("text-anchor", "end")

        } else {

          axisYLabel.attr("transform", "rotate(90)")

          .attr("y", -30)

          .attr("x", height/2)

          .attr("dx", -1 * setting.title.length * 0.25 + "em")

          .style("text-anchor", "begin")

        }

      }

      function customYAxis(g) {

        var yAxis = d3.svg.axis()

          .scale(y)

          .orient(orient)

          .tickSize(orient=="left"? -1*width : 0)

          .ticks(config.yAxisTicks);

        g.call(yAxis);

        g.select(".domain").remove();

        g.selectAll(".tick:not(:first-of-type) line").attr("stroke", "#030303");

      }

    }

  };

  var colorFunction1 = function(key){

    return key;

  }

  var clickFunction1 = function(config, d, i){

    var html = d + "<br/>";

    for(var j=0; j<config.series.length; j++){

      html = html + "<b>" + config.series[j].label + "</b>: " + config.series[j].data[i] + "<br/>";

    }

    $("#text").html(html);

  }

  $(document).ready(function(){

    var vis = $("#vis");

    var config = {

      "addtionalXAxisSpace": 0,  // OPTIONAL. if the labels for xAxis is too long can add more space between xAxis and legend

      "width": 600, // width of canvas

      "height": 400, // height of canvas

      "showLegend": true, // OPTIONAL.

      "colorFunction": colorFunction1,  // color function, accept a key and return a color, can use d3.scale.category20()

      "clickFunction": clickFunction1,  // OPTIONAL. handles click event when clicking a day

      //"tooltipFunction": tooltipFunction  // OPTIONAL. if not provided default function will be used

      "xAxis": ["1-Jul", "2-Jul", "3-Jul", "4-Jul", "5-Jul"],

      "xAxisData": [1, 2, 3, 4, 5],  // OPTIONAL. can store additional data to be used by the click event. e.g. xAxis is the date string but xAxisData is the timestamp

      "yAxisTicks": 5, // number of horizontal lines

      "yAxisLeft": {  // config the left y axis, MUST if any series need to use this axis

        "title": "Number of Non-responding Nodes",

        "colorKey": "cornflowerblue"

      },

      "yAxisRight": { // config the right y axis, MUST if any series need to use this axis

        "title": "Percentage (%)",

        "colorKey": "yellowgreen"

      },

      "series":[  // array of chart config. one element correspond to one chart. bar charts are NOT stacked and will OVERLAP

        {

          "colorKey": " cornflowerblue",

          "type": "bar",  // chart type - bar or line

          "data": [10, 20, 50, 100, 30],

          "yAxis": "left",   // associate the chart to left or right axis

          "label": "label 1"  // used in legends and tooltips

        },

        {

          "colorKey": "yellowgreen",

          "type": "line",

          "data": [10, 20, 50, 100, 30],

          "yAxis": "right",

          "label": "label 2"

        },

        {

          "colorKey": "yellow",

          "type": "line",

          "data": [30, 24, 64, 40, 39],

          "yAxis": "right",

          "label": "label 3"

        }

      ]

    };

    CCMixedChart.draw("vis", config);

  });

</script>

</body>

</html>
d3js 折线图+柱图的更多相关文章
- Echarts-柱状图柱图宽度设置
先看两张图 图中柱图只需要设置series中的坐标系属性barWidth就可以, 这种图柱状图,折叠柱状图都适应 eg: /** * 堆积柱状图 * @param xaxisdata x轴:标签(数组 ...
- echarts 中 柱图 、折线图、柱图层叠
app.title = '折柱混合'; option = { tooltip: { trigger: 'axis', axisPointer: { type: 'cross', crossStyle: ...
- Asp.net 用 Graphics 统计图(柱状图, 折线图, 扇形图)
统计图形种类繁多, 有柱状图, 折线图, 扇形图等等, 而统计图形的绘制方法也有很多, 有Flash制作的统计图形, 有水晶报表生成统计图形, 有专门制图软件制作, 也有编程语言自己制作的:这里我们用 ...
- 06. Matplotlib 2 |折线图| 柱状图| 堆叠图| 面积图| 填图| 饼图| 直方图| 散点图| 极坐标| 图箱型图
1.基本图表绘制 plt.plot() 图表类别:线形图.柱状图.密度图,以横纵坐标两个维度为主同时可延展出多种其他图表样式 plt.plot(kind='line', ax=None, figsiz ...
- C# 绘制统计图(柱状图, 折线图, 扇形图)【转载】
统计图形种类繁多, 有柱状图, 折线图, 扇形图等等, 而统计图形的绘制方法也有很多, 有Flash制作的统计图形, 有水晶报表生成统计图形, 有专门制图软件制作, 也有编程语言自己制作的:这里我们用 ...
- C# 绘制统计图(柱状图, 折线图, 扇形图)
统计图形种类繁多, 有柱状图, 折线图, 扇形图等等, 而统计图形的绘制方法也有很多, 有Flash制作的统计图形, 有水晶报表生成统计图形, 有专门制图软件制作, 也有编程语言自己制作的:这里我们用 ...
- dev控件chart简单实现多图例,双曲线,双柱图,曲线与柱图
1.效果图 2.数据源代码: ; i < ; i++) { == ) { dt1.Rows.Add( * i); dt2.Rows.Add( * i+); } else { dt1.Rows.A ...
- echarts柱图自定义为硬币堆叠的形式
看这标题,可能会有一些人不太明白,那么直接上图,就是柱图展示形式如下图(兼容IE8) 要想实现这样展示效果.我们想用echarts直接实现不行的,即使是纹理填充也不可行的,但是我们可以借助echart ...
- Android图表库MPAndroidChart(八)——饼状图的扩展:折线饼状图
Android图表库MPAndroidChart(八)--饼状图的扩展:折线饼状图 我们接着上文,饼状图的扩展,增加折现的说明,来看下我们要实现的效果 因为之前对MPAndroidChart的熟悉,所 ...
随机推荐
- Qt 【widget如何铺满窗口】
刚接触qt不是很长时间,都是使用ui拖拽控件实现界面,然后发现有些问题就是控件一旦多了起来,拖拽就不好控制了,然后就转而使用纯代码开发. 一下是碰到第一个问题: 创建一个MainWidget; Mai ...
- npm启动报错
npm 启动报错 event.js 160 报错原因: 端口号被占用 解决方法: 1.重新定义一个端口号. 2.任务管理器关掉node进程,重新运行npm.
- java基础学习笔记五(抽象类)
java基础学习总结——抽象类 抽象类介绍
- 【Flutter学习】之Widget数据共享之InheritedWidget
一,概述 业务开发中经常会碰到这样的情况,多个Widget需要同步同一份全局数据,比如点赞数.评论数.夜间模式等等.在安卓中,一般的实现方式是观察者模式,需要开发者自行实现并维护观察者的列表.在flu ...
- 【软工项目Beta阶段】第11周Scrum会议博客
第十一周会议记录 小组GitHub项目地址https://github.com/ouc-softwareclass/OUC-Market 小组Issue地址https://github.com/ouc ...
- AcWing 224. 计算器 (BSGS算法)打卡
题目:https://www.acwing.com/problem/content/226/ 题意:有一个计算器能完成三种功能 1.给定Y,Z,P,计算YZModPYZModP 的值: 2.给定Y,Z ...
- symantec SMG 抓包
1.使用putty连接SMG,先用admin账号登陆 执行set-support , 设置一个密码. 2.重新打开一个putty连接SMG,使用support账号登陆.用我们刚才设置的密码. 3.开 ...
- 5、java操作xml,dom4j
. 1.首先在项目路径下引入dom4j-1.6.1.jar和jaxen-1.1-beta-6.jar包,jaxp方式解析xml文件 <?xml version="1.0" e ...
- RFC6241 NETCONF
概述 NETCONF = The Network Configuration Protocol SDN = Software Define Network NETCONF协议分为传输层.消息层.操作层 ...
- s-cms学校建站重装漏洞
文件位置 ./install/index.php 影响版本 PHP V5.0 过程 通过获取GET请求判断是安装还是结束安装 安装步骤1 安装步骤2 安装步骤3 安装步骤4 解释 安装步骤1-3都没有 ...