WaitType:SOS_SCHEDULER_YIELD
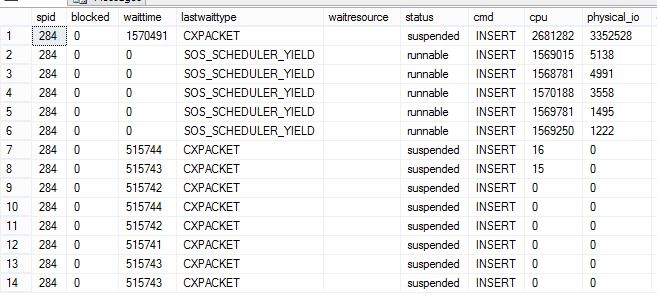
今天遇到一个query,处于SOS_SCHEDULER_YIELD 状态,physical IO 不增加,CPU的使用一直在增长。当一个sql query长时间处于SOS_SCHEDULER_YIELD wait,一般情况下,说明这个sql query正在持续地,频繁地使用CPU。
SOS_SCHEDULER_YIELD Explanation:
SQL Server has multiple threads, and the basic working methodology for SQL Server is that SQL Server does not let any “runnable” thread to starve. Now let us assume SQL Server OS is very busy running threads on all the scheduler. There are always new threads coming up which are ready to run (in other words, runnable). Thread management of the SQL Server is decided by SQL Server and not the operating system. SQL Server runs on non-preemptive mode most of the time, meaning the threads are co-operative and can let other threads to run from time to time by yielding itself. When any thread yields itself for another thread, it creates this wait. If there are more threads, it clearly indicates that the CPU is under pressure.
推荐阅读《Should you worry about SOS_SCHEDULER_YIELD?》
处于 SOS_SCHEDULER_YIELD wait的Root Cause 是查询语句正在进行 large and/or repeated index/table scans。
出现 scan 操作的原因可能是:Maybe someone dropped a critical nonclustered index, or statistics are out-of-date and so an incorrect query plan was chosen, or maybe an unusual parameter value was passed to a stored procedure and the query plan called for a scan, or a code change occurred without supporting index additions.
引用:Knee-Jerk Wait Statistics : SOS_SCHEDULER_YIELD
When SOS_SCHEDULER_YIELD is the most prevalent on a server, it’s common to see sustained, high CPU usage. The knee-jerk reaction here is that the server must be under CPU pressure, or that a spinlock is the problem.
We need a bit of background here to understand these two reactions.
Thread Scheduling
Thread scheduling in SQL Server is managed by SQL Server itself, not by Windows (i.e. it’s non-preemptive). The SQL OS portion of the Storage Engine provides scheduling functionality and threads transition from running on a Processor (where the thread state is RUNNING) to being on the Waiter List waiting for a resource to become available (state is SUSPENDED) to being on the Runnable Queue once the resource becomes available (state is RUNNABLE) waiting to get to the top of the queue and back onto the Processor again (back to state being RUNNING). I’ve capitalized Processor, Waiter List, and Runnable Queue to identify them as parts of a scheduler.
Whenever a thread needs a resource that it can’t immediately acquire, it becomes suspended and waits on the Waiter List to be told (signaled) that its resource is available. The time spent on the Waiter List is the resource wait time and the time spent on the Runnable Queue is the signal wait time. Together they combine to be the overall wait time. SQL OS keeps track of the wait time and the signal wait time so we have to do some math on the output from sys.dm_os_wait_stats to derive the resource wait time (see my script here).
The Waiter List is unordered (any thread on it can be signaled at any time and move to the Runnable Queue) and the Runnable Queue is First-In-First-Out (FIFO) almost 100% of the time. The only exception to the Runnable Queue being FIFO is where multiple Resource Governor workload groups have been configured in the same resource pool and they have different priorities relative to each other. I’ve never seen this used successfully in production so I won’t discuss it further.
There is another reason why a thread may need to move off the Processor – it exhausts its quantum. The thread quantum in SQL OS is fixed at 4 milliseconds. The thread itself is responsible for determining that its quantum has been exhausted (by calling helper routines in SQL OS) and voluntarily giving up the processor (known as yielding). When this occurs, the thread moves directly to the bottom of the Runnable Queue, as there is nothing for it to wait for. SQL OS must register a wait type for this transition off the Processor though, and registers SOS_SCHEDULER_YIELD.
This behavior is often mistaken for CPU pressure, but it’s not – it’s just sustained CPU usage. CPU pressure, and recognizing it, is a whole other topic for a future post. As far as this post is concerned, as long as the average signal wait time is low (0-0.1-0.2ms), it’s a pretty safe bet that CPU pressure isn’t an issue.
Spinlocks
A spinlock is a very low-level synchronization primitive that is used to provide thread-safe access to data structures in SQL Server that are extremely hot (very volatile and accessed and changed incredibly frequently by multiple threads). Examples of such structures are the buffer free list in each portion of the buffer pool and the proportional-fill weightings array for the data files in a filegroup.
When a thread needs to acquire a spinlock, it looks to see if the spinlock is free and if so immediately acquires it (using an interlocked assembly-language primitive like ‘test bit clear and set’). If the spinlock can’t be acquired, the thread immediately tries to acquire it again, and again, and again, for up to a thousand iterations, until it backs off (sleeps for a bit). This doesn't register as any wait type, as the thread simply calls the Windows sleep() function, but can make other threads that are waiting have large (10-20ms+) signal wait times as the sleeping thread stays on the processor until it gets the spinlock.
Why am I talking about spinlocks? Because they can also be a cause of high CPU usage, and there's a misconception that spinlocks are a cause of SOS_SCHEDULER_YIELD waits. They're not.
SOS_SCHEDULER_YIELD Causes
So there is one cause for SOS_SCHEDULER_YIELD: a thread exhausting its scheduling quantum and heavily recurring instances can lead to SOS_SCHEDULER_YIELD being the most prevalent wait along with high CPU usage.
You won't see SOS_SCHEDULER_YIELD waits show up in the output from sys.dm_os_waiting_tasks, as the thread isn't waiting. You can see which query is generating the SOS_SCHEDULER_YIELD waits by querying sys.dm_exec_requests and filtering on the last_wait_type column.
The only way to prove what's causing SOS_SCHEDULER_YIELD waits is to capture SQL Server call stacks when that wait type occurs, using Extended Events and debug symbols from Microsoft. I have a blog post that describes and shows how to perform that investigation, and there’s a great whitepaper about spinlocks and spinlock investigations that is worth reading if you’re interested in that depth of internals.
For the case of quantum exhaustion, that’s not the root cause. It’s a further symptom. Now we need to consider why a thread may be exhausting its quantum repeatedly.
A thread can only exhaust its quantum when it can continue processing SQL Server code for 4ms without needing a resource that another thread owns – no waiting for locks, page latches, data file pages to be read from disk, memory allocations, file growths, logging, or the myriad other resources that a thread might need.
The most common piece of code where quantum exhaustion can occur and rack up large amounts of SOS_SCHEDULER_YIELD waits is scanning an index/table where all the necessary data files pages are in memory and there is no contention for access to those pages, and so that’s what I encourage you to look for in query plans when you see SOS_SCHEDULER_YIELD as the top wait type – large and/or repeated index/table scans.
This doesn’t mean I’m saying that large scans are bad, as it could be that the most efficient way to process your workload is through a scan. However, if the SOS_SCHEDULER_YIELD waits are new and unusual, and are caused by large scans, you should investigate why the query plans are using scans. Maybe someone dropped a critical nonclustered index, or statistics are out-of-date and so an incorrect query plan was chosen, or maybe an unusual parameter value was passed to a stored procedure and the query plan called for a scan, or a code change occurred without supporting index additions.
参考文档:
New whitepapers on latches and spinlocks published
WaitType:SOS_SCHEDULER_YIELD的更多相关文章
- 译:SOS_SCHEDULER_YIELD类型等待在虚拟机环境中的增多
原文出处:Increased SOS_SCHEDULER_YIELD waits on virtual machines 注: 原文的用词是Increased,想译作增强(增长),或者加强,这么译起来 ...
- WaitType:ASYNC_IO_COMPLETION
项目组有一个数据库备份的Job运行异常,该Job将备份数据存储到remote server上,平时5个小时就能完成的备份操作,现在运行19个小时还没有完成,backup命令的Wait type是 AS ...
- WaitType:ASYNC_NETWORK_IO
官方文档的定义,是指SQL Server 产生的结果集需要经过Network传递到Client,Network不能很快将结果集传输到Client,导致结果集仍然驻留在SQL Server的Sessio ...
- WaitType:CXPACKET
CXPACKET 等待类型是SQL Server 并发执行一个query时产生的.在run一个big query时,SQL Server充分利用系统的所有资源(CPU,Memory,IO),在最短时间 ...
- WaitType:ASYNC
项目组有一个数据库备份的Job运行异常,该Job将备份数据存储到remote server上,平时5个小时就能完成的备份操作,现在运行19个小时还没有完成,backup命令的Wait type是 AS ...
- 性能调优2:CPU
关系型数据库严重依赖底层的硬件资源,CPU是服务器的大脑,当CPU开销很高时,内存和硬盘系统都会产生不必需要的压力.CPU的性能问题,直观来看,就是任务管理器中看到的CPU利用率始终处于100%,而侦 ...
- 查看Validate Subscription 的结果
Sql Server Replication Monitor 提供一个feature,能够verify Replication的 Publication 和 Subscription 的数据同步sta ...
- SQL Server简洁查询正在运行的进程SQL
通常我们可以使用 sp_who2 我们希望更加简洁的信息,下面这个查询使用系统表sys.sysprocesses,以及sys.dm_exec_sql_text做OUTER APPLY. T-SQL是这 ...
- sys.sysprocesses视图的使用小结
Sys.SysProcesses 系统表是一个很重要的系统视图,主要用来定位与解决Sql Server的阻塞和死锁包含正在 SQL Server 实例上运行的进程的相关信息.这些进程可以是客户端进程或 ...
随机推荐
- Laravel使用笔记 —— migration
在使用 php artisan make:migration 创建migration时,可用 --path 指定创建migration文件的路径, 如果在执行的 php artisan migrate ...
- Mongodb常用命令介绍
查看命令的方式: 1.在shell中运行db.listCommands() 2.在浏览器中访问管理员接口:http://ipaddress:28017/_commands 下面介绍在Mongodb中最 ...
- vue 学习笔记
使用vue框架做了一个项目,在这个过程中,摸索学习了vue,把过程学习到技术整理放在这里,供以后查看.
- Android历史版本Logo
Android操作系统是一个由Google和开放手持设备联盟共同开发发展的移动设备操作系统,其最早的一个版本Android 1.0 beta发布于2007年11月5日,至今已经发布了多个更新. ...
- JavaScript固定宽高
固定高宽: <script type="text/javascript"> if (/Android (\d+\.\d+)/.test(navigat ...
- Learning Play! 2.4
1) Activator Download typesafe-activator-1.3.5.zip, extract, set path 2) Create new project activato ...
- php止刷新页面重复提交
利用session来解决,首先新建一个session,并赋值,第一次提交后改变session的值,当第二次再此提交此内容时,如果不是我们的赋值,就不在处理传过来的数据.如:<?php sessi ...
- Hadoop.2.x_常用端口及定义方法(转)
组件 节点 默认端口 配置 用途说明 HDFS DataNode 50010 dfs.datanode.address datanode服务端口,用于数据传输 HDFS DataNode 5007 ...
- java并发编程(十七)内存操作总结
转载请注明出处:http://blog.csdn.net/ns_code/article/details/17377197 主内存与工作内存 Java内存模型的主要目标是定义程序中各个变量的访问规则, ...
- javascript中的内置对象总结
内置对象 标准内置对象 Object Object.create Object.prototype.toString Object.prototype.hasOwnProperty Boolean S ...