java CPU 100% 排查
一个应用占用CPU很高,除了确实是计算密集型应用之外,通常原因都是出现了死循环。
(友情提示:本博文章欢迎转载,但请注明出处:hankchen,http://www.blogjava.net/hankchen)
以我们最近出现的一个实际故障为例,介绍怎么定位和解决这类问题。
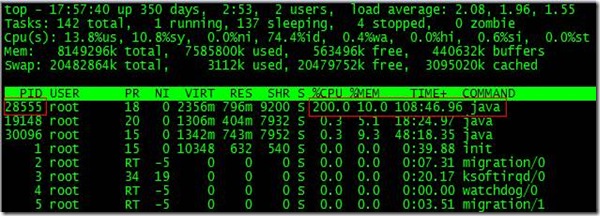
根据top命令,发现PID为28555的Java进程占用CPU高达200%,出现故障。
通过ps aux | grep PID命令,可以进一步确定是tomcat进程出现了问题。但是,怎么定位到具体线程或者代码呢?
首先显示线程列表:
ps -mp pid -o THREAD,tid,time
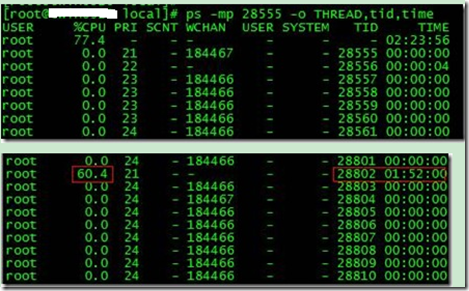
找到了耗时最高的线程28802,占用CPU时间快两个小时了!
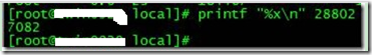
其次将需要的线程ID转换为16进制格式:
printf "%x\n" tid
最后打印线程的堆栈信息:
jstack pid |grep tid -A 30
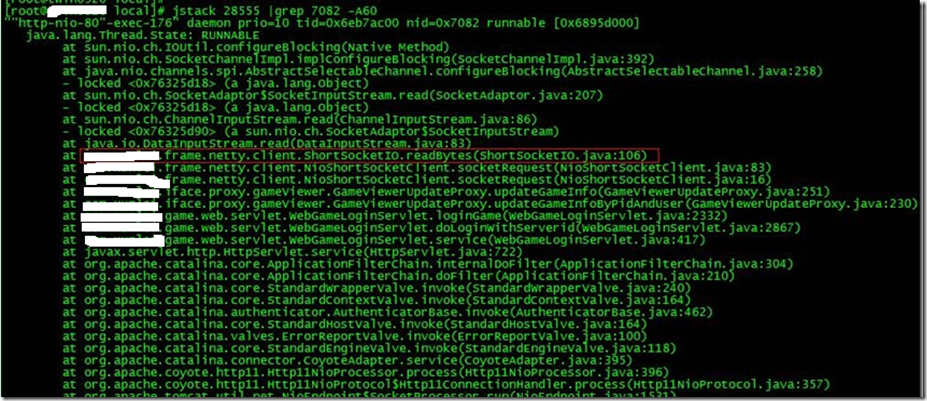
找到出现问题的代码了!
现在来分析下具体的代码:ShortSocketIO.readBytes(ShortSocketIO.java:106)
ShortSocketIO是应用封装的一个用短连接Socket通信的工具类。readBytes函数的代码如下:
public byte[] readBytes(int length) throws IOException {
if ((this.socket == null) || (!this.socket.isConnected())) {
throw new IOException("++++ attempting to read from closed socket");
}
byte[] result = null;
ByteArrayOutputStream bos = new ByteArrayOutputStream();
if (this.recIndex >= length) {
bos.write(this.recBuf, 0, length);
byte[] newBuf = new byte[this.recBufSize];
if (this.recIndex > length) {
System.arraycopy(this.recBuf, length, newBuf, 0, this.recIndex - length);
}
this.recBuf = newBuf;
this.recIndex -= length;
} else {
int totalread = length;
if (this.recIndex > 0) {
totalread -= this.recIndex;
bos.write(this.recBuf, 0, this.recIndex);
this.recBuf = new byte[this.recBufSize];
this.recIndex = 0;
}
int readCount = 0;
while (totalread > 0) {
if ((readCount = this.in.read(this.recBuf)) > 0) {
if (totalread > readCount) {
bos.write(this.recBuf, 0, readCount);
this.recBuf = new byte[this.recBufSize];
this.recIndex = 0;
} else {
bos.write(this.recBuf, 0, totalread);
byte[] newBuf = new byte[this.recBufSize];
System.arraycopy(this.recBuf, totalread, newBuf, 0, readCount - totalread);
this.recBuf = newBuf;
this.recIndex = (readCount - totalread);
}
totalread -= readCount;
}
}
}
问题就出在标红的代码部分。如果this.in.read()返回的数据小于等于0时,循环就一直进行下去了。而这种情况在网络拥塞的时候是可能发生的。
至于具体怎么修改就看业务逻辑应该怎么对待这种特殊情况了。
最后,总结下排查CPU故障的方法和技巧有哪些:
1、top命令:Linux命令。可以查看实时的CPU使用情况。也可以查看最近一段时间的CPU使用情况。
2、PS命令:Linux命令。强大的进程状态监控命令。可以查看进程以及进程中线程的当前CPU使用情况。属于当前状态的采样数据。
3、jstack:Java提供的命令。可以查看某个进程的当前线程栈运行情况。根据这个命令的输出可以定位某个进程的所有线程的当前运行状态、运行代码,以及是否死锁等等。
4、pstack:Linux命令。可以查看某个进程的当前线程栈运行情况。
java CPU 100% 排查的更多相关文章
- Java死锁排查和Java CPU 100% 排查的步骤整理
================================================= 人工智能教程.零基础!通俗易懂!风趣幽默!大家可以看看是否对自己有帮助! 点击查看高清无码教程 == ...
- [转]Java CPU 100% 排查技巧
文章来源:微信公众号:猿天地 平时多积累一点,这样在遇到问题的时候就少句求人的话.如果在实际的开发中遇到CPU 100%问题,要怎么排查呢?如果你没有遇到过这个问题,请先自己思考10s,如果你遇到过, ...
- java CPU 100% 排查(转载)
一个应用占用CPU很高,除了确实是计算密集型应用之外,通常原因都是出现了死循环. (友情提示:本博文章欢迎转载,但请注明出处:hankchen,http://www.blogjava.net/hank ...
- [Java] CPU 100% 原因查找解决
CPU 100%肯定是出现死锁,这个时候观察内存还是够用的,但是CPU一直100%,以下几步解决: 1. 找到进程消耗cpu最大的 $top top - :: up days, :, user, lo ...
- 一次生产 CPU 100% 排查优化实践
前言 到了年底果然都不太平,最近又收到了运维报警:表示有些服务器负载非常高,让我们定位问题. 还真是想什么来什么,前些天还故意把某些服务器的负载提高(没错,老板让我写个 BUG!),不过还好是不同的环 ...
- 阿里短信回持.net sdk的bug导致生产服务cpu 100%排查
一:背景 1. 讲故事 去年阿里聚石塔上的所有isv短信通道全部对接阿里通信,我们就做了对接改造,使用阿里提供的.net sdk. 网址:https://help.aliyun.com/documen ...
- what linux java cpu 100% ?
1.用top找到最耗资源的进程id [ bin]# toptop - 16:56:14 up 119 days, 6:17, 7 users, load average: 2.04, 2.07, 2. ...
- linux java cpu 100%
1.用top找到最耗资源的进程id [ bin]# toptop - 16:56:14 up 119 days, 6:17, 7 users, load average: 2.04, 2.07, 2. ...
- 一文学会Java死锁和CPU 100% 问题的排查技巧
做一个积极的人 编码.改bug.提升自己 我有一个乐园,面向编程,春暖花开 工欲善其事,必先利其器 00 本文简介 作为一名搞技术的程序猿或者是攻城狮,想必你应该是对下面这两个问题有所了解,说不定你在 ...
随机推荐
- [转载]java调用本地dos命令
在社区看到java调用本地dos命令的代码,特贴出来 String command = "ipconfig"; Runtime run = Runtime.getRuntime() ...
- BOM之其他浏览器对象的使用
body, table{font-family: 微软雅黑; font-size: 10pt} table{border-collapse: collapse; border: solid gray; ...
- python原生的日志模块
Python中有个logging模块可以完成相关信息的记录,在debug时用它往往事半功倍 1. 日志级别 日志一共分成5个等级,从低到高分别是: DEBUG INFO WARNING ERROR C ...
- 基于 React + NodeJS + Express + MongoDB 开发的一个社区系统
还可以, 功能挺全的, 可以作为react开发入门项目 链接 线上站点: 源码地址:
- 李氏滑动事件冲突解决方案 之 处理子ViewGroup的超棒方案
父ViewGroup(CurView) 和 子 ViewGroup(ParentView) 滑动事件冲突解决方案 之 处理子ViewGroup的超棒方案: 子ViewGroup 以 SlipRelat ...
- VMware 虚拟机快照、克隆、磁盘扩容
1. 快照 快照是虚拟机某个时间点上完整系统的镜像,可以在虚拟机内部通过快照文件恢复系统到之前的节点. 拍摄快照: 恢复快照: 2. 克隆 克隆是原始虚拟机全部状态的一个拷贝,是脱离原始虚拟机独立存在 ...
- PyalgoTrade 计算权重平滑平均价(三)
本节介绍如何使用收盘价的SMA价格的策略 from pyalgotrade import strategy from pyalgotrade.barfeed import yahoofeed from ...
- MySQl中隔离级别和悲观锁乐观锁
1.MySql的事物支持 MySQL的事务支持不是绑定在MySQL服务器本身,而是与存储引擎相关: MyISAM:不支持事务,用于只读程序提高性能 InnoDB:支持ACID事务.行级锁.并发 Ber ...
- swift3.0 创建经典界面的九宫图
网络上很多例子都是早期的 Object-C的效果,现在用到Swift3.0开发,故把网络上的例子翻译过来,达到基本的效果.可是现在这个还不算很满意,再下次继续进行优化 override func vi ...
- 升级到SQL Server 2012/2014时一些需要考虑的事项
1. 使用Upgrade Adviser评估升级前需要解决的事情. https://msdn.microsoft.com/zh-cn/library/ms144256(v=sql.110).aspx ...