
3D环饼图
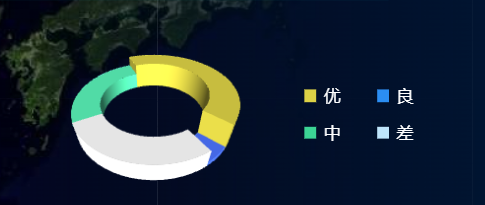
//
init() {
//构建3d饼状图
let myChart = echarts.init(document.getElementById('anaChartPie'));
// 传入数据生成 option
this.option = this.getPie3D(this.optionData, 0.8);
myChart.setOption(this.option);
//是否需要label指引线,如果要就添加一个透明的2d饼状图并调整角度使得labelLine和3d的饼状图对齐,并再次setOption
this.option.series.push({
name: 'pie2d',
type: 'pie',
labelLine: {
show: false,
length: 10,
length2: 10
},
startAngle: -20, //起始角度,支持范围[0, 360]。
clockwise: false, //饼图的扇区是否是顺时针排布。上述这两项配置主要是为了对齐3d的样式
radius: ['20%', '50%'],
center: ['50%', '50%'],
data: this.optionData,
itemStyle: {
opacity: 0
}
});
myChart.setOption(this.option);
this.bindListen(myChart);
}, getPie3D(pieData, internalDiameterRatio) {
//internalDiameterRatio:透明的空心占比
let that = this;
let series = [];
let sumValue = 0;
let startValue = 0;
let endValue = 0;
let legendData = [];
let legendBfb = [];
let k = 1 - internalDiameterRatio;
pieData.sort((a, b) => {
return b.value - a.value;
});
// 为每一个饼图数据,生成一个 series-surface 配置
for (let i = 0; i < pieData.length; i++) {
sumValue += pieData[i].value;
let seriesItem = {
name: typeof pieData[i].name === 'undefined' ? `series${i}` : pieData[i].name,
type: 'surface',
parametric: true,
wireframe: {
show: false
},
pieData: pieData[i],
pieStatus: {
selected: false,
hovered: false,
k: k
},
center: ['10%', '50%']
}; if (typeof pieData[i].itemStyle != 'undefined') {
let itemStyle = {};
typeof pieData[i].itemStyle.color != 'undefined' ? (itemStyle.color = pieData[i].itemStyle.color) : null;
typeof pieData[i].itemStyle.opacity != 'undefined' ? (itemStyle.opacity = pieData[i].itemStyle.opacity) : null;
seriesItem.itemStyle = itemStyle;
}
series.push(seriesItem);
} // 使用上一次遍历时,计算出的数据和 sumValue,调用 getParametricEquation 函数,
// 向每个 series-surface 传入不同的参数方程 series-surface.parametricEquation,也就是实现每一个扇形。
legendData = [];
legendBfb = [];
for (let i = 0; i < series.length; i++) {
endValue = startValue + series[i].pieData.value;
series[i].pieData.startRatio = startValue / sumValue;
series[i].pieData.endRatio = endValue / sumValue;
series[i].parametricEquation = this.getParametricEquation(series[i].pieData.startRatio, series[i].pieData.endRatio, false, false, k, series[i].pieData.value);
startValue = endValue;
let bfb = that.fomatFloat(series[i].pieData.value / sumValue, 4);
legendData.push({
name: series[i].name,
value: bfb
});
legendBfb.push({
name: series[i].name,
value: bfb
});
}
let boxHeight = this.getHeight3D(series, 18); //通过传参设定3d饼/环的高度,26代表26px
// 准备待返回的配置项,把准备好的 legendData、series 传入。
let option = {
label: {
show: false,
position: 'outside',
rich: {
b: {
color: '#7BC0CB',
fontSize: 12,
lineHeight: 20
},
c: {
fontSize: 16
}
},
formatter: '{b|{b} \n}{c|{c}}{b| 亩}'
},
tooltip: {
formatter: params => {
if (params.seriesName !== 'mouseoutSeries' && params.seriesName !== 'pie2d') {
let bfb = ((option.series[params.seriesIndex].pieData.endRatio - option.series[params.seriesIndex].pieData.startRatio) * 100).toFixed(2);
return `${params.seriesName}<br/>` + `<span style="display:inline-block;margin-right:5px;border-radius:10px;width:10px;height:10px;background-color:${params.color};"></span>` + `${bfb}% +${option.series[params.seriesIndex].pieData.value}`;
}
}
},
xAxis3D: {
min: -1,
max: 1
},
yAxis3D: {
min: -1,
max: 1
},
zAxis3D: {
min: -1,
max: 1
},
grid3D: {
show: false,
boxHeight: boxHeight, //圆环的高度
viewControl: {
//3d效果可以放大、旋转等,请自己去查看官方配置
alpha: 40, //角度
distance: 150, //调整视角到主体的距离,类似调整zoom
rotateSensitivity: 0, //设置为0无法旋转
zoomSensitivity: 0, //设置为0无法缩放
panSensitivity: 0, //设置为0无法平移
autoRotate: false //自动旋转
}
},
series: series
};
return option;
}, //获取3d丙图的最高扇区的高度
getHeight3D(series, height) {
series.sort((a, b) => {
return b.pieData.value - a.pieData.value;
});
return (height * 25) / series[0].pieData.value;
}, // 生成扇形的曲面参数方程,用于 series-surface.parametricEquation
getParametricEquation(startRatio, endRatio, isSelected, isHovered, k, h) {
// 计算
let midRatio = (startRatio + endRatio) / 2;
let startRadian = startRatio * Math.PI * 2;
let endRadian = endRatio * Math.PI * 2;
let midRadian = midRatio * Math.PI * 2;
// 如果只有一个扇形,则不实现选中效果。
if (startRatio === 0 && endRatio === 1) {
isSelected = false;
}
// 通过扇形内径/外径的值,换算出辅助参数 k(默认值 1/3)
k = typeof k !== 'undefined' ? k : 1 / 3;
// 计算选中效果分别在 x 轴、y 轴方向上的位移(未选中,则位移均为 0)
let offsetX = isSelected ? Math.cos(midRadian) * 0.1 : 0;
let offsetY = isSelected ? Math.sin(midRadian) * 0.1 : 0;
// 计算高亮效果的放大比例(未高亮,则比例为 1)
let hoverRate = isHovered ? 1.05 : 1;
// 返回曲面参数方程
return {
u: {
min: -Math.PI,
max: Math.PI * 3,
step: Math.PI / 32
},
v: {
min: 0,
max: Math.PI * 2,
step: Math.PI / 20
},
x: function (u, v) {
if (u < startRadian) {
return offsetX + Math.cos(startRadian) * (1 + Math.cos(v) * k) * hoverRate;
}
if (u > endRadian) {
return offsetX + Math.cos(endRadian) * (1 + Math.cos(v) * k) * hoverRate;
}
return offsetX + Math.cos(u) * (1 + Math.cos(v) * k) * hoverRate;
},
y: function (u, v) {
if (u < startRadian) {
return offsetY + Math.sin(startRadian) * (1 + Math.cos(v) * k) * hoverRate;
}
if (u > endRadian) {
return offsetY + Math.sin(endRadian) * (1 + Math.cos(v) * k) * hoverRate;
}
return offsetY + Math.sin(u) * (1 + Math.cos(v) * k) * hoverRate;
},
z: function (u, v) {
if (u < -Math.PI * 0.5) {
return Math.sin(u);
}
if (u > Math.PI * 2.5) {
return Math.sin(u) * h * 0.1;
}
return Math.sin(v) > 0 ? 1 * h * 0.1 : -1;
}
};
}, fomatFloat(num, n) {
var f = parseFloat(num);
if (isNaN(f)) {
return false;
}
f = Math.round(num * Math.pow(10, n)) / Math.pow(10, n); // n 幂
var s = f.toString();
var rs = s.indexOf('.');
//判定如果是整数,增加小数点再补0
if (rs < 0) {
rs = s.length;
s += '.';
}
while (s.length <= rs + n) {
s += '0';
}
return s;
}, bindListen(myChart) {
// 监听鼠标事件,实现饼图选中效果(单选),近似实现高亮(放大)效果。
let that = this;
let selectedIndex = '';
let hoveredIndex = '';
// 监听点击事件,实现选中效果(单选)
myChart.on('click', function (params) {
// 从 option.series 中读取重新渲染扇形所需的参数,将是否选中取反。
let isSelected = !that.option.series[params.seriesIndex].pieStatus.selected;
let isHovered = that.option.series[params.seriesIndex].pieStatus.hovered;
let k = that.option.series[params.seriesIndex].pieStatus.k;
let startRatio = that.option.series[params.seriesIndex].pieData.startRatio;
let endRatio = that.option.series[params.seriesIndex].pieData.endRatio;
// 如果之前选中过其他扇形,将其取消选中(对 option 更新)
if (selectedIndex !== '' && selectedIndex !== params.seriesIndex) {
that.option.series[selectedIndex].parametricEquation = that.getParametricEquation(that.option.series[selectedIndex].pieData.startRatio, that.option.series[selectedIndex].pieData.endRatio, false, false, k, that.option.series[selectedIndex].pieData.value);
that.option.series[selectedIndex].pieStatus.selected = false;
}
// 对当前点击的扇形,执行选中/取消选中操作(对 option 更新)
that.option.series[params.seriesIndex].parametricEquation = that.getParametricEquation(startRatio, endRatio, isSelected, isHovered, k, that.option.series[params.seriesIndex].pieData.value);
that.option.series[params.seriesIndex].pieStatus.selected = isSelected;
// 如果本次是选中操作,记录上次选中的扇形对应的系列号 seriesIndex
isSelected ? (selectedIndex = params.seriesIndex) : null;
// 使用更新后的 option,渲染图表
myChart.setOption(that.option);
});
// 监听 mouseover,近似实现高亮(放大)效果
myChart.on('mouseover', function (params) {
// 准备重新渲染扇形所需的参数
let isSelected;
let isHovered;
let startRatio;
let endRatio;
let k;
// 如果触发 mouseover 的扇形当前已高亮,则不做操作
if (hoveredIndex === params.seriesIndex) {
return;
// 否则进行高亮及必要的取消高亮操作
} else {
// 如果当前有高亮的扇形,取消其高亮状态(对 option 更新)
if (hoveredIndex !== '') {
// 从 option.series 中读取重新渲染扇形所需的参数,将是否高亮设置为 false。
isSelected = that.option.series[hoveredIndex].pieStatus.selected;
isHovered = false;
startRatio = that.option.series[hoveredIndex].pieData.startRatio;
endRatio = that.option.series[hoveredIndex].pieData.endRatio;
k = that.option.series[hoveredIndex].pieStatus.k;
// 对当前点击的扇形,执行取消高亮操作(对 option 更新)
that.option.series[hoveredIndex].parametricEquation = that.getParametricEquation(startRatio, endRatio, isSelected, isHovered, k, that.option.series[hoveredIndex].pieData.value);
that.option.series[hoveredIndex].pieStatus.hovered = isHovered;
// 将此前记录的上次选中的扇形对应的系列号 seriesIndex 清空
hoveredIndex = '';
}
// 如果触发 mouseover 的扇形不是透明圆环,将其高亮(对 option 更新)
if (params.seriesName !== 'mouseoutSeries' && params.seriesName !== 'pie2d') {
// 从 option.series 中读取重新渲染扇形所需的参数,将是否高亮设置为 true。
isSelected = that.option.series[params.seriesIndex].pieStatus.selected;
isHovered = true;
startRatio = that.option.series[params.seriesIndex].pieData.startRatio;
endRatio = that.option.series[params.seriesIndex].pieData.endRatio;
k = that.option.series[params.seriesIndex].pieStatus.k;
// 对当前点击的扇形,执行高亮操作(对 option 更新)
that.option.series[params.seriesIndex].parametricEquation = that.getParametricEquation(startRatio, endRatio, isSelected, isHovered, k, that.option.series[params.seriesIndex].pieData.value + 5);
that.option.series[params.seriesIndex].pieStatus.hovered = isHovered;
// 记录上次高亮的扇形对应的系列号 seriesIndex
hoveredIndex = params.seriesIndex;
}
// 使用更新后的 option,渲染图表
myChart.setOption(that.option);
}
});
// 修正取消高亮失败的 bug
myChart.on('globalout', function () {
// 准备重新渲染扇形所需的参数
let isSelected;
let isHovered;
let startRatio;
let endRatio;
let k;
if (hoveredIndex !== '') {
// 从 option.series 中读取重新渲染扇形所需的参数,将是否高亮设置为 true。
isSelected = that.option.series[hoveredIndex].pieStatus.selected;
isHovered = false;
k = that.option.series[hoveredIndex].pieStatus.k;
startRatio = that.option.series[hoveredIndex].pieData.startRatio;
endRatio = that.option.series[hoveredIndex].pieData.endRatio;
// 对当前点击的扇形,执行取消高亮操作(对 option 更新)
that.option.series[hoveredIndex].parametricEquation = that.getParametricEquation(startRatio, endRatio, isSelected, isHovered, k, that.option.series[hoveredIndex].pieData.value);
that.option.series[hoveredIndex].pieStatus.hovered = isHovered;
// 将此前记录的上次选中的扇形对应的系列号 seriesIndex 清空
hoveredIndex = '';
}
// 使用更新后的 option,渲染图表
myChart.setOption(that.option);
});
}
3D环饼图的更多相关文章
- FusionCharts 3D环饼图
1.设计静态页面 Doughnut.html: <!DOCTYPE HTML PUBLIC "-//W3C//DTD HTML 4.01 Transitional//EN"& ...
- 4-Highcharts 3D图之3D普通饼图
<!DOCTYPE> <html lang='en'> <head> <title>4-Highcharts 3D图之3D普通饼图</title& ...
- 利用echarts highcharts 实现自定义地图 关系图效果 侧边3D柱形图饼图散点图
github 地址: https://https://github.com/Gengshaoxuan/medataMap github 地址: https://https://github.com ...
- FusionCharts 2D环饼图
1.静态页面 Doughnut.html: <!DOCTYPE HTML PUBLIC "-//W3C//DTD HTML 4.01 Transitional//EN"> ...
- FusionCharts 3D环饼图报错
1.在设计FusionCharts 3D环饼图时,出现错误,图显示不出来,具体错误如下图: 2.经过检查,发现声明的变量和下面引用的变量不一致 var doughnut2D = new FusionC ...
- JFreeChart 使用一 饼图之高级特性
原文链接:http://www.cnblogs.com/jtmjx/archive/2013/04/23/jfreechart_advantage.html 本文主要讲解JFreeChart中饼图的一 ...
- 3-Highcharts 3D图之3D柱状图分组叠堆3D图
<!DOCTYPE> <html lang='en'> <head> <title>3-Highcharts 3D图之3D柱状图分组叠堆3D图</ ...
- 2-Highcharts 3D图之3D柱状图带可调试倾斜角度
<!DOCTYPE> <html lang='en'> <head> <title>2-Highcharts 3D图之3D柱状图带可调试倾斜角度< ...
- FusionCharts多数据验证饼图label是否重叠
昨天,有人问我一个问题:由于饼图的数据太多,label标签上的汉字过多,导致重叠,该怎么解决? 今天我用大量的数据,label标签的字符也很多,但是通过验证没有发现有重叠的情况啊! 1.验证的JSP页 ...
- 三分钟学会funsioncharts
由于项目需求需要做一个报表,选择FusionCharts作为工具使用.由于以前没有接触过报表,网上也没有比较详细的fusionCharts教程,所以决定好好研究FusionCharts,同时做一个比较 ...
随机推荐
- [转帖]FIO使用说明
FIO介绍: FIO是测试IOPS的非常好的工具,用来对磁盘进行压力测试和验证.磁盘IO是检查磁盘性能的重要指标,可以按照负载情况分成照顺序读写,随机读写两大类.FIO是一个可以产生很多线程或进程并执 ...
- Python学习之二:不同数据库相同表是否相同的比较方法
摘要 昨天学习了使用python进行数据库主键异常的查看. 当时想我们有跨数据库的数据同步场景. 对应的我可以对不同数据库的相同表的核心字段进行对比. 这样的话能够极大的提高工作效率. 我之前写过很长 ...
- [转帖]比 Python 快 35000 倍!LLVM&Swift 之父宣布全新编程语言 Mojo:编程被颠覆了
https://www.infoq.cn/article/GFfVLVpkIGOcKYB85Opb "Mojo 可能是近几十年来最大的编程语言进步." 近日,由 LLVM 和 Sw ...
- SqlSugar分组查询
一.分组查询和使用 1.1 语法 只有在聚合对象需要筛选的时候才会用到Having,一般分组查询用不到可以去掉 var list = db.Queryable<Student>() ...
- 多模态对比语言图像预训练CLIP:打破语言与视觉的界限
多模态对比语言图像预训练CLIP:打破语言与视觉的界限 一种基于多模态(图像.文本)对比训练的神经网络.它可以在给定图像的情况下,使用自然语言来预测最相关的文本片段,而无需为特定任务进行优化.CLIP ...
- 基于文心大模型套件ERNIEKit实现文本匹配算法,模块化方便应用落地
文心大模型,产业级知识增强大模型介绍 官网:https://wenxin.baidu.com/ 项目链接见文末 文心大模型开发套件ERNIEKit,面向NLP工程师,提供全流程大模型开发与部署工具集, ...
- Origin2017、Origin2018详细安装教程
1.Origin2017安装 1.1 安装步骤: 解压安装包,打开"Origin2017"目录,双击"setup.exe"开始安装 安装步骤1,点击[下一步] ...
- 环境调试bug【一】
1.报错修改`np.bool`---bool H:\Anaconda3-2020.02\envs\parl\lib\site-packages\paddle\fluid\framework.py:54 ...
- 【深度学习项目五】:利用LSTM网络进行情感分析(NLP)
相关文章: [深度学习项目一]全连接神经网络实现mnist数字识别](https://blog.csdn.net/sinat_39620217/article/details/116749255?sp ...
- 微服务保护-Sentinel
1.初识Sentinel 1.1.雪崩问题及解决方案 1.1.1.雪崩问题 微服务中,服务间调用关系错综复杂,一个微服务往往依赖于多个其它微服务. 如图,如果服务提供者I发生了故障,当前的应用的部分业 ...