Machine Learning Week_8 K-means And PCA
- 1 K-means
- 2 PCA
1 K-means
1.1 Unsupervised Learning:Introduction
In this video, I'd like to start to talk about clustering.
This will be exciting, because this is our first unsupervised learning algorithm, where we learn from unlabeled data instead from labelled data.
So, what is unsupervised learning? I briefly talked about unsupervised learning at the beginning of the class but it's useful to contrast it with supervised learning. So, here's a typical supervised learning problem where we're given a labeled training set and the goal is to find the decision boundary that separates the positive label examples and the negative label examples. So, the supervised learning problem in this case is given a set of labels to fit a hypothesis to it.
In contrast, in the unsupervised learning problem we're given data that does not have any labels associated with it. So, we're given data that looks like this. Here's a set of points add in no labels, and so, our training set is written just x1, x2, and so on up to xm and we don't get any labels y. And that's why the points plotted up on the figure don't have any labels with them. So, in unsupervised learning what we do is we give this sort of unlabeled training set to an algorithm and we just ask the algorithm find some structure in the data for us. Given this data set one type of structure we might have an algorithm find is that it looks like this data set has points grouped into two separate clusters.
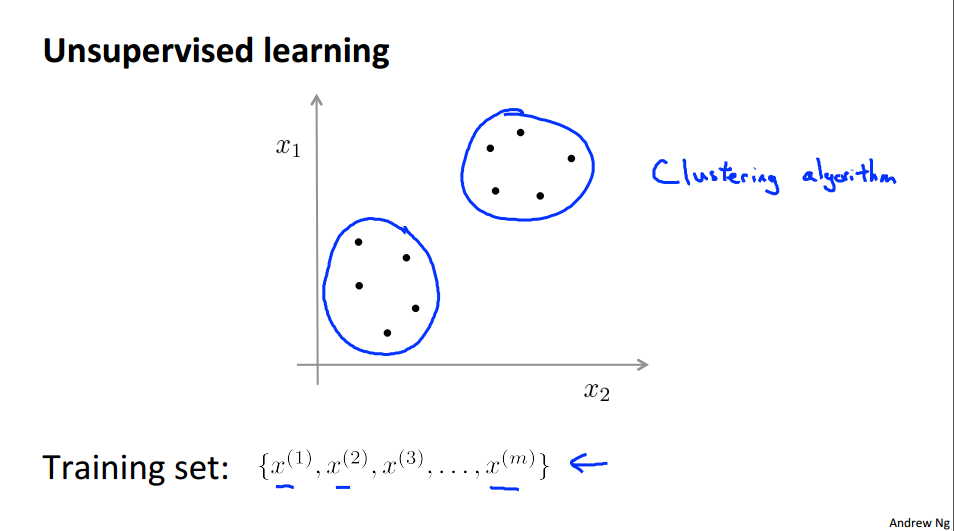
So an algorithm that finds clusters like the ones I've just circled is called a clustering algorithm. And this would be our first type of unsupervised learning, although there will be other types of unsupervised learning algorithms that we'll talk about later that finds other types of structure or other types of patterns in the data other than clusters. We'll talk about this after we've talked about clustering.
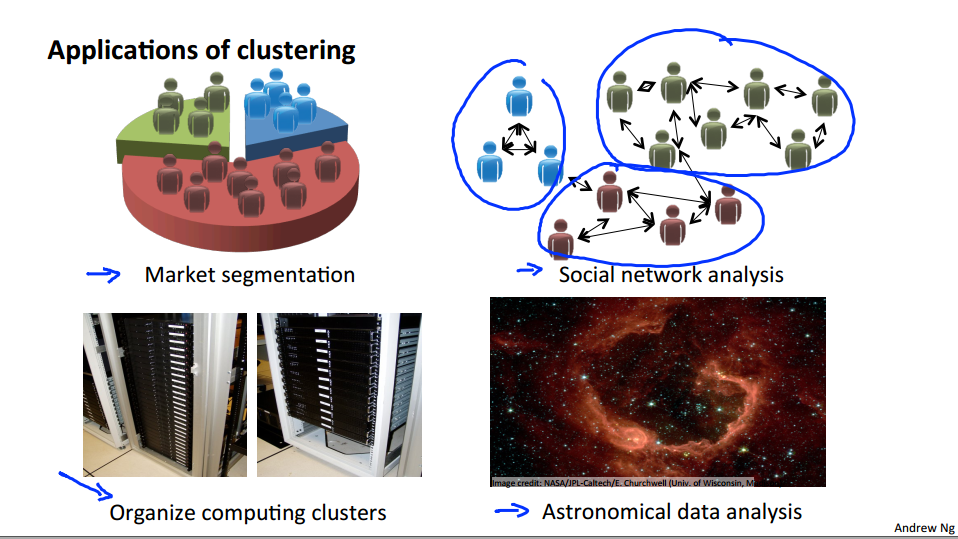
So, what is clustering good for? Early in this class I already mentioned a few applications.
One is market segmentation where you may have a database of customers and want to group them into different marker segments so you can sell to them separately or serve your different market segments better. Social network analysis. There are actually groups have done this things like looking at a group of people's social networks. So, things like Facebook, Google+, or maybe information about who other people that you email the most frequently and who are the people that they email the most frequently and to find coherence in groups of people. So, this would be another maybe clustering algorithm where you know want to find who are the coherent groups of friends in the social network? Here's something that one of my friends actually worked on which is, use clustering to organize computer clusters or to organize data centers better. Because if you know which computers in the data center in the cluster tend to work together, you can use that to reorganize your resources and how you layout the network and how you design your data center communications. And lastly, something that actually another friend worked on using clustering algorithms to understand galaxy formation and using that to understand astronomical data.
So, that's clustering which is our first example of an unsupervised learning algorithm. In the next video we'll start to talk about a specific clustering algorithm.
1.2 K-Means Algorithm
In the clustering problem we are given an unlabeled data set and we would like to have an algorithm automatically group the data into coherent subsets or into coherent clusters for us. The K Means algorithm is by far the most popular, by far the most widely used clustering algorithm.
 |
 |
 |
 |
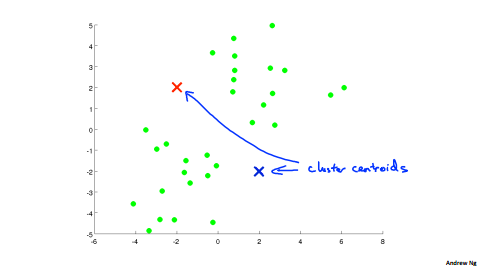
1.2.1 k-means algorithm
input
- K (number of clusters)
- Training set \({x^{(1)}, x^{(2)}, ..., x^{(m)}}\)
- \(x^{(i)} \in R^n\) (drop \(x_0=1\) convention)
First step:
Randomly initialize k cluster centroids \(\mu_1, \mu_2,..., \mu_k\)
\(\mu_k \in R^n\)
Second step:
repeat
{
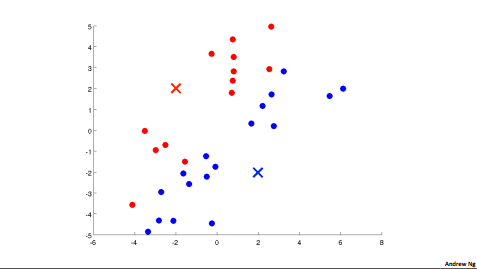
//cluster assignment step;
//\(min_k ||x^{(1)}||\)
for i = 1 to m
\(c^{(i)}\):= Index(from 1 to k) of cluster centroid closest to x^{(i)}
//move centroid step
for k = 1 to k
// i.e. \(\mu_2 = \frac{1}{4}[x^{(1)} + x^{(2)}+x^{(5)}+x^{(6)}]\)
\(\mu_k\):= average(mean) of points assigned to clusters
}
1.3 Optimization Objective
Most of the supervised learning algorithms we've seen, things like linear regression, logistic regression, and so on, all of those algorithms have an optimization objective or some cost function that the algorithm was trying to minimize. It turns out that k-means also has an optimization objective or a cost function that it's trying to minimize. And in this video I'd like to tell you what that optimization objective is.
1.3.1 K-means optimization objective
term
\(c^{(i)}\) = index of cluster (1,2,...,k) to which eample \(x^{(i)}\) is currently assigned
\(\mu_k\) = cluster centroid k
\(\mu_{c^{(i)}}\) = cluster centroid of cluster to which example \(x^{(i)}\) has been assigned
Optimization objective
\]
\]
1.4 Random Initialization
1.4.1 Random initialzation
should have k < m
- Randomly pick k training examples.
- Set \(\mu_1 ,...,\mu_k\) equal to these k examples
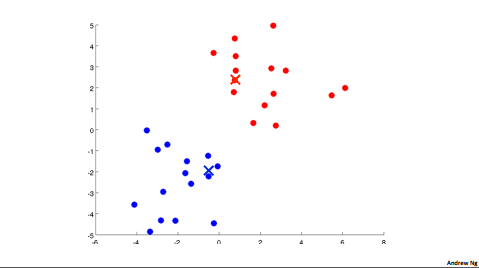
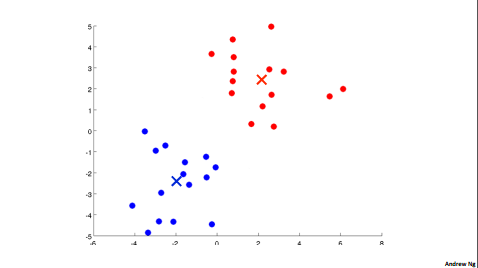
Depending on the random initialzation, k-means can end up at different solutions (End up local optima)
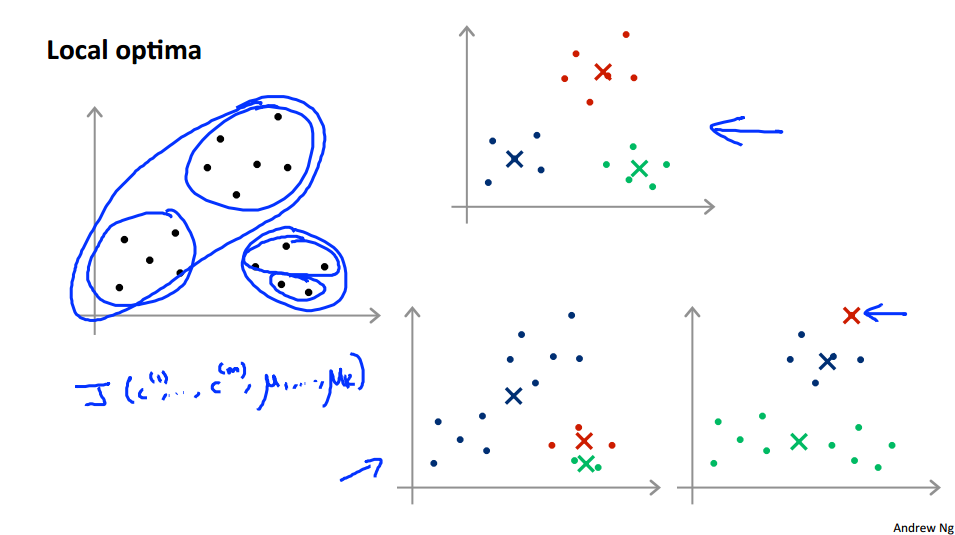
what we can do , is try multiple random initializations, and use that try to make sure we get as good solution.
1.4.2 Code
for i=1 to 100
{
Randomly initialize K-means
Run K-means. Get \(c^{(1)},...,c^{(m)},\mu_1 ,...,\mu_k\)
Compute cost function(distortation)
\(J(c^{(1)},...,c^{(m)},\mu_1,...,\mu_k) = \frac{1}{m}\sum_{i=1}^{m}||x^{(i)}-\mu_{c^{(i)}}||^2\)
}
Pick clustering that gave lowest cost J.
事实证明 \(K \in {2,3,4,..,10}\) 小聚类时,多次运行会很有好处,一旦中心数过于多,多次运行也不会有很好的优化效果。
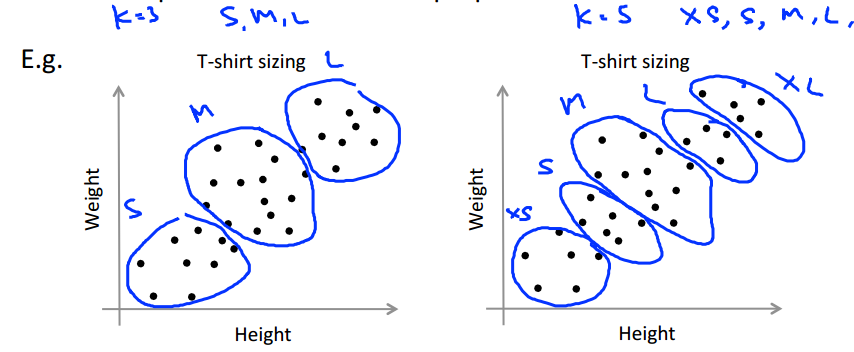
1.5 Choosing the Number of Clusters
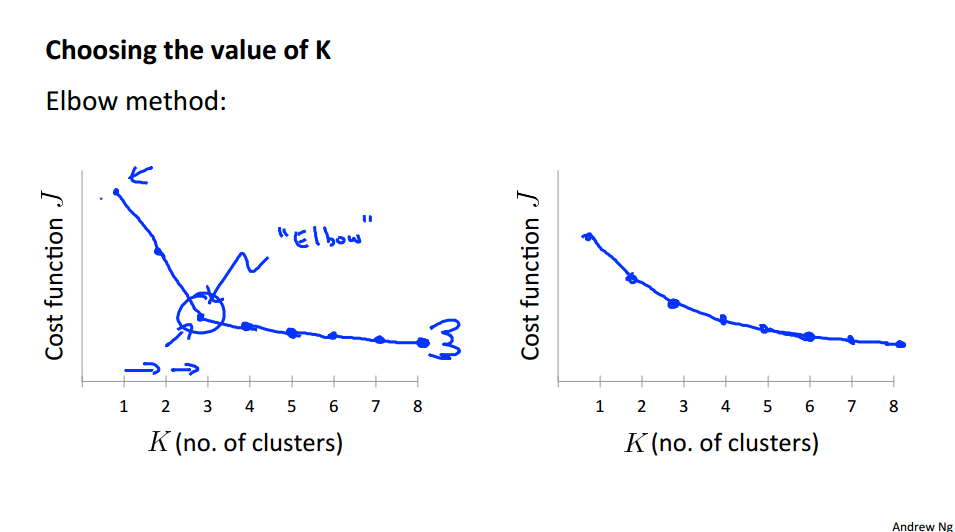
In this video I'd like to talk about one last detail of K-means clustering which is how to choose the number of clusters, or how to choose the value of the parameter K. To be honest, there actually isn't a great way of answering this. Doing this automatically and by far the most common way of choosing the number of clusters, is still choosing it manually by looking at visualizations or by looking at the output of the clustering algorithm or something else.
自动选择K,那么要多次挑选不同的K值,画出对应的曲线图,让我们更好的理解。像是第一张图片里的 Elbow,有一个很清晰的拐点。但有时你并不能很好的观察到这个拐点,这就是自动选择的缺点。
Sometimes, you're running K-means to get clusters to use for some later/downstrem purpose. Evaluate K-means based on a metric for how well it performs for that later purpose.
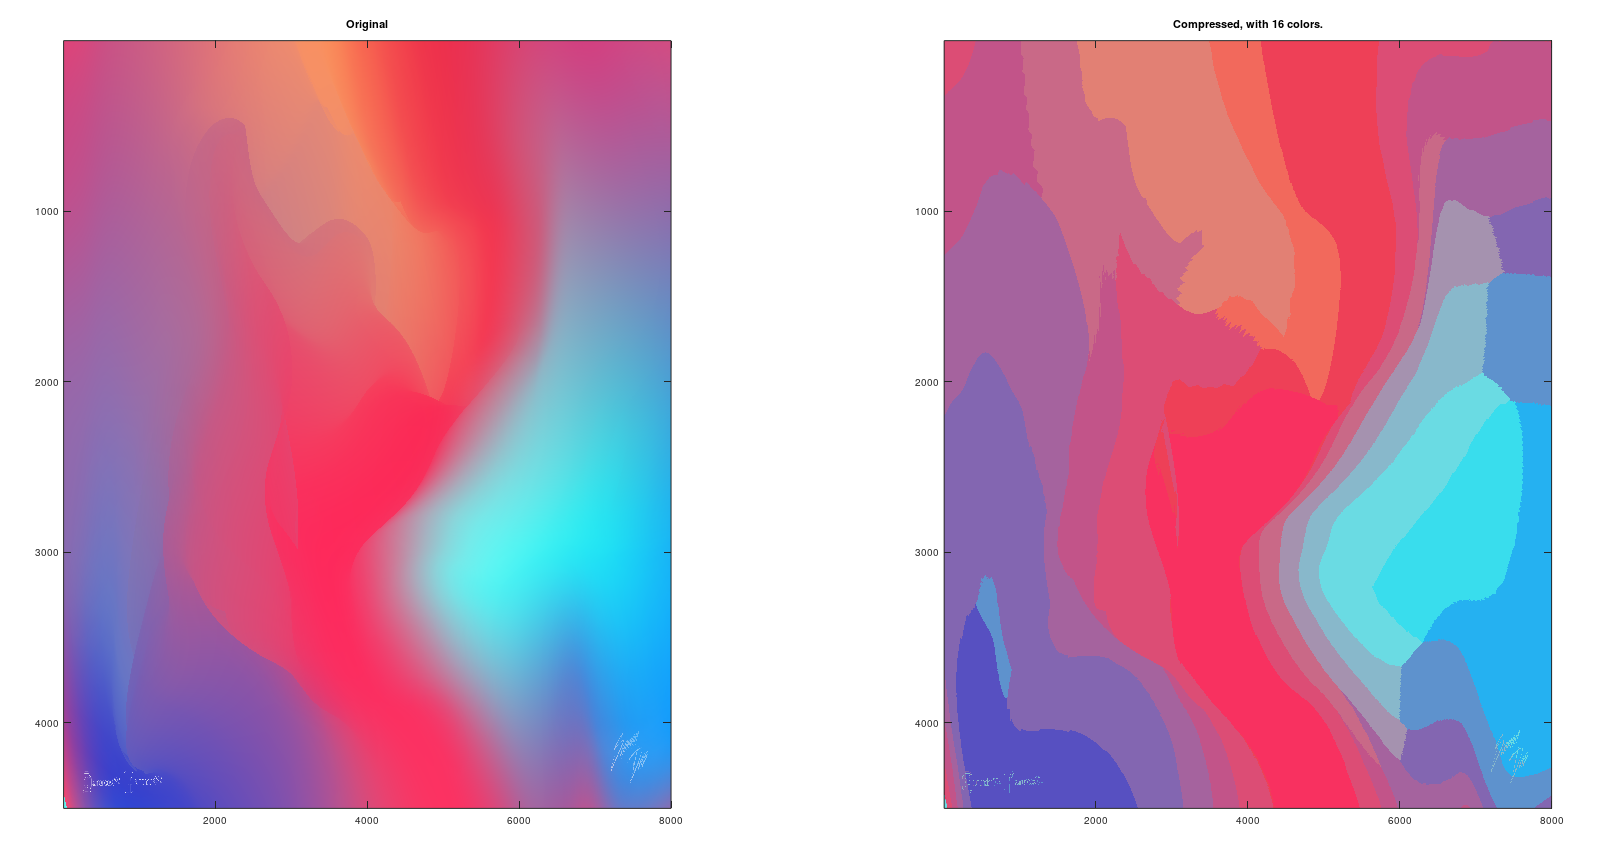
1.6 K-means with Image Compression
2 PCA
2.1 Motivation I: Data Compression
In this video, I'd like to start talking about a second type of unsupervised learning problem called dimensionality reduction.
There are a couple of different reasons why one might want to do dimensionality reduction. One is data compression, and as we'll see later, a few videos later, data compression not only allows us to compress the datapp and have it therefore use up less computer memory or disk space, but it will also allow us to speed up our learning algorithms.

虽然是一个二维的点集(多个二维向量组成的集合), 但要找到这点集的适合的一条直线(方程 ),就可以通过一个点的位置,也就是是一个标量来确定一个二维的点。(Reduce data from 2D to 1D).
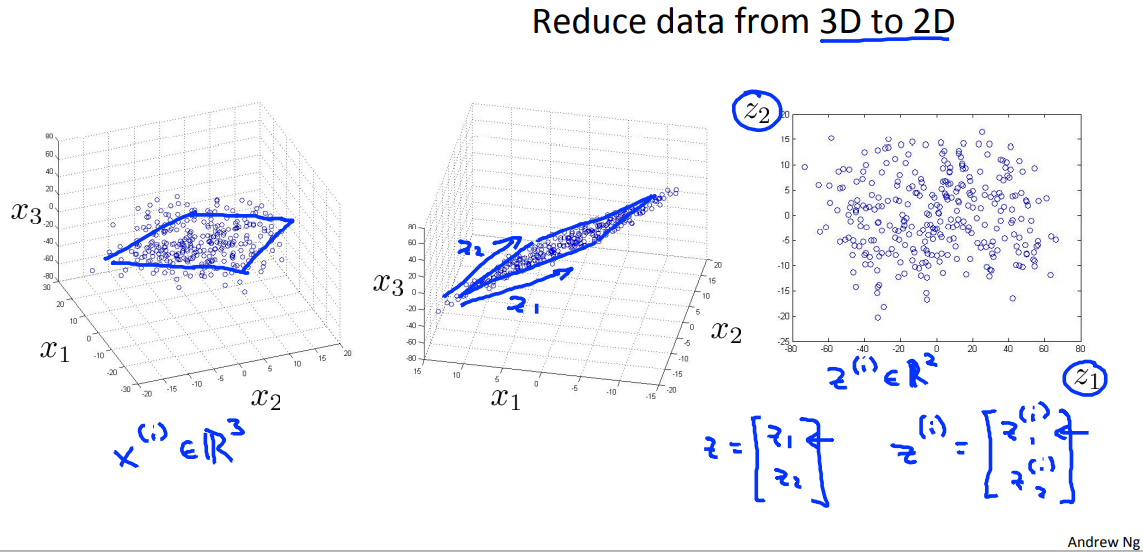
一个3维的点集,只要找到一个适合的平面,就可以通过2维向量点确定原来的3维点的位置。
2.2 Motivation II: Visualization
通常是将数据降到2D或者3D来让我们对于数据有更好的理解。
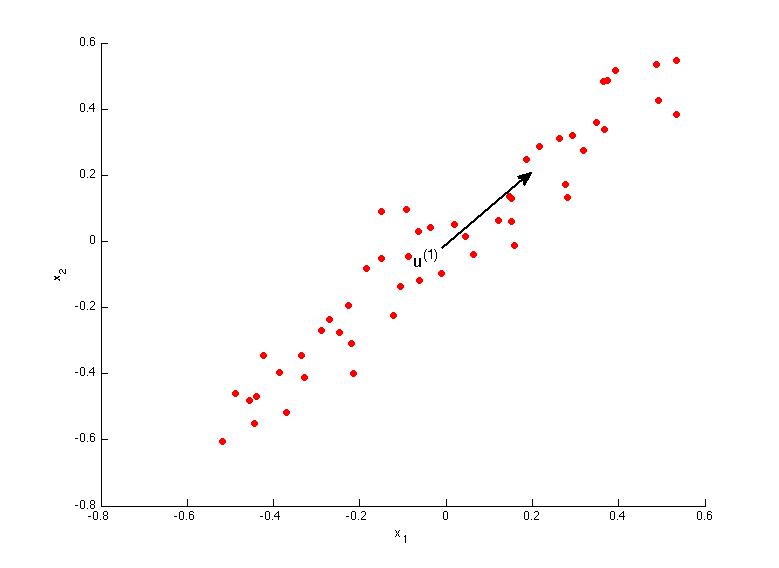
2.3 Principal Component Analysis Problem Formulation

Reudce from 2-dimention to 1-dimention: Find a direct (a vector \(u^{(1)} \in \mathbb{R}\)) onto which to project the data so as to minimize the projection error.
Reudce from 2-dimention to 1-dimention: Find k vectors \(u^{(1)},u^{(2)},...,u^{(k)}\) onto which to project the data so as to minimize the projection error.
PCA同线性回归问题不同的是, PCA的代价函数是找点到投影地的垂直距离。线性回归是预测值与实际值之间的距离。
2.4 Principal Component Analysis Algorithm
2.4.1 Feature scaling/mean nomalization
Training set:\(x^{(1)},x^{(2)},...,x^{(k)}\)
Processing(Feature scaling/mean nomalization)
\(\mu_j = \frac{1}{m} \sum^{m}_{i=1}x^{(i)}_j\)
Replace each \(x^{(i)}_j\) with \(x_j - \mu_j\)
If different features on different scales (e.g \(x_1=\) size of house, \(x_2 =\) number of bedrooms) scale features to have comparable range of values.
2.4.2 PCA
After mean normalization (ensure every feature has zero mean) and optionally feature scaling:
Compute "covariance matrix" :
\(\Sigma = \frac{1}{m} XX^T \; (X \in \mathbb{R}^{m \times n})\)
Compute “eigenvectors” of matrix \(\Sigma\):
[U, S, V] = svd(Sigma);
\(U = \begin{bmatrix} u^{(1)}& u^{(2)}& \cdots & u^{(n)} \end{bmatrix} \; (U \in \mathbb{R}^{n \times n})\)
 |
 |
Ureduce = U(:,i:k)
Z = X * U(:,i:k)
2.5 Reconstruction from Compressed Representation
In some of the earlier videos, I was talking about PCA as a compression algorithm where you may have say, 1,000-dimensional data and compress it to 100-dimensional feature vector. Or have three-dimensional data and compress it to a two-dimensional representation. So, if this is a compression algorithm, there should be a way to go back from this compressed representation back to an approximation of your original high-dimensional data. So given \(z^{(i)}\), which may be 100-dimensional, how do you go back to your original representation, \(x^{(i)}\) or \(x_{approx}^{(i)}\) which was maybe a 1000-dimensional.
X_rec = Z * U(:, 1:k)`
2.6 Choosing the Number of Principal Components
Average squared projection error: \(\frac{1}{m} \sum^{m}_{i=1}||x^{(i)} - x_{approx}^{(i)}\;||^2\)
Total variation in the data: \(\frac{1}{m} \sum^{m}_{i=1} ||x^{(i)}||^2\)
Typically , choose \(k\) to be smallest value so that:
\]
We can say that 99% variance retained instead.
这里还有另一种简单的方法来代替上面的方法。利用到了SVD()函数返回的S矩阵。
s_{11}& 0 & \cdots & 0\\
0 & s_{22} & \cdots & 0\\
\vdots & 0 & \ddots & 0\\
0 & 0 & \cdots & s_{nn}\\
\end{bmatrix} \; (S \in \mathbb{R}^{n \times n})\]
Choose \(k\) to be smallest value so that:
\]
We can say that 99% variance retained
2.7 Advice for Applying PCA
2.2.1 Supervised learning speedup
If we have a training data set \({(x^{(1)},y^{(1)}), (x^{(2)},y^{(2)}), ..., (x^{(m)},y^{(m)})}\).
We can extract inputs to unlabled data which \(x^{(1)},x^{(2)}, ...,x^{(m)} \in \mathbb{R^{10000}}\). Using PCA alogrithem to reudce the data from n-dimention to k-dimention. After that we get \({z^{(1)},z^{(2)}, ...,z^{(m)} \in \mathbb{R^{1000}}}\).
Thus we have a new training set \((z^{(1)},y^{(1)}), (z^{(2)},y^{(2)}), ..., (z^{(m)},y^{(m)})\) to speed up the learning algorithm. Also this operation can reduce memory/disk needed to store data.
Note: Mapping \(x^{(i)} \rightarrow z^{(i)}\)should be defined by running PCA only on the training set. This mapping can be applied as well to the examples \(x^{(i)}_{cv}\) and \(x^{(i)}_{test}\) in the cross valida1on and test sets. Test on test set: Map \(x^{(i)}_{test}\) to \(z^{(i)}_{test}\). Run \(h_\theta (z^{(i)})\) on \((z^{(1)}_{test},y^{(1)}_{test}), (z^{(2)}_{test},y^{(2)}_{test}), ..., (z^{(m)}_{test},y^{(m)}_{test})\).
2.7.2 PCA is sometimes used where it shouldn’t be.
One of the bad use of PCA is that to prevent the overfitting. Use \(z^{(i)}\) instead of \(x^{(i)}\) to reduce the number of features to \(k<n\). Thus fewer features less likely to overfit.
This might work OK but isn't a good way to address overfitting.
Use regularization instead.
\]
\]
Hint: Before implemen1ng PCA first try running whatever you want to do with the original/raw data \(X\) . Only if that doesn't do what you want then implement PCA and consider using \(Z\) .
Machine Learning Week_8 K-means And PCA的更多相关文章
- OpenCV Machine Learning 之 K近期邻分类器的应用 K-Nearest Neighbors
OpenCV Machine Learning 之 K近期邻分类器的应用 以下的程序实现了对高斯分布的点集合进行分类的K近期令分类器 #include "ml.h" #includ ...
- Getting started with machine learning in Python
Getting started with machine learning in Python Machine learning is a field that uses algorithms to ...
- 机器学习实战(Machine Learning in Action)学习笔记————09.利用PCA简化数据
机器学习实战(Machine Learning in Action)学习笔记————09.利用PCA简化数据 关键字:PCA.主成分分析.降维作者:米仓山下时间:2018-11-15机器学习实战(Ma ...
- 另一种压缩图片的方法---Machine learning 之 PCA(Principle Component Analysis)
PCA最主要的用途是用来减少特征向量的数目,N个特征向量 减小到 K个特征向量.如果为了可视化,k可以使3 或者 2.这样可以加速算法的学习速度. PCA用来压缩图像同一有效. 具体方式以及原理在gi ...
- K近邻 Python实现 机器学习实战(Machine Learning in Action)
算法原理 K近邻是机器学习中常见的分类方法之间,也是相对最简单的一种分类方法,属于监督学习范畴.其实K近邻并没有显式的学习过程,它的学习过程就是测试过程.K近邻思想很简单:先给你一个训练数据集D,包括 ...
- Machine Learning for Developers
Machine Learning for Developers Most developers these days have heard of machine learning, but when ...
- How do I learn machine learning?
https://www.quora.com/How-do-I-learn-machine-learning-1?redirected_qid=6578644 How Can I Learn X? ...
- How do I learn mathematics for machine learning?
https://www.quora.com/How-do-I-learn-mathematics-for-machine-learning How do I learn mathematics f ...
- Machine Learning and Data Mining(机器学习与数据挖掘)
Problems[show] Classification Clustering Regression Anomaly detection Association rules Reinforcemen ...
- Course Machine Learning Note
Machine Learning Note Introduction Introduction What is Machine Learning? Two definitions of Machine ...
随机推荐
- 【转载】ubuntu22.04安装gcc-8失败
版权声明:本文为CSDN博主「Death_Note_」的原创文章,遵循CC 4.0 BY-SA版权协议,转载请附上原文出处链接及本声明.原文链接:https://blog.csdn.net/Death ...
- Sentry For Vue 完整接入详解(2021 Sentry v21.8.x)前方高能预警!三万字,慎入!
内容源于:https://docs.sentry.io/platforms/javascript/guides/vue/ 系列 1 分钟快速使用 Docker 上手最新版 Sentry-CLI - 创 ...
- 嵌入式工程师到底要不要学习ARM汇编指令?arm学习文章汇总
嵌入式工程师到底要不要学习ARM汇编指令? 网上搜索这个问题,答案很多,大部分的建议是不要学汇编,只要学C语言. 而一口君作为一个十几年经验的驱动工程师,个人认为,汇编语言还是需要掌握的,想要搞精.搞 ...
- 手把手教你安装MINIGUI编程环境 (MINIGUI版本3.2.0)
0. MINIGUI MiniGUI 是一款面向嵌入式系统的高级窗口系统(Windowing System)和图形用户界面(Graphical User Interface,GUI)支持系统,由魏永明 ...
- Linux基础优化与常用软件包说明
1.安装常用工具 1.1CentOS(7) 1.1.1 是否联网 ping qq.com 1.1.2 配置yum源(安装软件的软件仓库) 默认情况下yum下载软件的时候是从随机地址下载. 配置yum从 ...
- uniCloud 云开发Dome
实现账号密码登录,注册, 信息图片上传与查看 项目地址:https://gitee.com/jielov/uni-cloud_development 先创建云服务空间 与云函数 可参考 https:/ ...
- python 接口传递字符串,特殊字符url编码
from urllib.parse import quote aaa = "+xxxx" quote(aaa)
- Gson toJson 忽略 long 为 0的数据
起因于数据id过大,所以将对应int , Integer都修改为long, 测试过程中发现 Gson toJson时,字段将int为0的数据忽略,但long 没有, 所以 1. 新增适配器 impor ...
- android 反编译APK取源代码。
坑,自己写的Android APK 程序,发现线上版本是 1.9.4 ,本地的代码版本却是 1.9.1.不知道到底怎么回事,svn里面也没有日志记录.....只能从线上apk反编译来看看了,幸好这个升 ...
- 千万级别mysql 分库分表后表分页查询优化方案初探
随着使用的用户群体越来越多,表数据也会随着时间的推移,单表的数据量会越来越大. 以订单表为例,假如每天的订单量在 4 万左右,那么一个月的订单量就是 120 多万,一年就是 1400 多万,随着年数的 ...