
tsne降维可视化
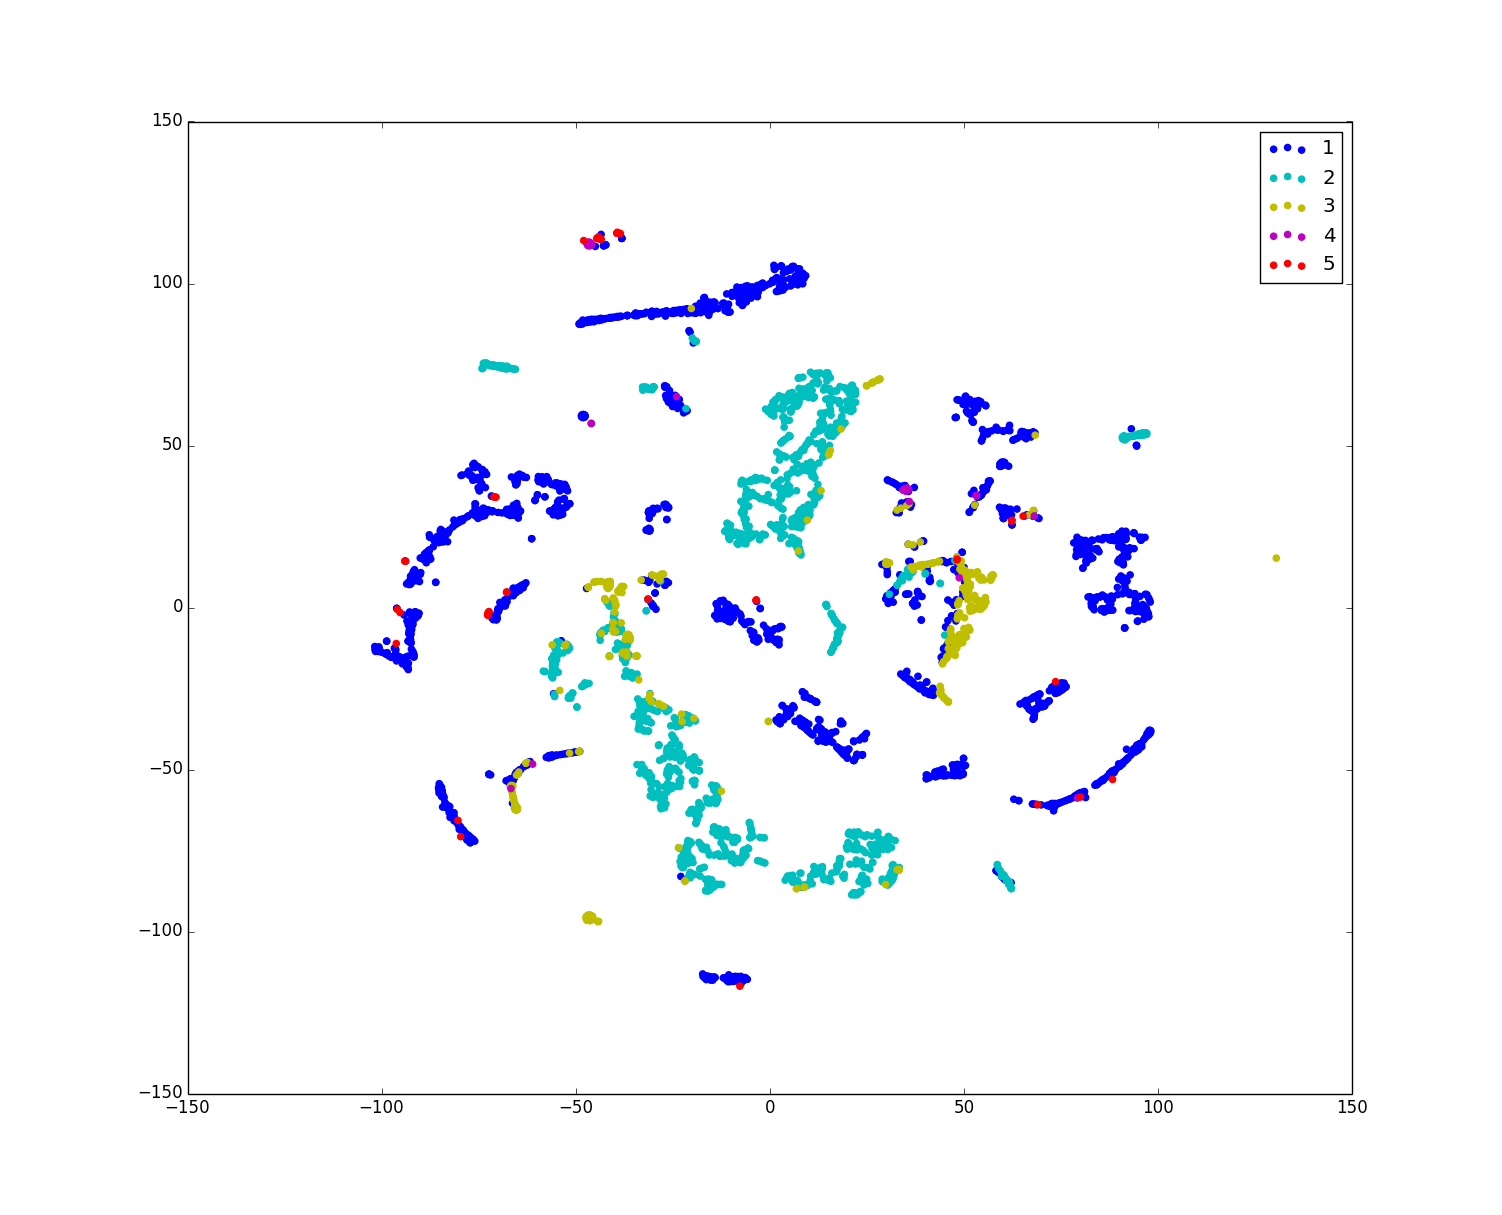
Python代码:准备训练样本的数据和标签:train_X4000.txt、train_y4000.txt 放于tsne.py当前目录.(具体t-SNE – Laurens van der Maaten http://lvdmaaten.github.io/tsne/,Python implementation),
tsne.py代码:(为了使得figure显示数据的标签,代码做了简单修改)
#!/usr/bin/env python

# -*- coding: utf-8 -*-

#

#  tsne.py

#

# Implementation of t-SNE in Python. The implementation was tested on Python 2.5.1, and it requires a working

# installation of NumPy. The implementation comes with an example on the MNIST dataset. In order to plot the

# results of this example, a working installation of matplotlib is required.

# The example can be run by executing: ipython tsne.py -pylab

#

#

#  Created by Laurens van der Maaten on 20-12-08.

#  Copyright (c) 2008 Tilburg University. All rights reserved.

import numpy as Math

import pylab as Plot

def Hbeta(D = Math.array([]), beta = 1.0):

    """Compute the perplexity and the P-row for a specific value of the precision of a Gaussian distribution."""

    # Compute P-row and corresponding perplexity

    P = Math.exp(-D.copy() * beta);

    sumP = sum(P)+1e-6;

    H = Math.log(sumP) + beta * Math.sum(D * P) / sumP;

    P = P / sumP;

    return H, P;

def x2p(X = Math.array([]), tol = 1e-5, perplexity = 30.0):

    """Performs a binary search to get P-values in such a way that each conditional Gaussian has the same perplexity."""

    # Initialize some variables

    print "Computing pairwise distances..."

    (n, d) = X.shape;

    sum_X = Math.sum(Math.square(X), 1);

    D = Math.add(Math.add(-2 * Math.dot(X, X.T), sum_X).T, sum_X);

    P = Math.zeros((n, n));

    beta = Math.ones((n, 1));

    logU = Math.log(perplexity);

    # Loop over all datapoints

    for i in range(n):

        # Print progress

        if i % 500 == 0:

            print "Computing P-values for point ", i, " of ", n, "..."

        # Compute the Gaussian kernel and entropy for the current precision

        betamin = -Math.inf;

        betamax =  Math.inf;

        Di = D[i, Math.concatenate((Math.r_[0:i], Math.r_[i+1:n]))];

        (H, thisP) = Hbeta(Di, beta[i]);

        # Evaluate whether the perplexity is within tolerance

        Hdiff = H - logU;

        tries = 0;

        while Math.abs(Hdiff) > tol and tries < 50:

            # If not, increase or decrease precision

            if Hdiff > 0:

                betamin = beta[i].copy();

                if betamax == Math.inf or betamax == -Math.inf:

                    beta[i] = beta[i] * 2;

                else:

                    beta[i] = (beta[i] + betamax) / 2;

            else:

                betamax = beta[i].copy();

                if betamin == Math.inf or betamin == -Math.inf:

                    beta[i] = beta[i] / 2;

                else:

                    beta[i] = (beta[i] + betamin) / 2;

            # Recompute the values

            (H, thisP) = Hbeta(Di, beta[i]);

            Hdiff = H - logU;

            tries = tries + 1;

        # Set the final row of P

        P[i, Math.concatenate((Math.r_[0:i], Math.r_[i+1:n]))] = thisP;

    # Return final P-matrix

        print "Mean value of sigma: ", Math.mean(Math.sqrt(1 / beta))

    return P;

def pca(X = Math.array([]), no_dims = 50):

    """Runs PCA on the NxD array X in order to reduce its dimensionality to no_dims dimensions."""

    print "Preprocessing the data using PCA..."

    (n, d) = X.shape;

    X = X - Math.tile(Math.mean(X, 0), (n, 1));

    (l, M) = Math.linalg.eig(Math.dot(X.T, X));

    Y = Math.dot(X, M[:,0:no_dims]);

    return Y;

def tsne(X = Math.array([]), no_dims = 2, initial_dims = 50, perplexity = 30.0):

    """Runs t-SNE on the dataset in the NxD array X to reduce its dimensionality to no_dims dimensions.

    The syntaxis of the function is Y = tsne.tsne(X, no_dims, perplexity), where X is an NxD NumPy array."""

    # Check inputs

    if X.dtype != "float64":

        print "Error: array X should have type float64.";

        return -1;

    #if no_dims.__class__ != "":            # doesn't work yet!

    #    print "Error: number of dimensions should be an integer.";

    #    return -1;

    # Initialize variables

    X = pca(X, initial_dims).real;

    (n, d) = X.shape;

    max_iter = 1000

    initial_momentum = 0.5;

    final_momentum = 0.8;

    eta = 500;

    min_gain = 0.01;

    Y = Math.random.randn(n, no_dims);

    dY = Math.zeros((n, no_dims));

    iY = Math.zeros((n, no_dims));

    gains = Math.ones((n, no_dims));

    # Compute P-values

    P = x2p(X, 1e-5, perplexity);

    P = P + Math.transpose(P);

    P = P / (Math.sum(P));

    P = P * 4;                                    # early exaggeration

    P = Math.maximum(P, 1e-12);

    # Run iterations

    for iter in range(max_iter):

        # Compute pairwise affinities

        sum_Y = Math.sum(Math.square(Y), 1);

        num = 1 / (1 + Math.add(Math.add(-2 * Math.dot(Y, Y.T), sum_Y).T, sum_Y));

        num[range(n), range(n)] = 0;

        Q = num / Math.sum(num);

        Q = Math.maximum(Q, 1e-12);

        # Compute gradient

        PQ = P - Q;

        for i in range(n):

            dY[i,:] = Math.sum(Math.tile(PQ[:,i] * num[:,i], (no_dims, 1)).T * (Y[i,:] - Y), 0);

        # Perform the update

        if iter < 20:

            momentum = initial_momentum

        else:

            momentum = final_momentum

        gains = (gains + 0.2) * ((dY > 0) != (iY > 0)) + (gains * 0.8) * ((dY > 0) == (iY > 0));

        gains[gains < min_gain] = min_gain;

        iY = momentum * iY - eta * (gains * dY);

        Y = Y + iY;

        Y = Y - Math.tile(Math.mean(Y, 0), (n, 1));

        # Compute current value of cost function

        if (iter + 1) % 10 == 0:

            C = Math.sum(P * Math.log(P / Q));

            print "Iteration ", (iter + 1), ": error is ", C

        # Stop lying about P-values

        if iter == 100:

            P = P / 4;

    # Return solution

    return Y;

if __name__ == "__main__":

    print "Run Y = tsne.tsne(X, no_dims, perplexity) to perform t-SNE on your dataset."

    print "Running example on 2,500 MNIST digits..."

    X = Math.loadtxt("train_X4000.txt");

#X = X[:100]

    labels = Math.loadtxt("train_y4000.txt");

#labels = labels[:100]

    Y = tsne(X, 2, 38, 20.0);

    fil = open('Y.txt','w')

    for i in Y:

        fil.write(str(i[0])+' '+str(i[1])+'\n')

    fil.close()

    colors=['b', 'c', 'y', 'm', 'r']

    idx_1 = [i1 for i1 in range(len(labels)) if labels[i1]==1]

    flg1=Plot.scatter(Y[idx_1,0], Y[idx_1,1], 20,color=colors[0],label='1');

    idx_2= [i2 for i2 in range(len(labels)) if labels[i2]==2]

    flg2=Plot.scatter(Y[idx_2,0], Y[idx_2,1], 20,color=colors[1], label='2');

    idx_3= [i3 for i3 in range(len(labels)) if labels[i3]==3]

    flg3=Plot.scatter(Y[idx_3,0], Y[idx_3,1], 20, color=colors[2],label='3');

    idx_4= [i4 for i4 in range(len(labels)) if labels[i4]==4]

    flg4=Plot.scatter(Y[idx_4,0], Y[idx_4,1], 20,color=colors[3], label='4');

    idx_5= [i5 for i5 in range(len(labels)) if labels[i5]==5]

    flg5=Plot.scatter(Y[idx_5,0], Y[idx_5,1], 20, color=colors[4],label='5');

#    flg=Plot.scatter(Y[:,0], Y[:,1], 20,labels);

    Plot.legend()

    Plot.savefig('figure4000.pdf')

    Plot.show()
tsne降维可视化的更多相关文章
- 使用t-SNE做降维可视化
最近在做一个深度学习分类项目,想看看训练集数据的分布情况,但由于数据本身维度接近100,不能直观的可视化展示,所以就对降维可视化做了一些粗略的了解以便能在低维空间中近似展示高维数据的分布情况,以下内容 ...
- 【Python代码】TSNE高维数据降维可视化工具 + python实现
目录 1.概述 1.1 什么是TSNE 1.2 TSNE原理 1.2.1入门的原理介绍 1.2.2进阶的原理介绍 1.2.2.1 高维距离表示 1.2.2.2 低维相似度表示 1.2.2.3 惩罚函数 ...
- 结合sklearn的可视化工具Yellowbrick:超参与行为的可视化带来更优秀的实现
https://blog.csdn.net/qq_34739497/article/details/80508262 Yellowbrick 是一套名为「Visualizers」的视觉诊断工具,它扩展 ...
- cs231n---卷积网络可视化,deepdream和风格迁移
本课介绍了近年来人们对理解卷积网络这个“黑盒子”所做的一些可视化工作,以及deepdream和风格迁移. 1 卷积网络可视化 1.1 可视化第一层的滤波器 我们把卷积网络的第一层滤波器权重进行可视化( ...
- Probabilistic PCA、Kernel PCA以及t-SNE
Probabilistic PCA 在之前的文章PCA与LDA介绍中介绍了PCA的基本原理,这一部分主要在此基础上进行扩展,在PCA中引入概率的元素,具体思路是对每个数据$\vec{x}_i$,假设$ ...
- 用scikit-learn研究局部线性嵌入(LLE)
在局部线性嵌入(LLE)原理总结中,我们对流形学习中的局部线性嵌入(LLE)算法做了原理总结.这里我们就对scikit-learn中流形学习的一些算法做一个介绍,并着重对其中LLE算法的使用方法做一个 ...
- ISOMAP
转载 https://blog.csdn.net/dark_scope/article/details/53229427# 维度打击,机器学习中的降维算法:ISOMAP & MDS 降维是机器 ...
- Python—kmeans算法学习笔记
一. 什么是聚类 聚类简单的说就是要把一个文档集合根据文档的相似性把文档分成若干类,但是究竟分成多少类,这个要取决于文档集合里文档自身的性质.下面这个图就是一个简单的例子,我们可以把不同的文档聚合 ...
- Self-organizing Maps及其改进算法Neural gas聚类在异常进程事件识别可行性初探
catalogue . SOM简介 . SOM模型在应用中的设计细节 . SOM功能分析 . Self-Organizing Maps with TensorFlow . SOM在异常进程事件中自动分 ...
随机推荐
- Java开发中经典的小实例-(while(参数){})
import java.util.Scanner;public class Test_while { public static void main(String[] args) { ...
- uva 10065 (凸包+求面积)
链接:http://uva.onlinejudge.org/index.php?option=com_onlinejudge&Itemid=8&page=show_problem&am ...
- 序列的方法(str,list,tuple)
作者:Vamei 出处:http://www.cnblogs.com/vamei 欢迎转载,也请保留这段声明.谢谢! 在快速教程中,我们了解了最基本的序列(sequence).回忆一下,序列包含有定值 ...
- FormsAuthentication.HashPasswordForStoringInConfigFile 方法 之研究
摘自:http://time-is-life.cnblogs.com/articles/322523.html 给定标识哈希类型的密码和字符串,该例程产生一个适合存储在配置文件中的哈希密码. [C#] ...
- iOS - UIWindow
前言 NS_CLASS_AVAILABLE_IOS(2_0) @interface UIWindow : UIView @available(iOS 2.0, *) public class UIWi ...
- git各种撤销操作
撤销git add: git reset HEAD+路径 或者git reset --+路径 撤销commit: 1.回退到具体的嘻哈值 git reset --hard 2.回退后仍包含本地 ...
- Oracle一列的多行数据拼成一行显示字符
Oracle一列的多行数据拼成一行显示字符 oracle 提供了两个函数WMSYS.WM_CONCAT 和 ListAgg函数. www.2cto.com 先介绍:WMSYS.WM_CO ...
- 在 Windows XP 下查看所有卷标信息
http://support.hp.com/cn-zh/document/c01270024 点击“开始”,在“开始搜索”中输入:diskpart,然后按键盘“回车”键. 在“命令行窗口”中,等待“D ...
- numpy库的常用知识
为什么有numpy这个库呢?准安装的Python中用列表(list)保存一组值,可以用来当作数组使用,不过由于列表的元素可以是任何对象,因此列表中所保存的是对象的指针.这样为了保存一个简单的[1,2, ...
- (十)Linux内核中的常用宏container_of
Container_of在Linux内核中是一个常用的宏,用于从包含在某个结构中的指针获得结构本身的指针,通俗地讲就是通过结构体变量中某个成员的首地址进而获得整个结构体变量的首地址. Containe ...