
日志监控平台搭建(Loki+promtail+grafana)
搭建Loki+promtail+grafana日志监控平台,可以直接在grafana的UI界面查看系统应用日志,使日志查看起来更方便、快捷。
Loki:主服务器,负责存储日志和处理查询。
Promtail:代理,负责收集日志并将其发送给Loki。
Grafana:用于查询和显示日志。
1. 离线获取安装文件
适用于内网服务器,无法访问互联网,获取安装文件后上传至服务器指定目录。
1.1 方式一:下载
Loki的GitHub地址:https://github.com/grafana/loki

配置文件官网地址:https://grafana.com/docs/loki/latest/installation/local/

Grafana下载官网:https://grafana.com/grafana/download
1.2 方式二:网盘获取
loki、promtail应用及配置文件网盘链接:https://pan.baidu.com/s/1VKw4u329nIsfKARGVa9nvg 提取码:yplj
2. 日志平台搭建
2.1 loki安装
2.1.1 下载文件
#创建目录
mkdir -p /opt/loki
#下载压缩文件
cd /opt/loki
curl -O -L https://github.com/grafana/loki/releases/download/v2.0.0/loki-linux-amd64.zip
#下载配置文件
wget --no-check-certificate https://raw.githubusercontent.com/grafana/loki/master/cmd/loki/loki-local-config.yaml
#解压文件
unzip loki-linux-amd64.zip
#执行文件授权
chmod a+x loki-linux-amd64
2.1.2 修改配置文件(loki-local-config.yaml)
配置如下:
auth_enabled: false

server:

  http_listen_port: 3100   #如是云服务需打开3100端口

  grpc_listen_port: 9096

common:

  path_prefix: /opt/loki

  storage:

    filesystem:

      chunks_directory: /opt/loki/chunks

      rules_directory: /opt/loki/rules

  replication_factor: 1

  ring:

    instance_addr: 127.0.0.1   #loki访问路径,可不做修改

    kvstore:

      store: inmemory

#query_range:

  #results_cache:

    #cache:

      #embedded_cache: false

        #enabled: false

        #distributed: false

        #max_size_mb: 100

schema_config:

  configs:

    - from: 2020-10-24

      store: boltdb-shipper

      object_store: filesystem

      schema: v11

      index:

        prefix: index_

        period: 24h

limits_config:

  enforce_metric_name: false

  reject_old_samples: true          # 是否拒绝老样本

  reject_old_samples_max_age: 336h  # 336小时之前的样本将会被删除

  ingestion_rate_mb: 32             # 每秒允许promtail传输32MB,默认为4

  ingestion_burst_size_mb: 64

  per_stream_rate_limit: 1000MB

  max_entries_limit_per_query: 10000

chunk_store_config:

  max_look_back_period: 336h        # 为避免查询超过保留期的数据,必须小于或等于下方的时间值

table_manager:

  retention_deletes_enabled: true   # 保留删除开启

  retention_period: 336h            # 超过336h的块数据将被删除

ruler:

  alertmanager_url: http://localhost:9093

# By default, Loki will send anonymous, but uniquely-identifiable usage and configuration

# analytics to Grafana Labs. These statistics are sent to https://stats.grafana.org/

#

# Statistics help us better understand how Loki is used, and they show us performance

# levels for most users. This helps us prioritize features and documentation.

# For more information on what's sent, look at

# https://github.com/grafana/loki/blob/main/pkg/usagestats/stats.go

# Refer to the buildReport method to see what goes into a report.

#

# If you would like to disable reporting, uncomment the following lines:

#analytics:

#  reporting_enabled: false
2.1.3 启动loki服务
# 启动Loki命令  默认端口为 3100

nohup ./loki-linux-amd64 -config.file=loki-local-config.yaml  > loki.log 2>&1 &
2.2 promtail安装
2.2.1 下载文件
#创建目录
mkdir -p /opt/promtail
#下载压缩文件
cd /opt/promtail
curl -O -L https://github.com/grafana/loki/releases/download/v2.0.0/promtail-linux-amd64.zip
#下载配置文件
wget --no-check-certificate https://raw.githubusercontent.com/grafana/loki/master/clients/cmd/promtail/promtail-local-config.yaml
#解压文件
unzip promtail-linux-amd64.zip
#执行文件授权
chmod a+x promtail-linux-amd64
2.2.2 修改配置文件(promtail-local-config.yaml)
修改 clients, 将host改为loki服务器地址 ; 添加 scrape_configs 对应的 labels 进行日志收集。
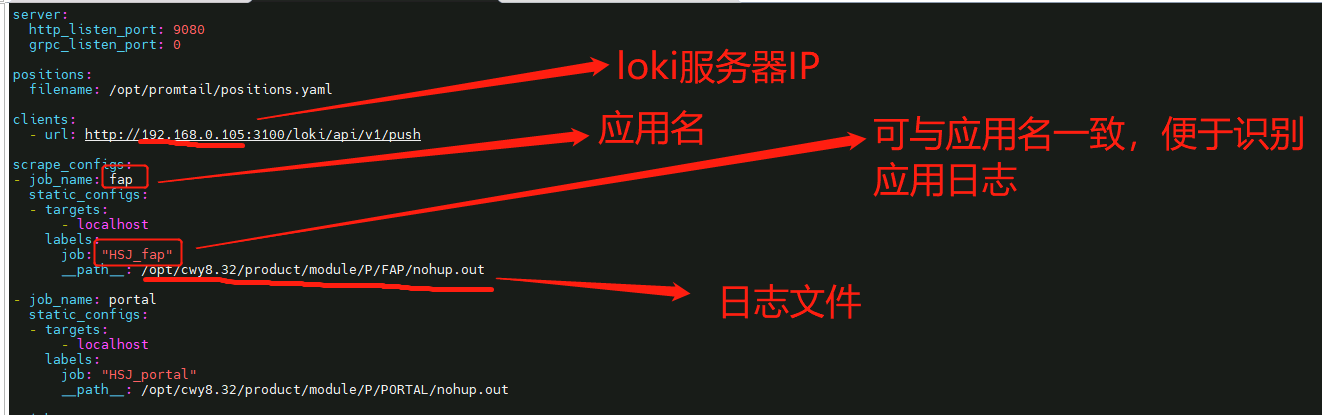
配置如下,涉及到7个应用的日志查看:
server:

  http_listen_port: 9080  #云服务器需开放9080端口

  grpc_listen_port: 0

positions:

  filename: /opt/promtail/positions.yaml   #positions存放路径在promtail工具地址下

clients:

  - url: http://192.168.0.105:3100/loki/api/v1/push    #修改为loki服务器IP

scrape_configs:

- job_name: fap

  static_configs:

  - targets:

      - localhost

    labels:

      job: "HSJ_fap"

      __path__: /opt/cwy8.32/product/module/P/FAP/nohup.out

- job_name: portal

  static_configs:

  - targets:

      - localhost

    labels:

      job: "HSJ_portal"

      __path__: /opt/cwy8.32/product/module/P/PORTAL/nohup.out

- job_name: cwy

  static_configs:

  - targets:

      - localhost

    labels:

      job: "HSJ_cwy"

      __path__: /opt/cwy8.32/product/module/A/CWY/nohup.out

- job_name: fasp_register

  static_configs:

  - targets:

      - localhost

    labels:

      job: "HSJ_fasp_register"

      __path__: /opt/cwy8.32/product/module/A/FASP/register-nohup.out

- job_name: fasp_gateway

  static_configs:

  - targets:

      - localhost

    labels:

      job: "HSJ_fasp_gateway"

      __path__: /opt/cwy8.32/product/module/A/FASP/gateway-nohup.out

- job_name: fasp_base

  static_configs:

  - targets:

      - localhost

    labels:

      job: "HSJ_fasp_base"

      __path__: /opt/cwy8.32/product/module/A/FASP/base-nohup.out

- job_name: fasp_web

  static_configs:

  - targets:

      - localhost

    labels:

      job: "HSJ_fasp_web"

      __path__: /opt/cwy8.32/product/module/A/FASP/web-nohup.out
2.2.3 启动promtail服务
#启动Promtail命令,默认端口是9080

nohup ./promtail-linux-amd64 -config.file=promtail-local-config.yaml > promtail.log 2>&1 &
2.3 配置grafana
2.3.1 添加loki数据源
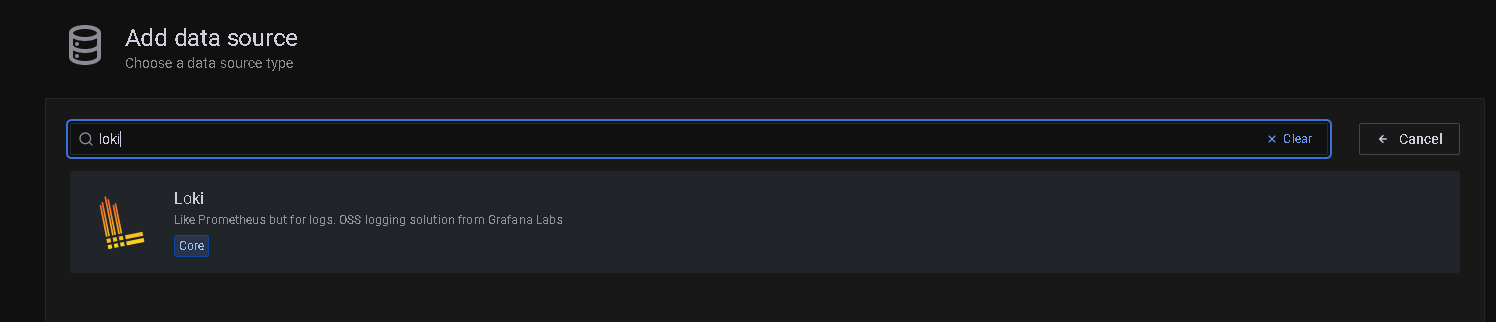
登入grafana,点击【设置】按钮,进入【Configuration】页面;点击右侧的【add data source】添加loki数据源
2.3.2 配置数据源url
点击loki数据源,配置url地址(loki服务所在服务器的IP地址,端口默认3100),随后点击【save&test】

2.3.3 选择日志查看选项
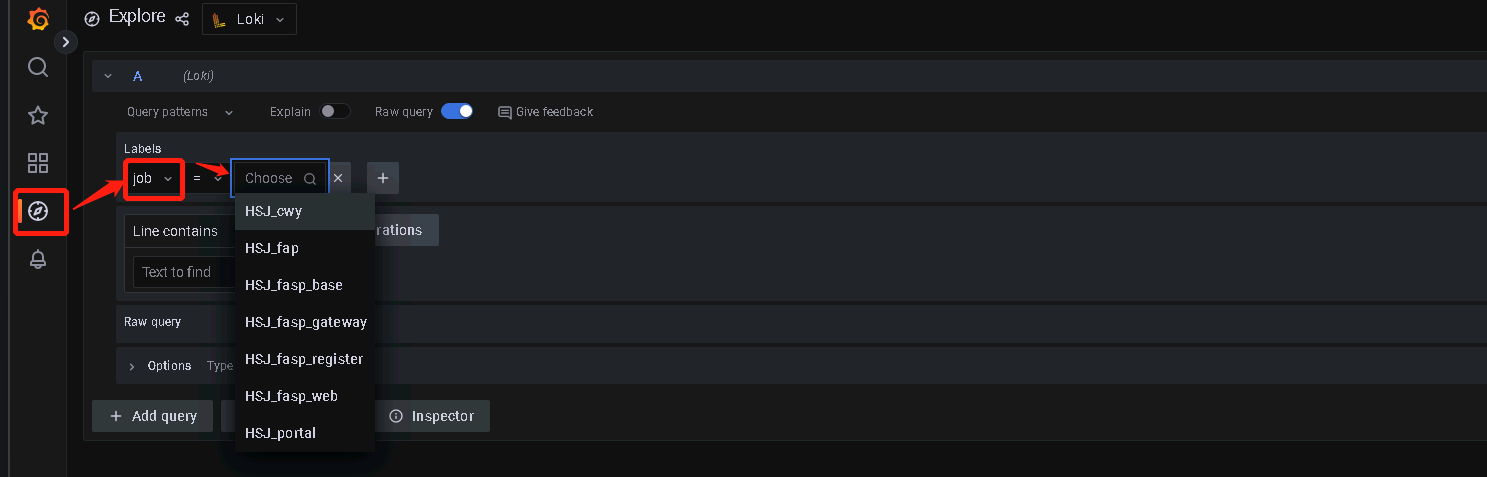
点击Explore,在Explore界面选择【job】,下一步可以选择需要查看的应用日志,如下显示:
2.3.4 查看日志示例:
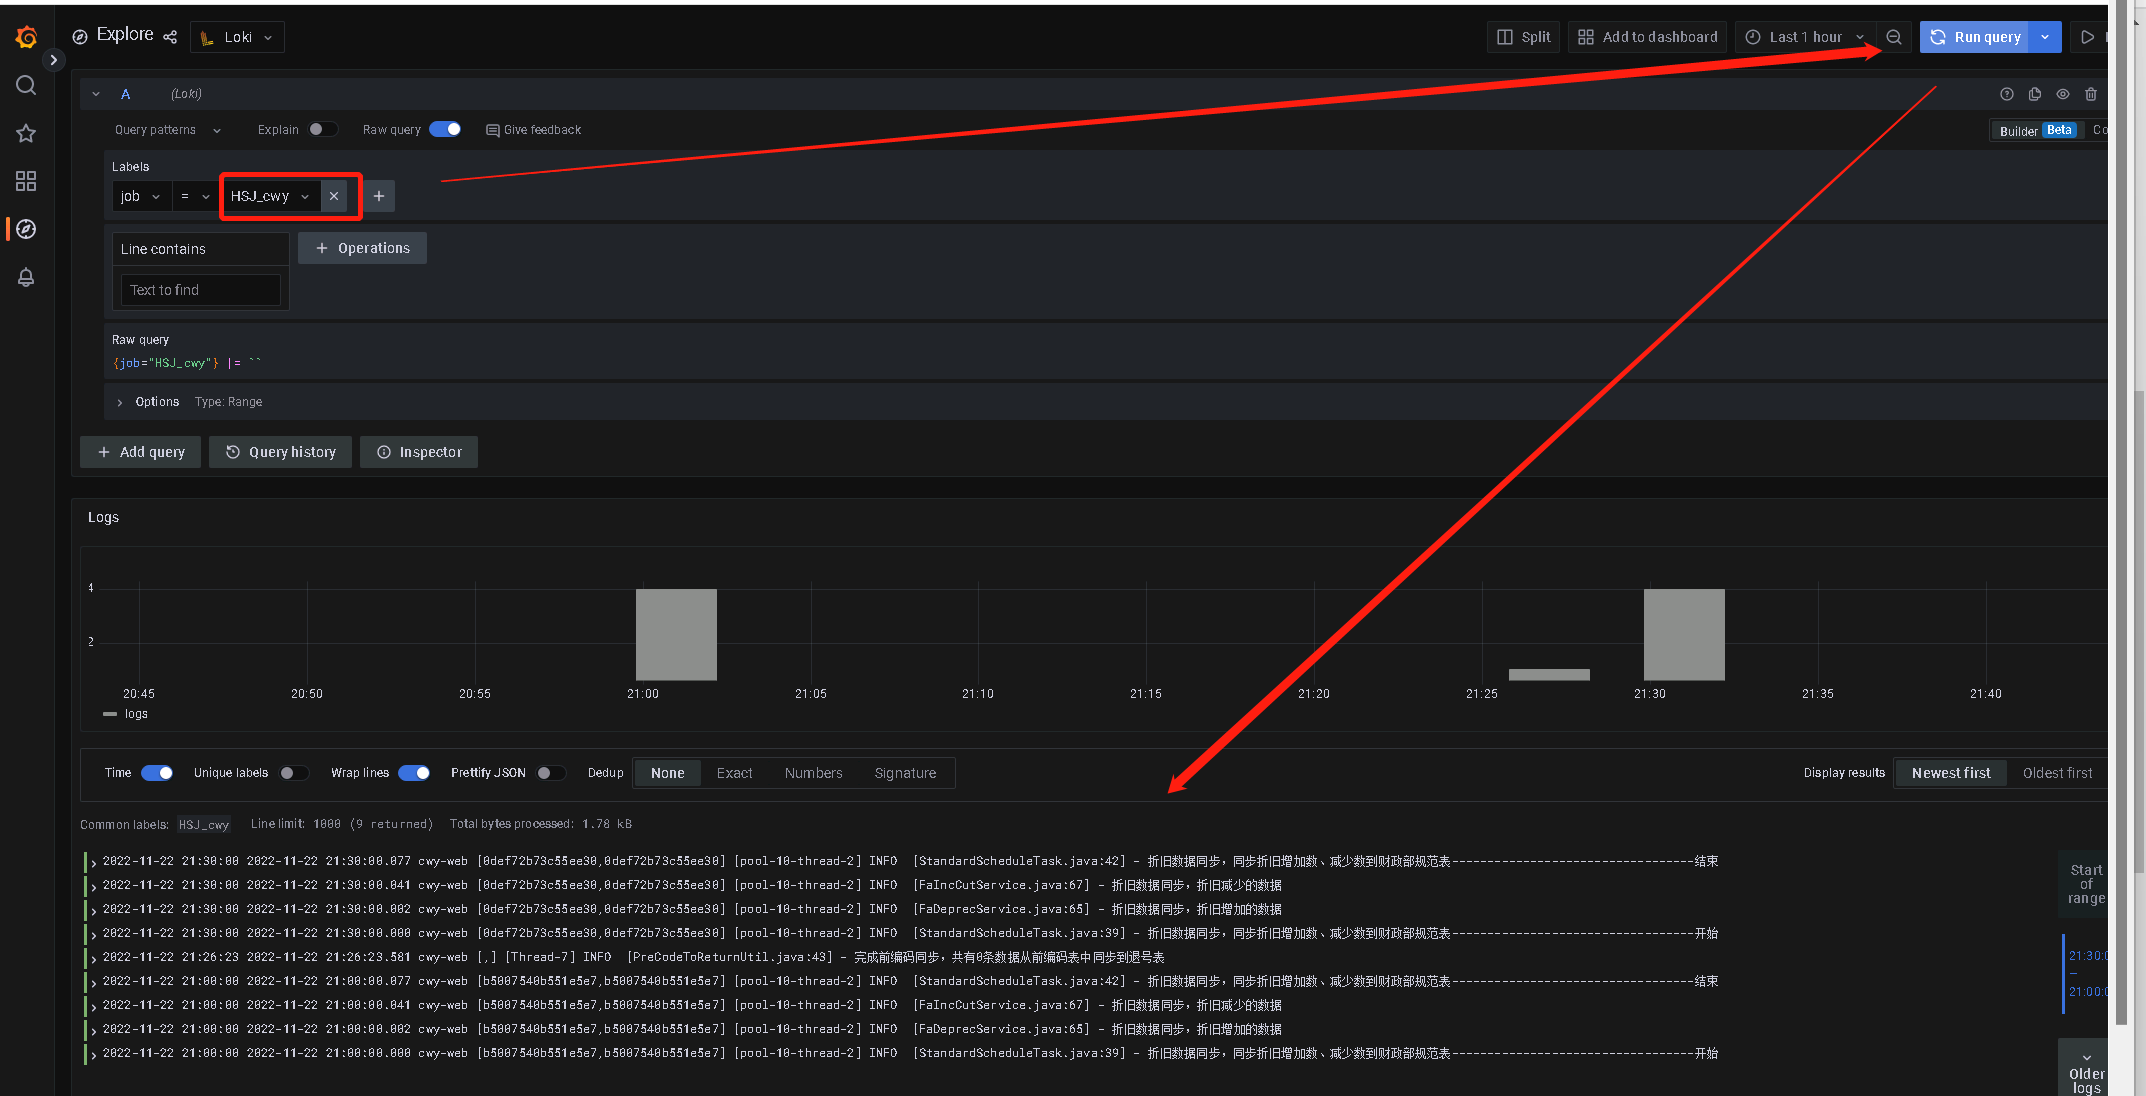
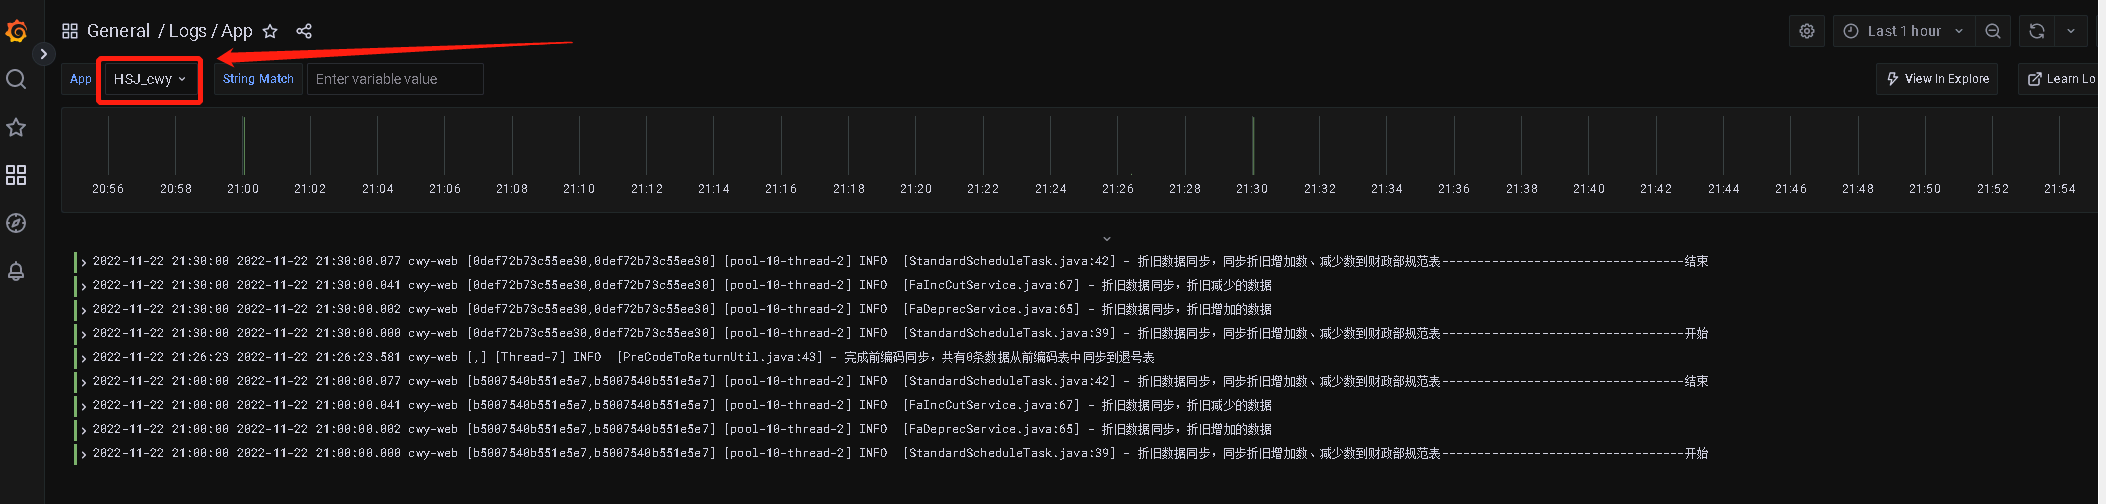
选择HSJ_cwy,再点击右上角【Run query】,即可查看HSJ_cwy应用的日志信息,如下:
3. 导入loki日志查看仪表板(便于查看日志)
点击grafana左侧菜单栏【+】-【import】,进入导入dashboard页面
导入“下载的仪表板”和“创建的数据源”,点击【import】按钮,导入成功
loki仪表板链接:https://pan.baidu.com/s/19Jm1_k029wZj1iDP-MtDGg 提取码:de09
END
日志监控平台搭建(Loki+promtail+grafana)的更多相关文章
- 【Docker】性能测试监控平台搭建:InfluxDB+Grafana+Jmeter+cAdvisor
前言 在做性能测试时,如果有一个性能测试结果实时展示的页面,可以极大的提高我们对系统性能表现的掌握程度,进而提高我们的测试效率.但是我们每次打开Jmeter都会有几个硕大的字提示别用GUI模式进行负载 ...
- Docker系列——InfluxDB+Grafana+Jmeter性能监控平台搭建(三)
在之前系列博文中,已经介绍完了数据采集和数据存储,那数据如何展示呢?所以今天就专门来讲下数据如何展示的问题. 以前博文参考: Docker系列--InfluxDB+Grafana+Jmeter性能监控 ...
- ElasticSearch实战-日志监控平台
1.概述 在项目业务倍增的情况下,查询效率受到影响,这里我们经过讨论,引进了分布式搜索套件——ElasticSearch,通过分布式搜索来解决当下业务上存在的问题.下面给大家列出今天分析的目录: El ...
- ELK日志监控平台安装部署简介--Elasticsearch安装部署
最近由于工作需要,需要搭建一个ELK日志监控平台,本次采用Filebeat(采集数据)+Elasticsearch(建立索引)+Kibana(展示)架构,实现日志搜索展示功能. 一.安装环境描述: 1 ...
- inux监控平台搭建-监控项
linux监控平台搭建-监控项 本人运维某生态互联网监控平台服务.过程中遇见了很多问题.目前互联网有很多的开源监控工具:nagios.zabbix.falcon.cacti...各有优点.这里不讲解监 ...
- 基础架构之日志管理平台搭建及java&net使用
在现代化的软件开发流程中,日志显得非常的重要,不可能再零散的游离在各个项目中,等查看日志的时候再登录服务器去到特定的目录去查看,这显然很繁琐且效率低下,所有整合一套日志管理平台,也显得非常重要,这篇文 ...
- linux监控平台搭建-cpu
linux监控平台搭建-cpu 目前服务器的主流CPU是intel或者AMD.到底主频是什么.多核.多线程.并发.并行.超频.一级缓存.二级缓存.三级缓存.i386.x86 cpu:含有算术逻辑.控制 ...
- linux监控平台搭建-内存
linux监控平台搭建-内存 上一篇文章说的硬盘.就写一下.更加重要的东西.在手机上面是RAM.机器是memory.内存是按照字节编址.每个地址的存储单元可以存放8bit的数据.cpu 通过内存地址获 ...
- linux监控平台搭建-磁盘
linux监控平台搭建-磁盘 磁盘:随着大数据快速发展.人工智能.自动化.云平台.数据量指数的增长.磁盘的使用量也在增长.目前的机器基本上采用SSD或者SATA盘,一直有人比较那个好.会不会使用时间短 ...
- FILEBEAT+ELK日志收集平台搭建流程
filebeat+elk日志收集平台搭建流程 1. 整体简介: 模式:单机 平台:Linux - centos - 7 ELK:elasticsearch.logstash.kiban ...
随机推荐
- docker安装go-fastdfs
1.docker命令安装 docker run -d --name fastdfs -p 8180:8080 sjqzhang/go-fastdfs 2.浏览器访问 http://192.168.20 ...
- Django的ModelAdmin自带
需要自定义数据表中哪些字段可以显示,哪些字段可以编辑,并对数据表中的条目进行排序,同时定义过滤选项.Django的ModelAdmin自带的list_display, list_filter, lis ...
- c3p0的配置及简单应用
首先简单了解一下JDBC和c3p0 Java数据库连接,(Java Database Connectivity,简称JDBC)是Java语言中用来规范客户端程序如何来访问数据库的应用程序接口,提供了诸 ...
- flutter填坑之旅(flutter页面生命周期篇)
一.初始化时期 1.createState ///构建一个StatefulWidget时,会立即调用该方法(必须重写) @override _WidgetLifecycleState createSt ...
- 创建nodejs项目并接入mysql,完成用户相关的增删改查的详细操作
本文为博主原创,转载请注明出处: 1.使用npm进行初始化 在本地创建项目的文件夹名称,如 node_test,并在该文件夹下进行黑窗口执行初始化命令 2. 安装 expres包和myslq依赖包 n ...
- Sublime Text Windows/Linux平台快捷键
编辑 按键 对应命令 Ctrl + X 删除行 Ctrl + 行后插入 Ctrl + ⇧ + 行前插入 Ctrl + ⇧ + ↑ 上移文本/选择 Ctrl + ⇧ + ↓ 下移文本/选择 Ctrl + ...
- 图解三代测序(SMRT Sequencing)
目前主流三代测序平台除了Oxford 家的 Nanopore,还有 Pacific Biosciences(简称 PacBio)公司的 Single Molecule Real-Time(SMRT)S ...
- 哈希工具john
john:一种极其强大且适应性强的哈希破解工具 爆破字典使用臭名昭著的 rockyou.txt 词表--这是一个非常大的常用密码词表 使用的工具 字典:rockyou.txt 哈希识别工具:hash- ...
- 【leetcode】#647 回文子串 Rust Solution
给定一个字符串,你的任务是计算这个字符串中有多少个回文子串.具有不同开始位置或结束位置的子串,即使是由相同的字符组成,也会被视作不同的子串. 示例 1:输入:"abc"输出:3解释 ...
- Helm实战案例一:在Kubernetes上使用Helm搭建Prometheus Operator监控
目录 一.系统环境 二.前言 三.Prometheus Operator简介 四.helm安装prometheus-operator 五.配置prometheus-operator 5.1 修改gra ...