
[转帖]Promethues + Grafana + AlertManager使用总结
Prometheus是一个开源监控报警系统和时序列数据库,通常会使用Grafana来美化数据展示。
1|01. 监控系统基础架
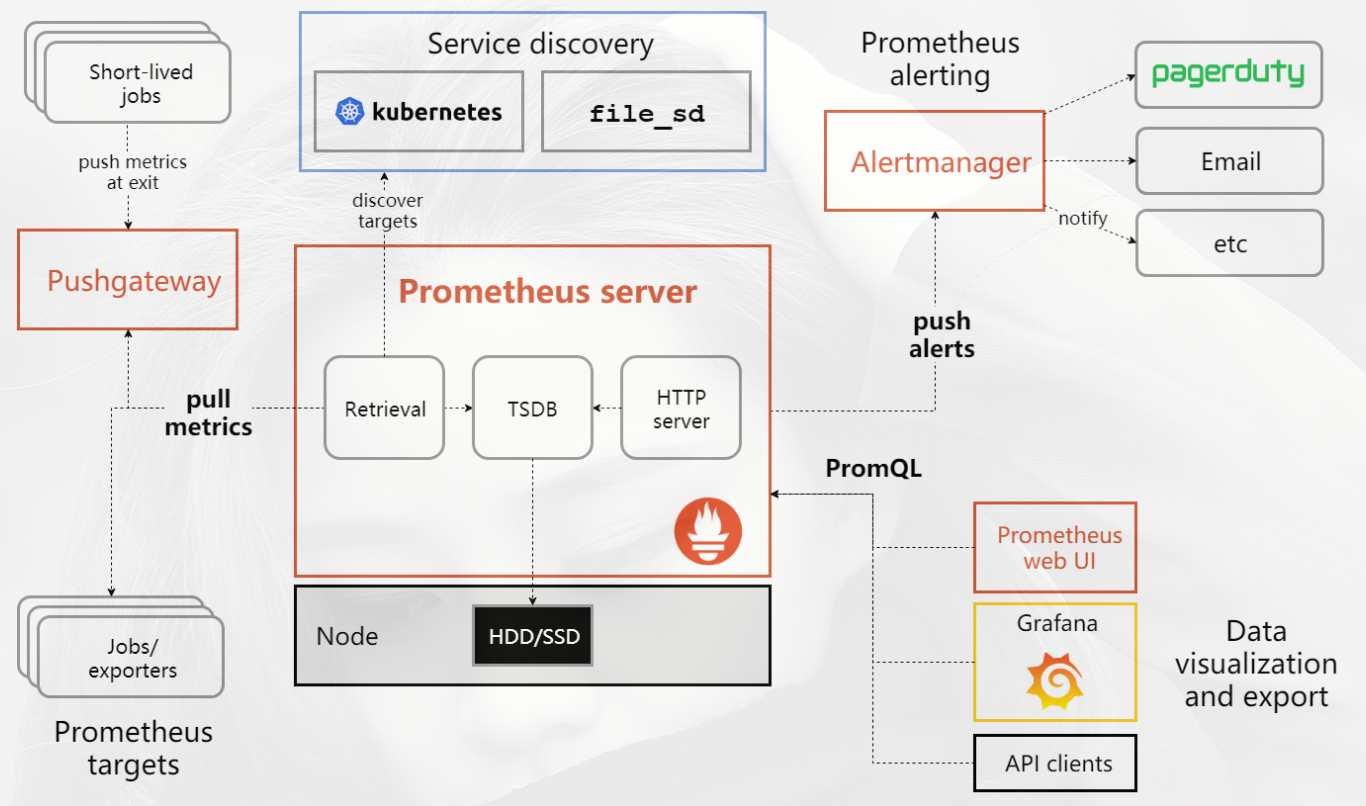
1|11.1核心组件
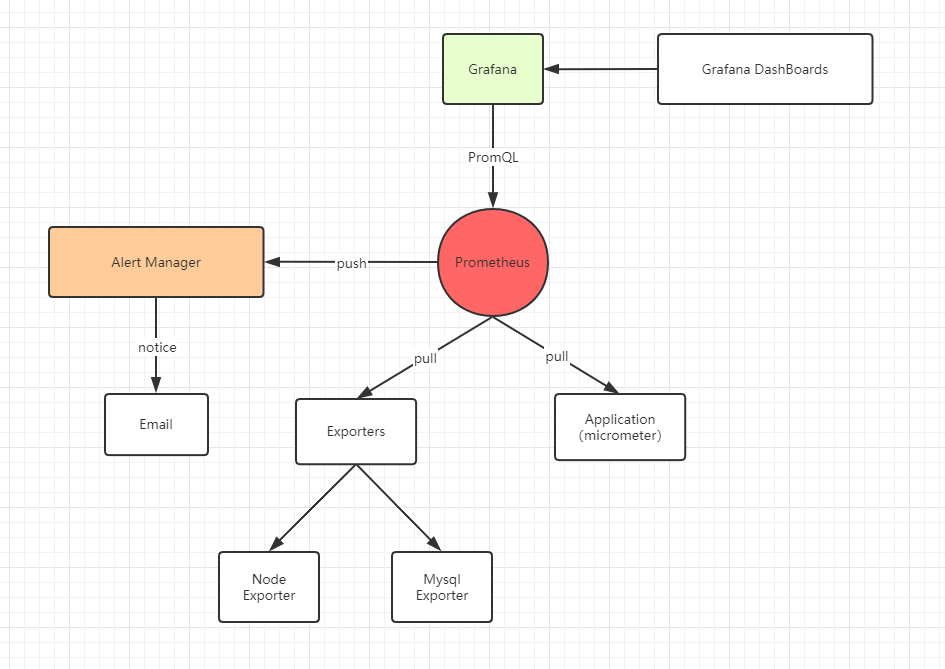
- Prometheus Server, 主要用于抓取数据和存储时序数据,另外还提供查询和 Alert Rule 配置管理。
- exporters ,数据采样器,例如采集机器数据的node_exporter,采集MongoDB 信息的 MongoDB exporter 等等。
- alertmanager ,用于告警通知管理。
- Grafana ,监控数据图表化展示模块。
2|02. 基础组件安装
由于是学习研究使用,这里通过docker快速安装环境。
2|12.1 安装Node Exporter
docker-compose-node-export.yml
version: '3' services: node-exporter: image: prom/node-exporter container_name: node-exporter hostname: node-exporter restart: always ports: - "9100:9100"
2|22.2 安装Alert Manager
docker-compose-alertmanager.yml
version: '3' services: alertmanager: image: prom/alertmanager container_name: alertmanager hostname: alertmanager restart: always volumes: - /data/docker_file/monitor/conf/alertmanager.yml:/etc/alertmanager/alertmanager.yml ports: - "9093:9093"alertmanager.yml
global: smtp_smarthost: 'smtp.qq.com:25' #QQ服务器 smtp_from: '793272861@qq.com' #发邮件的邮箱 smtp_auth_username: '793272861@qq.com' #发邮件的邮箱用户名,也就是你的邮箱 smtp_auth_password: '****************' #发邮件的邮箱密码 smtp_require_tls: false #不进行tls验证 route: group_by: ['alertname'] group_wait: 10s group_interval: 10s repeat_interval: 10m receiver: live-monitoring receivers: - name: 'live-monitoring' email_configs: - to: '793272861@qq.com' #收邮件的邮箱
2|32.3 安装Prometheus
docker-compose-prometheus.yml
version: '3' services: prometheus: image: prom/prometheus container_name: prometheus hostname: prometheus restart: always volumes: - /data/docker_file/prometheus/data:/prometheus - /data/docker_file/prometheus/conf/prometheus.yml:/etc/prometheus/prometheus.yml ports: - "9090:9090"-
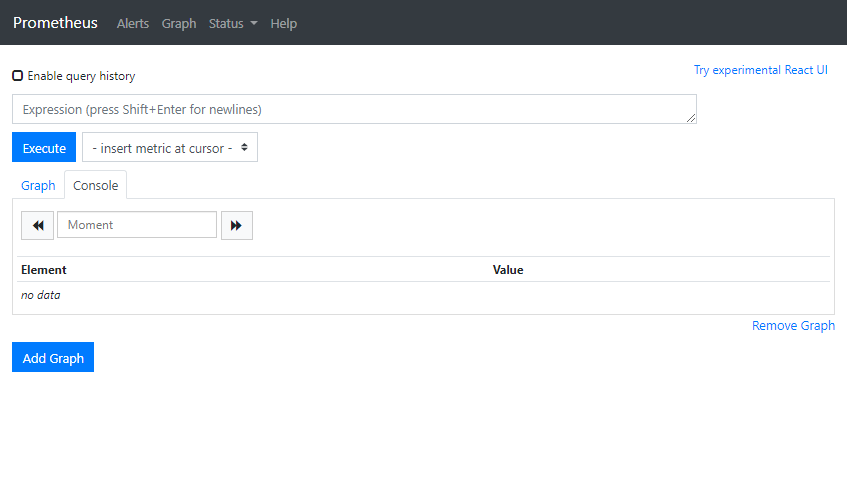
# my global config global: scrape_interval: 15s # Set the scrape interval to every 15 seconds. Default is every 1 minute. evaluation_interval: 15s # Evaluate rules every 15 seconds. The default is every 1 minute. # scrape_timeout is set to the global default (10s). # Alertmanager configuration alerting: alertmanagers: - static_configs: - targets: ['alertmanager:9093'] # Load rules once and periodically evaluate them according to the global 'evaluation_interval'. rule_files: # - "first_rules.yml" # - "second_rules.yml" # A scrape configuration containing exactly one endpoint to scrape: # Here it's Prometheus itself. # 配置定时任务,轮询拉取监控数据 scrape_configs: - job_name: 'prometheus' static_configs: - targets: ['prometheus:9090'] - job_name: 'node-exporter' scrape_interval: 5s static_configs: - targets: ['node-exporter:9100']
-
2|42.4 安装Grafana
docker-compose-grafana.yml
version: '3' services: grafana: image: grafana/grafana container_name: grafana hostname: grafana restart: always environment: - GF_SECURITY_ADMIN_PASSWORD=admin volumes: - /data/docker_file/grafana/data:/var/lib/grafana - /data/docker_file/grafana/log:/var/log/grafana ports: - "3000:3000"添加数据源(Prometheus)

访问:http://localhost:30000/ , 默认用户名:admin,密码:admin
2|52.5 Docker-Compose脚本
version: '3' services: prometheus: image: prom/prometheus container_name: prometheus hostname: prometheus restart: always volumes: - /data/docker_file/prometheus/data:/prometheus - /data/docker_file/prometheus/conf/prometheus.yml:/etc/prometheus/prometheus.yml ports: - "9090:9090" networks: - monitor alertmanager: image: prom/alertmanager container_name: alertmanager hostname: alertmanager restart: always volumes: - /data/docker_file/monitor/conf/alertmanager.yml:/etc/alertmanager/alertmanager.yml ports: - "9093:9093" networks: - monitor grafana: image: grafana/grafana container_name: grafana hostname: grafana restart: always environment: - GF_SECURITY_ADMIN_PASSWORD=admin volumes: - /data/docker_file/grafana/data:/var/lib/grafana - /data/docker_file/grafana/log:/var/log/grafana ports: - "3000:3000" networks: - monitor node-exporter: image: prom/node-exporter container_name: node-exporter hostname: node-exporter restart: always ports: - "9100:9100" networks: - monitor networks: monitor: driver: bridge3|03. 配置Grafana DashBoard
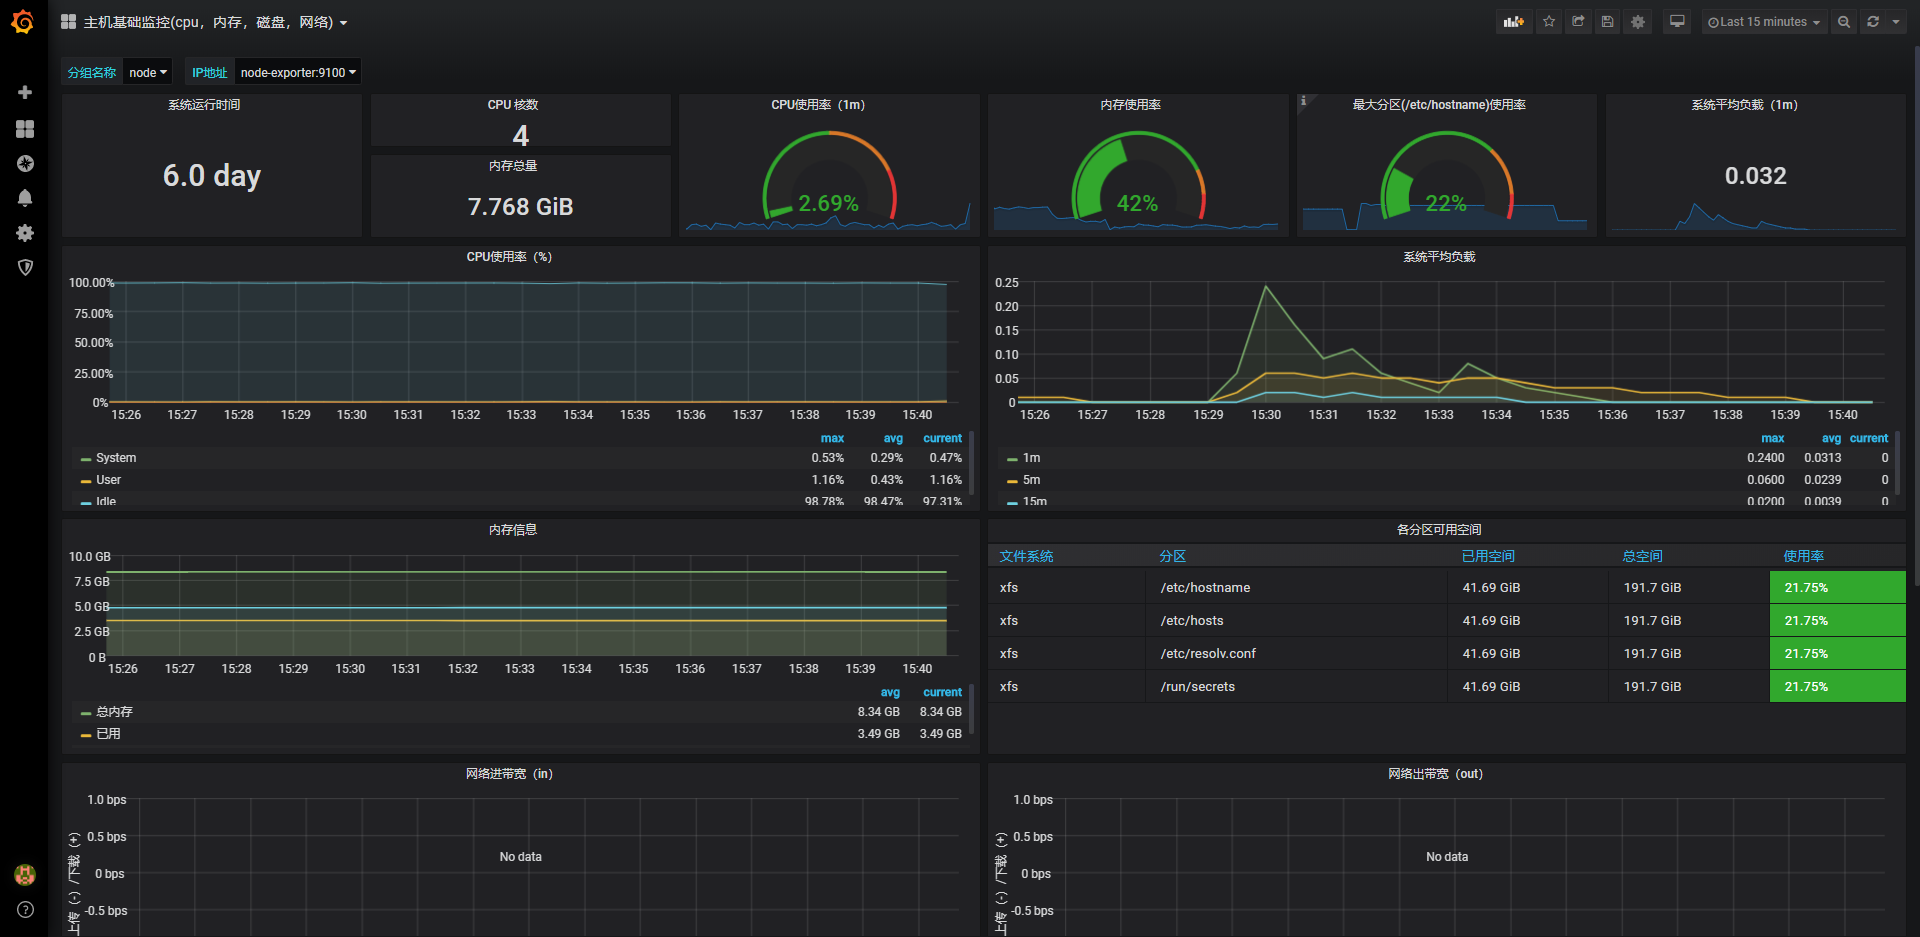
Grafana通过PromQL查询语句从Prometheus拉取数据,并有Pannel进行渲染,一个个Grafana Pannel 组成一个Grafana DashBoard。
3|13.1下载Grafana DashBoard文件
可以从官网下载已经写好的Grafana DashBoard文件,导入到我们Grafana系统就可以直接使用。
推荐的Grafana DashBoard
- JVM (Micrometer)
- Spring Boot 2.1 Statistics
- 主机基础监控(cpu,内存,磁盘,网络)
- Node Exporter for Prometheus Dashboard CN
- Druid Connection Pool Dashboard
导入Grafana DashBoard

3|23.2 添加修改Grafana Panel(扩展)
官方自带的Spring Boot 2.1 Statistics Dashboard没有展示第三方请求的数据报表,我们以此为例,添加第三方请求的Client Request Count报表和Client Response Time报表。
Client Request Count
irate(http_client_requests_seconds_count{instance="$instance", application="$application", uri!~".*actuator.*"}[5m])
注意:应用中的Meter的名称必须为http.client.requests
Client Response Time
irate(http_client_requests_seconds_sum{instance="$instance", application="$application",uri!~".*actuator.*"}[5m]) / irate(http_client_requests_seconds_count{instance="$instance", application="$application",uri!~".*actuator.*"}[5m])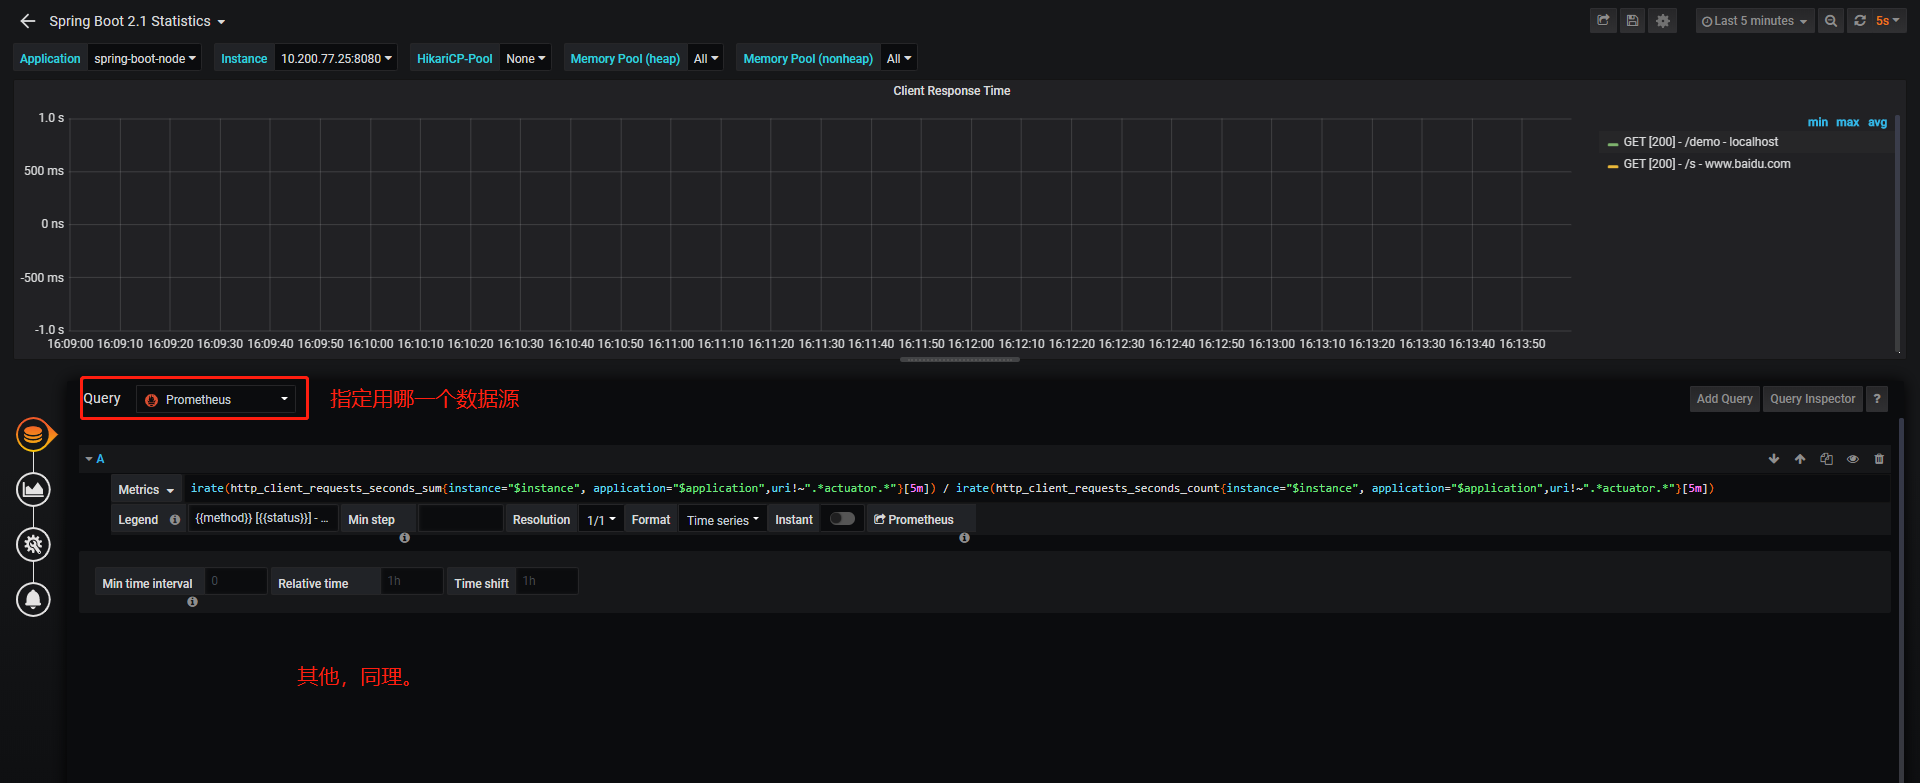
4|04. Spring Boot 集成Micrometer
Metrics(译:指标,度量)
Micrometer提供了与供应商无关的接口,包括 timers(计时器), gauges(量规), counters(计数器), distribution summaries(分布式摘要), long task timers(长任务定时器)。它具有维度数据模型,当与维度监视系统结合使用时,可以高效地访问特定的命名度量,并能够跨维度深入研究。
4|14.1 引入依赖
<dependency> <groupId>io.micrometer</groupId> <artifactId>micrometer-registry-prometheus</artifactId> <version>${micrometer.version}</version> </dependency> <dependency> <groupId>org.springframework.boot</groupId> <artifactId>spring-boot-starter-actuator</artifactId> </dependency>4|24.2 开启Prometheus功能
spring: application: name: spring-boot-node management: metrics: # 1.添加全局的tags,后面可以作为变量搜索数据 tags: application: ${spring.application.name} endpoints: web: exposure: # 2.打开prometheus端点功能 include: 'health,prometheus'4|34.3 实现第三方请求的监控
基于
OkHttpMetricsEventListener可以有好的对OkHttp Client的请求进行监控。配置OkHttp Client事件监听
@Bean("okHttpClient") public OkHttpClient okHttpClient(ConnectionPool connectionPool) { return new OkHttpClient().newBuilder().connectionPool(connectionPool) .connectTimeout(5, TimeUnit.SECONDS) .readTimeout(10, TimeUnit.SECONDS) .eventListener(eventListener()) .build(); } /** * 事件监听器 OkHttpMetricsEventListener * metricsProperties.getWeb().getClient().getRequestsMetricName() equals 'http.client.request',可称为度量。 * @return */ private EventListener eventListener(){ return OkHttpMetricsEventListener.builder( meterRegistry, metricsProperties.getWeb().getClient().getRequestsMetricName()) .build(); }原理:OkHttpMetricsEventListener.java
public class OkHttpMetricsEventListener extends EventListener { /** * Header name for URI patterns which will be used for tag values. */ public static final String URI_PATTERN = "URI_PATTERN"; @Override public void callFailed(Call call, IOException e) { CallState state = callState.remove(call); if (state != null) { state.exception = e; // 请求完成时,注册监控数据 time(state); } } @Override public void responseHeadersEnd(Call call, Response response) { CallState state = callState.remove(call); if (state != null) { state.response = response; // 请求完成时,注册监控数据 time(state); } } private void time(CallState state) { String uri = state.response == null ? "UNKNOWN" : (state.response.code() == 404 || state.response.code() == 301 ? "NOT_FOUND" : urlMapper.apply(state.request)); // 定义一些Tag或者是变量,在Prometheus和Grafana中可以使用 Iterable<Tag> tags = Tags.concat(extraTags, Tags.of( "method", state.request != null ? state.request.method() : "UNKNOWN", "uri", uri, "status", getStatusMessage(state.response, state.exception), "host", state.request != null ? state.request.url().host() : "UNKNOWN" )); // 注册计时器监控数据,此时Prometheus可以通过Spring Boot Actuator提供的/actuator/promotheus断点来pull数据 Timer.builder(this.requestsMetricName) .tags(tags) .description("Timer of OkHttp operation") .register(registry) .record(registry.config().clock().monotonicTime() - state.startTime, TimeUnit.NANOSECONDS); } }4|44.4 Spring Boot集成案例
5|05. 参考文档
[转帖]Promethues + Grafana + AlertManager使用总结的更多相关文章
- Prometheus+Grafana+Alertmanager实现告警推送教程 ----- 图文详解
前言 本文主要介绍的是Prometheus采集数据,通过Grafana加上PromQL语句实现数据可视化以及通过Alertmanage实现告警推送功能.温馨提示,本篇文章特长,2w多的文字加上几十张图 ...
- Prometheus+Grafana+Alertmanager搭建全方位的监控告警系统
prometheus安装和配置 prometheus组件介绍 1.Prometheus Server: 用于收集和存储时间序列数据. 2.Client Library: 客户端库,检测应用程序代码,当 ...
- [转帖]Prometheus+Grafana监控Kubernetes
原博客的位置: https://blog.csdn.net/shenhonglei1234/article/details/80503353 感谢原作者 这里记录一下自己试验过程中遇到的问题: . 自 ...
- 基于Prometheus+Grafana+AlertManager的监控系统
一.Prometheus 1.1 简介 Prometheus是一套开源的监控&报警&时间序列数据库的组合,基于应用的metrics来进行监控的开源工具 . 1.2 下载&安装 ...
- 图文详解Prometheus监控+Grafana+Alertmanager告警安装使用
一:前言 一个服务上线了后,你想知道这个服务是否可用,需要监控.假如线上出故障了,你要先于顾客感知错误,你需要监控.还有对数据库,服务器的监控,等等各层面的监控. 近年来,微服务架构的流行,服务数越来 ...
- prometheus+grafana+Alertmanager邮箱告警
环境 系统:CentOS 7 软件:alertmanager-0.18.0.linux-amd64.tar.gz 安装 下载二进制包 地址:https://prometheus.io/download ...
- [转帖]使用Grafana和Telegraf监视VMware ESXi的方法
使用Grafana和Telegraf监视VMware ESXi的方法 2019-04-03 15:28:30作者:曾秀珠稿源:云网牛站 https://ywnz.com/linuxyffq/4660. ...
- Kubernetes1.16下部署Prometheus+node-exporter+Grafana+AlertManager 监控系统
Prometheus 持久化安装 我们prometheus采用nfs挂载方式来存储数据,同时使用configMap管理配置文件.并且我们将所有的prometheus存储在kube-system #建议 ...
- elasticsearch 小总结
elasticsearch 小总结 0. 起因 距离初次写关于es的文章 https://blog.csdn.net/aca_jingru/article/details/44488703 已经过去4 ...
- 机房ping监控 smokeping+prometheus+grafana
一.前言 1.本监控方案主要由smokeping+promethues+grafana组成.smokeping主要数据采集,promethues作为数据存储,grafana数据展示 2.其实smoke ...
随机推荐
- ubuntu 之 安装mysql8
安装 1 wget https://dev.mysql.com/get/mysql-apt-config_0.8.12-1_all.deb 2 sudo apt-get update sudo apt ...
- Feign源码解析4:调用过程
背景 前面几篇分析了Feign的初始化过程,历经艰难,可算是把@FeignClient注解的接口对应的代理对象给创建出来了.今天看下在实际Feign调用过程中的一些源码细节. 我们这里Feign接口如 ...
- 【Python】人工智能-机器学习——不调库手撕贝叶斯分类问题
1. 作业内容描述 1.1 背景 数据集大小150 该数据有4个属性,分别如下 Sepal.Length:花萼长度(cm) Sepal.Width:花萼宽度单位(cm) Petal.Length:花瓣 ...
- Deployment控制器
目录 Deployment控制器 1.deployment及副本数 使用命令生产yaml文件模板 控制器通过什么管理pod? 2.副本数修改方法 3.动态扩展HPA 4.镜像滚动升级及回滚 升级 回退 ...
- JS模块化编程规范1——require.js
目录 1. 概述 2. 详论 2.1. 定义 2.2. 调用 2.3. 入口 3. 结果 4. 参考 1. 概述 require.js是各种网络APP中非常常见的JS依赖库,它其实不仅仅是个模块加载器 ...
- 超90万个K8S实例可被发现暴露在公网上,14%位于中国
翻译: SEAL安全 原标题: Over 900,000 Kubernetes instances found exposed online 原文链接: https://www.bleepingcom ...
- Markdown 图片居中显示,增加图片说明
<center> <img src="https://img2023.cnblogs.com/blog/80824/202308/80824-202308081307138 ...
- lab3 page tables
1.Speed up system calls (easy) 要求:有些操作系统(例如 Linux)通过在用户空间和内核之间的只读区域共享数据来加速某些系统调用.这样可以消除在执行这些系统调用时进行内 ...
- 【python爬虫】bs4遍历、搜索文档树 bs4使用css选择器 selenium基本使用 selenium查找标签 selenium执行js代码
目录 上节回顾 今日内容 0 bs4遍历文档树 1 bs4搜索文档树 1.1 find方法的其他参数 2 css选择器 3 selenium基本使用 4 无界面浏览器 4.1 模拟登录百度 5 sel ...
- The Cluster ID Zc7nlyfTQ5qPbhY2d8I_3A doesn't match stored clusterId Some(ZvQZIX9gTB-dj05be_i_-w) in meta.properties.
启动kafka时报错(部分信息): [2022-05-12 20:26:05,589] INFO Cluster ID = Zc7nlyfTQ5qPbhY2d8I_3A (kafka.server.K ...