扒开源安卓性能测试工具moblieperf源码——开发属于你自己的性能稳定性测试工具
moblieperf下载和使用
moblieperf由阿里巴巴开源的Android性能测试工具
下载:官方源码地址mobileperf github
使用:
- 使用pycharm打开下载的项目
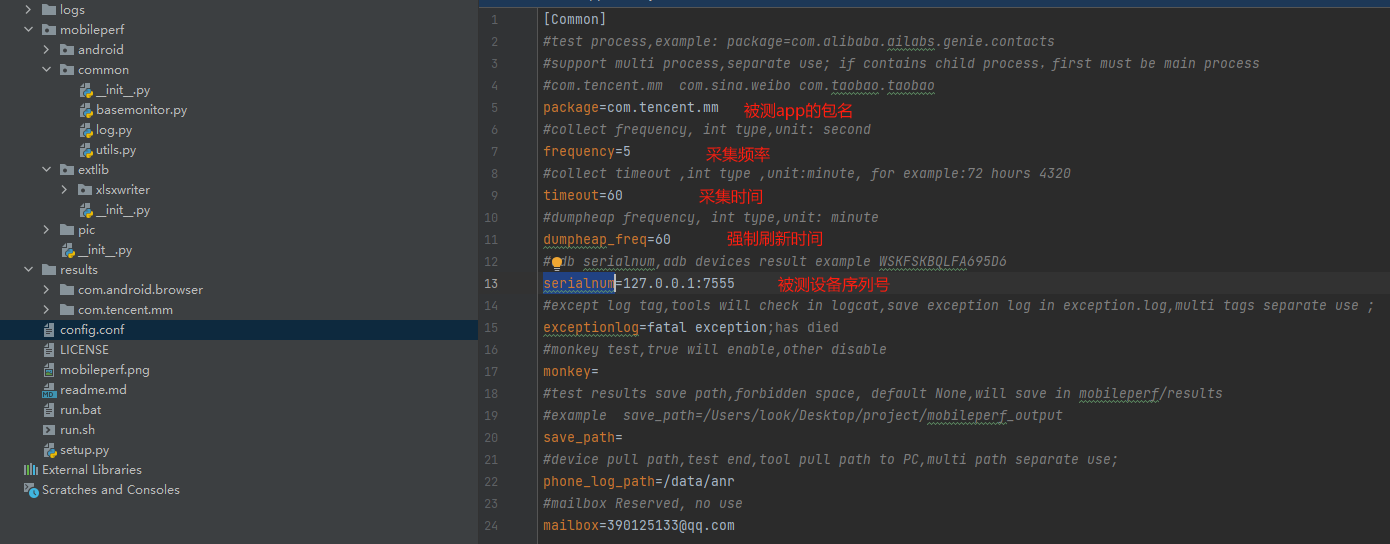
- 使用只需要修改配置文件config.conf即可
- 运行采集:a.mac、linux 在mobileperf工具根目录下执行sh run.sh ; b.windows 双击run.bat
配置图:(简单使用只需要修改包名和设备序列号即可)
源码阅读
原来我们主要阅读我们想实现功能是如何实现的(cpu,内存)
我们先从启动类StartUp中run方法看起:
for i in range(0,5):

    if self.device.adb.is_connected(self.serialnum):

        is_device_connect = True

        break

    else:

        logger.error("device not found:"+self.serialnum)

        time.sleep(2)
self.serialnum就是配置表中的设备序列号,这一段是用过ADB类中的静态方法is_connected实现的,我们来看一下他们是怎么检查配置中的手机是否链接
@staticmethod

def is_connected(device_id):

    '''

                检查设备是否连接上

    '''

    if device_id in ADB.list_device():

        return True

    else:

        return False
    @staticmethod

    def list_device():

        '''获取设备列表

        :return: 返回设备列表

        :rtype: list

        '''

        proc = subprocess.Popen("adb devices", stdout=subprocess.PIPE, shell=True)

        result = proc.stdout.read()

        if not isinstance(result, str):

            result = result.decode('utf-8')

        result = result.replace('\r', '').splitlines()

        logger.debug("adb devices:")

        logger.debug(result)

        device_list = []

        for device in result[1:]:

            if len(device) <= 1 or not '\t' in device: continue

            if device.split('\t')[1] == 'device':

                # 只获取连接正常的

                device_list.append(device.split('\t')[0])

        return device_list
通过这一段代码我们可以发现,mobileperf是基于adb命令去读取相应的信息,而他的使用是通过subprocess类中的Popen去操作adb命令,通过adb devices命令判断是否已经链接成功
注:subprocess是python标准库兼容性较好,且是非阻塞性执行,在输入输出的拓展性、错误处理都比较健全完善,后面会在提到这个方法使用。
  # 对是否安装被测app的检查 只在最开始检查一次

        if not self.device.adb.is_app_installed(self.packages[0]):

            logger.error("test app not installed:" + self.packages[0])

            return

        try:

            #初始化数据处理的类,将没有消息队列传递过去,以便获取数据,并处理

            # datahandle = DataWorker(self.get_queue_dic())

            # 将queue传进去,与datahandle那个线程交互

            self.add_monitor(CpuMonitor(self.serialnum, self.packages, self.frequency, self.timeout))

            self.add_monitor(MemMonitor(self.serialnum, self.packages, self.frequency, self.timeout))
这里我们节选了一部分代码,当我们知道他基本实现逻辑其实我们大致也可以猜到is_app_installed判断app是否安装他是如何实现的!应该也是通过adb命令去寻找已安装的包是否存在
    def is_app_installed(self, package):

        '''

        判断app是否安装

        '''

        if package in self.list_installed_app():

            return True

        else:

            return False
    def list_installed_app(self):

        '''

                        获取已安装app列表

        :return: 返回app列表

        :rtype: list

        '''

        result = self.run_shell_cmd('pm list packages')

        result = result.replace('\r', '').splitlines()

        logger.debug(result)

        installed_app_list = []

        for app in result:

            if not 'package' in app: continue

            if app.split(':')[0] == 'package':

                # 只获取连接正常的

                installed_app_list.append(app.split(':')[1])

        logger.debug(installed_app_list)

        return installed_app_list
正如我们所料,他是用过命令adb shell pm list packages 返回的接口进行切割拿到包名,去判断需要测试包名是否在其中
那么他是采集和收集内存/cpu等信息是不是也是这样实现的呢,答案是肯定的
        end_time = time.time() + self._timeout

        cpu_title = ["datetime", "device_cpu_rate%", "user%", "system%","idle%"]

        cpu_file = os.path.join(RuntimeData.package_save_path, 'cpuinfo.csv')

        for i in range(0, len(self.packages)):

            cpu_title.extend(["package", "pid", "pid_cpu%"])

        if len(self.packages) > 1:

            cpu_title.append("total_pid_cpu%")

        try:

            with open(cpu_file, 'a+') as df:

                csv.writer(df, lineterminator='\n').writerow(cpu_title)

        except RuntimeError as e:

            logger.error(e)

        while not self._stop_event.is_set() and time.time() < end_time:

            try:

                logger.debug("---------------cpuinfos, into _collect_package_cpu_thread loop thread is : " + str(threading.current_thread().name))

                before = time.time()

                #为了cpu值的准确性,将采集的时间间隔放在top命令中了

                cpu_info = self._top_cpuinfo()

                after = time.time()

                time_consume = after - before

                logger.debug("  ============== time consume for cpu info : "+str(time_consume))
这里我们截取了一段收集cpu的代码,可以发现他是通过一个while循环去调用_top_cpuinfo方法
    def _top_cpuinfo(self):

        self._top_pipe = self.device.adb.run_shell_cmd(self.top_cmd, sync=False)

        out = self._top_pipe.stdout.read()

        error = self._top_pipe.stderr.read()
我们接着往下看
    def run_shell_cmd(self, cmd, **kwds):

        '''执行 adb shell 命令

        '''

        # 如果失去连接后,adb又正常连接了

        if not self.before_connect and self.after_connect:

            cpu_uptime_file = os.path.join(RuntimeData.package_save_path, "uptime.txt")

            with open(cpu_uptime_file, "a+",encoding = "utf-8") as writer:

                writer.write(TimeUtils.getCurrentTimeUnderline() + " /proc/uptime:" + self.run_adb_cmd("shell cat /proc/uptime") + "\n")

            self.before_connect = True

        ret = self.run_adb_cmd('shell', '%s' % cmd, **kwds)

        # 当 adb 命令传入 sync=False时,ret是Poen对象

        if ret == None:

            logger.error(u'adb cmd failed:%s ' % cmd)

        return ret
不难发现,最终依旧是调用的run_adb_cmd方法去执行的adb命令,最后把收集到数据写入对应文件中,看到这里我们大概可以自己实现一下了
开发自己的安卓性能工具
注:这里工具页面开发我们使用gui开发工具pyside6
前面我们提到了标准库subprocess这里介绍一下我们会用到的两个方法communicate从子进程的stdout和stderr读取数据。这个方法会阻塞主程序,直到子进程完成,poll检查子进程是否结束,如果子进程正常退出,输出应该为 0;否则为非0值
页面简单拖拽
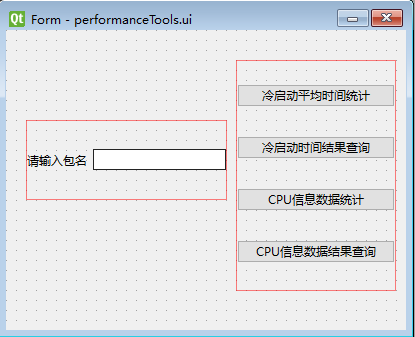
ui文件转换py文件
pyside6-uic <ui文件名>.ui -o <py文件名>.py
# -*- coding: utf-8 -*-

################################################################################

## Form generated from reading UI file 'performanceTools.ui'

##

## Created by: Qt User Interface Compiler version 6.6.1

##

## WARNING! All changes made in this file will be lost when recompiling UI file!

################################################################################

from PySide6.QtCore import (QCoreApplication, QDate, QDateTime, QLocale,

    QMetaObject, QObject, QPoint, QRect,

    QSize, QTime, QUrl, Qt)

from PySide6.QtGui import (QBrush, QColor, QConicalGradient, QCursor,

    QFont, QFontDatabase, QGradient, QIcon,

    QImage, QKeySequence, QLinearGradient, QPainter,

    QPalette, QPixmap, QRadialGradient, QTransform)

from PySide6.QtWidgets import (QApplication, QHBoxLayout, QLabel, QLineEdit,

    QPushButton, QSizePolicy, QVBoxLayout, QWidget)

class Ui_Form(object):

    def setupUi(self, Form):

        if not Form.objectName():

            Form.setObjectName(u"Form")

        Form.resize(400, 300)

        self.horizontalLayoutWidget = QWidget(Form)

        self.horizontalLayoutWidget.setObjectName(u"horizontalLayoutWidget")

        self.horizontalLayoutWidget.setGeometry(QRect(20, 90, 201, 80))

        self.horizontalLayout = QHBoxLayout(self.horizontalLayoutWidget)

        self.horizontalLayout.setObjectName(u"horizontalLayout")

        self.horizontalLayout.setContentsMargins(0, 0, 0, 0)

        self.label = QLabel(self.horizontalLayoutWidget)

        self.label.setObjectName(u"label")

        self.horizontalLayout.addWidget(self.label)

        self.packagename = QLineEdit(self.horizontalLayoutWidget)

        self.packagename.setObjectName(u"packagename")

        self.horizontalLayout.addWidget(self.packagename)

        self.verticalLayoutWidget = QWidget(Form)

        self.verticalLayoutWidget.setObjectName(u"verticalLayoutWidget")

        self.verticalLayoutWidget.setGeometry(QRect(230, 30, 160, 231))

        self.verticalLayout = QVBoxLayout(self.verticalLayoutWidget)

        self.verticalLayout.setObjectName(u"verticalLayout")

        self.verticalLayout.setContentsMargins(0, 0, 0, 0)

        self.cold_time_cal_button = QPushButton(self.verticalLayoutWidget)

        self.cold_time_cal_button.setObjectName(u"cold_time_cal_button")

        self.verticalLayout.addWidget(self.cold_time_cal_button)

        self.cold_time_cal_result_button = QPushButton(self.verticalLayoutWidget)

        self.cold_time_cal_result_button.setObjectName(u"cold_time_cal_result_button")

        self.verticalLayout.addWidget(self.cold_time_cal_result_button)

        self.cpuinfo_button = QPushButton(self.verticalLayoutWidget)

        self.cpuinfo_button.setObjectName(u"cpuinfo_button")

        self.verticalLayout.addWidget(self.cpuinfo_button)

        self.cpuinfo_result_button = QPushButton(self.verticalLayoutWidget)

        self.cpuinfo_result_button.setObjectName(u"cpuinfo_result_button")

        self.verticalLayout.addWidget(self.cpuinfo_result_button)

        self.retranslateUi(Form)

        QMetaObject.connectSlotsByName(Form)

    # setupUi

    def retranslateUi(self, Form):

        Form.setWindowTitle(QCoreApplication.translate("Form", u"Form", None))

        self.label.setText(QCoreApplication.translate("Form", u"\u8bf7\u8f93\u5165\u5305\u540d", None))

        self.cold_time_cal_button.setText(QCoreApplication.translate("Form", u"\u51b7\u542f\u52a8\u5e73\u5747\u65f6\u95f4\u7edf\u8ba1", None))

        self.cold_time_cal_result_button.setText(QCoreApplication.translate("Form", u"\u51b7\u542f\u52a8\u65f6\u95f4\u7ed3\u679c\u67e5\u8be2", None))

        self.cpuinfo_button.setText(QCoreApplication.translate("Form", u"CPU\u4fe1\u606f\u6570\u636e\u7edf\u8ba1", None))

        self.cpuinfo_result_button.setText(QCoreApplication.translate("Form", u"CPU\u4fe1\u606f\u6570\u636e\u7ed3\u679c\u67e5\u8be2", None))

    # retranslateUi
功能实现逻辑代码
import time

import pyecharts.charts

from pyecharts import options as opts

from util import ADB

import subprocess

import os

import sys

from PySide6.QtWidgets import QApplication, QWidget, QLabel, QPushButton, QMessageBox

from PySide6.QtCore import Slot, Signal

import performanceTools

import threading

class QmyWeidge(QWidget):

    #建立信号

    packagenameSignal = Signal(str)

    def __init__(self):

        super().__init__()

        self.ui = performanceTools.Ui_Form()

        self.ui.setupUi(self)

        self.cold_time_cal_htmlname = ""

        self.cpuinfo_htmlname = ""

        self.packagenameSignal.connect(self.isPackagenameExciting)#判断包名是否存在信号槽链接

    def open_html_by_firefox(self, local_html_name):

        # 获取当前工作目录

        current_dir = os.getcwd()

        # 指定本地HTML文件的路径

        local_file = os.path.join(current_dir, local_html_name)

        # 指定火狐浏览器的可执行文件路径

        firefox_path = "C:/Program Files/Mozilla Firefox/firefox.exe"  # 替换为你的火狐浏览器可执行文件的路径

        # 构建火狐浏览器的命令行参数

        url = 'file://' + local_file + '.html'

        cmd = [firefox_path, url]

        # 使用subprocess启动火狐浏览器并打开本地HTML文件

        subprocess.Popen(cmd)

    def result_to_html(self, xaxis, yaxis, y_name, title):

        pyecharts.charts.Line().add_xaxis(xaxis).add_yaxis(y_name, yaxis).set_global_opts(

            title_opts=opts.TitleOpts(title=title)).render(path=f'./{title}.html')

    @Slot()

    def on_cold_time_cal_button_clicked(self):

        """

        运行10次取平均值

        :param current_activity: 当前运行的app页面,或者是待测的页面

        :return: 范围运行第x次的数据y

        """

        #按钮置灰

        self.ui.cold_time_cal_button.setEnabled(False)

        self.ui.cold_time_cal_button.repaint()

        self.ui.cold_time_cal_result_button.setEnabled(False)

        self.ui.cold_time_cal_result_button.repaint()

        current_activity = ADB().get_current_activity()

        x = []

        y = []

        for i in range(1, 11):

            x.append(f"第{i}次")

            cold_start_time = ADB().get_launchState_cold_totalTime(current_activity)

            y.append(cold_start_time)

            ADB().stop_app(current_activity)

        #输出结果

        self.cold_time_cal_htmlname = f"冷启动时间趋势图_平均耗时{sum(y) / 10}"

        self.result_to_html(x, y ,"启动时间", self.cold_time_cal_htmlname)

        #恢复按钮

        self.ui.cold_time_cal_button.setEnabled(True)

        self.ui.cold_time_cal_result_button.setEnabled(True)

    @Slot()

    def on_cold_time_cal_result_button_clicked(self):

        self.open_html_by_firefox(self.cold_time_cal_htmlname)

    @Slot()

    def on_cpuinfo_button_clicked(self):

        """

        运行10次取平均值

        :return: 范围运行第x次的数据y

        """

        #按钮置灰

        self.ui.cpuinfo_button.setEnabled(False)

        self.ui.cpuinfo_button.repaint()

        self.ui.cpuinfo_result_button.setEnabled(False)

        self.ui.cpuinfo_result_button.repaint()

        x = []

        y = []

        if self.ui.packagename.text():

            for i in range(1,11):

                x.append(f"第{i}次")

                try:

                    cpu, _, _ = ADB().get_cpuinfo(self.ui.packagename.text())

                    y.append(round(float(cpu.replace('%', '')), 4))

                    time.sleep(2)

                    # 输出结果

                    self.cpuinfo_htmlname = f"cpu占比趋势图_平均占比{sum(y) / 10} %"

                    self.result_to_html(x, y, "cpu占比(%)", self.cpuinfo_htmlname)

                except:

                    msgBox = QMessageBox()

                    msgBox.setWindowTitle("提醒")

                    msgBox.setText(f"{self.ui.packagename.text()}确认是否运行!未获取到对应cpu信息!")

                    msgBox.exec()

                    break

        else:

            self.packagenameSignal.emit(self.ui.packagename.text())

        #恢复按钮

        self.ui.cpuinfo_result_button.setEnabled(True)

        self.ui.cpuinfo_button.setEnabled(True)

    @Slot()

    def on_cpuinfo_result_button_clicked(self):

        self.open_html_by_firefox(self.cpuinfo_htmlname)

    def isPackagenameExciting(self, value):

        if not value :

            msgBox  = QMessageBox()

            msgBox.setWindowTitle("提醒")

            msgBox.setText("请输入包名!")

            msgBox.exec()

if __name__ == '__main__':

    app = QApplication(sys.argv)

    myWindow = QmyWeidge()

    myWindow.show()

    sys.exit(app.exec())
扒开源安卓性能测试工具moblieperf源码——开发属于你自己的性能稳定性测试工具的更多相关文章
- 三种web性能压力测试工具
三种web性能压力测试工具http_load webbench ab小结 题记:压力和性能测试工具很多,下文讨论的是我觉得比较容易上手,用的比较多的三种 http_load 下载地址:http://w ...
- [AapacheBench工具]web性能压力测试工具的应用与实践
背景:网站性能压力测试是性能调优过程中必不可少的一环.服务器负载太大而影响程序效率是很常见的事情,一个网站到底能够承受多大的用户访问量经常是我们最关心的问题.因此,只有让服务器处在高压情况下才能真正体 ...
- Web服务器性能/压力测试工具http_load、webbench、ab、Siege使用教程 - VPS侦探
Web服务器性能/压力测试工具http_load.webbench.ab.Siege使用教程 - VPS侦探 http://soft.vpser.net/test/http_load/http_loa ...
- Monkey Android app稳定性测试工具之Monkey使用教程
Monkey Android app稳定性测试工具之Monkey使用教程 by:授客 QQ:1033553122 由于篇幅问题,仅提供百度网盘下载链接: Android app稳定性测试工具之Monk ...
- Web服务器性能压力测试工具http_load、webbench、ab、Siege使用教程
Web服务器性能压力测试工具http_load.webbench.ab.Siege使用教程 作者: feng 日期: 2012/07/25 发表评论 (0) 查看评论 一.http_load 程序 ...
- Web服务器性能/压力测试工具http_load、webbench、ab、Siege、loadrunner
回头看看 Web服务器性能/压力测试工具http_load.webbench.ab.Siege.loadrunner
- Web性能压力测试工具——Siege
最近需要对Istio里的bookinfo进行分析,老是手去刷新太慢了,就找了个自动点的工具——Siege Siege是一款开源的压力测试工具,设计用于评估WEB应用在压力下的承受能力.可以根据配置对一 ...
- 网站服务器压力Web性能测试(1):Apache Bench:Apache自带服务器压力测试工具
一个网站或者博客到底能够承受多大的用户访问量经常是我们在用VPS或者独立服务器搭建网站了最关心的问题,还有不少人喜欢对LNMP或者LAMP进行一些优化以便提高Web性能,而优化后到底有多大的效果,就需 ...
- (总结)Web性能压力测试工具之WebBench详解
PS:在运维工作中,压力测试是一项很重要的工作.比如在一个网站上线之前,能承受多大访问量.在大访问量情况下性能怎样,这些数据指标好坏将会直接影响用户体验.但是,在压力测试中存在一个共性,那就是压力 ...
- 网站性能压力测试工具--apache ab使用详解
ab是apache自带的压力测试工具.ab非常实用,它不仅可以对apache服务器进行网站访问压力测试,也可以对其它类型的服务器进行压力测试.比如nginx.tomcat.IIS等. 下面我们开始介绍 ...
随机推荐
- for-each循环使用iterator进行遍历
示例如下: public static void main(String args[]) { List list = new LinkedList(); list.add("aa" ...
- idea 配置 service 服务,多模块同时启动
转载请注明出处: 1,打开IDEA项目 .idea 下 的workspace.xml 2,查找"RunDashboard" 节点 3,添加如下内容 <option name= ...
- SV 设计特性
过程语句块特性 ABC 过程块语句 always_comb 防止多驱动的问题:赋值块左侧的语句无法被另一个过程块赋值 if语句没有写else,sv会提示警告,sv认为是latch always不会再仿 ...
- P5707 【深基2.例12】上学迟到
1.题目介绍 2.题解 这里只有两个稍微注意的点 2.1 s % v != 0(向上取整) 这里的话,若是结果不为整数,我们必须向上取整,必须保证空余时间永远大于所需时间! 2.2 ceil向上取整函 ...
- JMS微服务开发示例(七)使用 Serilog 作为日志提供者
nuget 引入: Serilog.Extensions.LoggingSerilog.Settings.ConfigurationSerilog.Sinks.ConsoleSerilog.Sinks ...
- VMto阿里云的简单过程
VMto阿里云的简单过程 第一步打开网站 https://smcnext.console.aliyun.com/sourceServers/importMigrationSource?spm=5176 ...
- [转帖]资料整理——Oracle版本历史(很全面)(Releases and versions of Oracle Database)
资料来源: https://en.wikipedia.org/wiki/Oracle_Database Oracle Database Version Initial Release Version ...
- [转帖]jmeter线程组与循环次数的区别
在压测的时候,有些接口需要携带登录信息,但是我们只想登录一次,然后其他接口进行多用户压测,此时你会怎么办?用仅一次控制器实现吗?下面我们来看看用仅一次控制器能不能实现 压测时jmeter中的线程数是模 ...
- [转帖]模拟enq: TX - row lock contention争用
https://www.modb.pro/db/623036 enq: TX - row lock contention它表示一个事务正在等待另一个事务释放被锁定的行.这种等待事件通常发生在并发访问数 ...
- 1.2 w字+!Java IO 基础知识系统总结 | JavaGuide
首发于:JavaGuide(「Java学习+面试指南」一份涵盖大部分 Java 程序员所需要掌握的核心知识.) 原文地址:https://javaguide.cn/java/io/io-basis.h ...