
Linux: CPU C-states
0. Overview
There are various power modes of the CPU which are determined based on their current usage and are collectively called “C-states” or “C-modes.” With CPU C-states, the CPU can enter the idle status to optimize energy consumption.
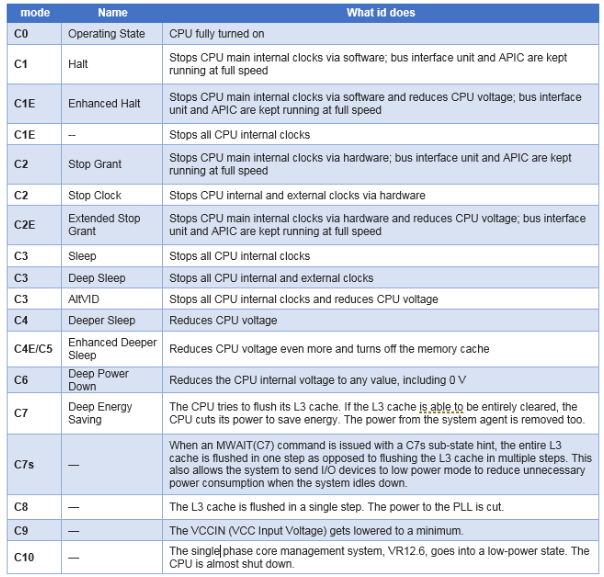
The CPU has a different C-state, and the deeper state means more energy saving. To save power/energy, stop the CPU clock and circuits. ie., so when CPU moving to the work(C0) state from idle state(Cx), it needs more switch time. The deeper the state, the more switch time is needed.
The CPU will switch the state from running to idle automatically, so when the fast path (lower latency) application has bound to the CPU, the application shall keep the busy state (ex: busy-loop) to avoid the state switch of the CPU, and for the slow path (no high require for latency), the application can allow the CPU wake up from idle to running for service.
1. CPU C-states
1.1 Enable CPU C-states
To enable the CPU C-state, an operator can set the max_cstate during BIOS installation. Take an example:
// server 1

# cat /sys/module/intel_idle/parameters/max_cstate

9

// server 2

# cat /sys/module/intel_idle/parameters/max_cstate

0
Let's see, server 1 has enabled a max 9 C-state, and server 2 has set no CPU C-state supported.
Note: It's an example of setting the C-state, more detailed information can refer to the CPU C-states
1.2 CPU C-states latency
We can also read the latency from cpu_dma_latency as:
// server 1

# hexdump -C /dev/cpu_dma_latency

00000000  00 94 35 77                                       |..5w|

00000004

# echo $(( 0x77359400 ))

2000000000

// server 2

# hexdump -C /dev/cpu_dma_latency

00000000  01 00 00 00                                       |....|

00000004

# echo $(( 0x00000001 ))

1
Here server 1 has 2000 seconds latency(from idle to C0 running state), and server 2 has 1 microsecond latency.
1.3 CPU C-states monitor
The cpupower-monitor can monitor the CPU processor and report processor frequency and idle statistics, for example:
# cpupower monitor

    | Nehalem                   || Mperf              || Idle_Stats

 CPU| C3   | C6   | PC3  | PC6   || C0   | Cx   | Freq  || POLL | C1   | C1E  | C6

   0|  0.00|  0.00|  0.00|  0.00||  0.53| 99.47|  2084||  0.00|  0.01| 99.52|  0.00

  24|  0.00|  0.00|  0.00|  0.00||  0.26| 99.74|  2252||  0.00|  0.24| 99.51|  0.00

   1|  0.00|  0.00|  0.00|  0.00||  0.33| 99.67|  2422||  0.00|  0.00| 99.67|  0.00

  25|  0.00|  0.00|  0.00|  0.00||  0.90| 99.10|  2580||  0.01|  0.26| 98.91|  0.00

   2|  0.00|  0.00|  0.00|  0.00||  0.20| 99.80|  1810||  0.00|  0.00| 99.81|  0.00

  26|  0.00|  0.00|  0.00|  0.00||  0.84| 99.16|  2867||  0.01|  0.29| 98.88|  0.00

   3|  0.00|  0.00|  0.00|  0.00||  0.83| 99.17|  2686||  0.01|  0.55| 98.66|  0.00

  27|  0.00|  0.00|  0.00|  0.00||  1.47| 98.53|  2979||  0.00|  0.00| 98.53|  0.00

   4|  0.00|  0.00|  0.00|  0.00||  0.40| 99.60|  1914||  0.00|  0.02| 99.66|  0.00

  28|  0.00|  0.00|  0.00|  0.00||  1.61| 98.39|  2995||  0.00|  0.00| 98.39|  0.00

   5|  0.00|  0.00|  0.00|  0.00||  0.73| 99.27|  2527||  0.00|  0.29| 99.03|  0.00
There are three monitors Nehalem, Mperf and Idle_Stats has monitor the process information. From the report, we can see that most CPUs are in the C1E idle state.
To make the CPU switch to a running(C0) state, we can use stress to make a trial, after stress the CPU load is higher and higher, the more CPUs will switch from the C1E idle state to C0, the detailed information as the CPU C-states.
1.4 CPU C-states driver
To enable the CPU C-states, the hardware driver acpi_idle or intel_idle is needed.
- "acpi_idle" cpuidle driver: The acpi_idle cpuidle driver retrieves available sleep states (C-states) from the ACPI BIOS tables (from the _CST ACPI function on recent platforms or from the FADT BIOS table on older ones). The C1 state is not retrieved from ACPI tables. If the C1 state is entered, the kernel will call the hlt instruction (or mwait on Intel).
- "intel_idle" cpuidle driver: In kernel 2.6.36 the intel_idle driver was introduced. It only serves recent Intel CPUs (Nehalem, Westmere, Sandybridge, Atoms or newer). On older Intel CPUs the acpi_idle driver is still used (if the BIOS provides C-state ACPI tables). The intel_idle driver knows the sleep state capabilities of the processor and ignores ACPI BIOS exported processor sleep states tables.
To Check the cpuidle driver from /sys/devices/system/cpu/cpuidle/current_driver as:
// server 1

# cat /sys/devices/system/cpu/cpuidle/current_driver

intel_idle

// server 2

# cat /sys/devices/system/cpu/cpuidle/current_driver

acpi_idle
2. Reference
Linux: CPU C-states的更多相关文章
- Understanding Linux CPU stats
Your Linux server is running slow, so you follow standard procedure and run top. You see the CPU met ...
- Linux CPU亲缘性详解
前言 在淘宝开源自己基于nginx打造的tegine服务器的时候,有这么一项特性引起了笔者的兴趣.“自动根据CPU数目设置进程个数和绑定CPU亲缘性”.当时笔者对CPU亲缘性没有任何概念,当时作者只是 ...
- 查看线程linux cpu使用率
Linux下如何查看高CPU占用率线程 LINUX CPU利用率计算 转 http://www.cnblogs.com/lidabo/p/4738113.html目录(?)[-] proc文件系统 p ...
- Linux CPU数量判断,通过/proc/cpuinfo.
Linux CPU数量判断,通过/proc/cpuinfo. 相同 physical id :决定一个物理处理器 如果“siblings”和“cpu cores”一致,则说明不支持超线程,或者超线程未 ...
- How do I Find Out Linux CPU Utilization?
From:http://www.cyberciti.biz/tips/how-do-i-find-out-linux-cpu-utilization.html Whenever a Linux sys ...
- Linux CPU监控指标
Linux CPU监控指标 Linux提供了非常丰富的命令可以进行CPU相关数据进行监控,例如:top.vmstat等命令.top是一个动态显示过程,即可以通过用户按键来不断刷新当前状态.如果在前台执 ...
- 转载: 一、linux cpu、内存、IO、网络的测试工具
来源地址: http://blog.csdn.net/wenwenxiong/article/details/77197997 记录一下 以后好找.. 一.linux cpu.内存.IO.网络的测试工 ...
- Linux CPU使用率含义及原理
相关概念 在Linux/Unix下,CPU利用率分为用户态.系统态和空闲态,分别表示CPU处于用户态执的时间,系统内核执行的时间,和空闲系统进程执行的时间. 下面是几个与CPU占用率相关的概念. CP ...
- Linux CPU Load Average
理解Linux系统负荷 LINUX下CPU Load Average的一点研究 Linux load average负载量分析与解决思路 Understanding Linux CPU Load - ...
- 理解Linux CPU负载和 CPU使用率
CPU负载和 CPU使用率 这两个从一定程度上都可以反映一台机器的繁忙程度. cpu使用率反映的是当前cpu的繁忙程度,忽高忽低的原因在于占用cpu处理时间的进程可能处于io等待状态但却还未释放进入w ...
随机推荐
- pytorch学习笔记——加载checkpoint时,程序报错,存在GPU和CPU不同步的情况
当我们需要加载之前训练的checkpoint的时候,有时候会发现之前能训练的代码无法继续训练. 这时候很有可能加载优化器的步骤在加载模型前面,这样可能会导致优化器的参数仍然在CPU上,因此代码需要由原 ...
- [研究]SpringBoot-MybatisPlus-Dynamic(多数据源)
SpringBoot-MybatisPlus-Dynamic(多数据源) 前言 基于工作上班累死了...打开自己电脑 不知道干些啥 就康康 PL 网站康康 更新了啥 咦~~~还挺多 看到了多数 ...
- Elasticsearch对接MinIO存储Snapshot快照
服务器配置 MinIO集群节点(4节点) IP 节点1 miniotest1.ip.tp-link.com 172.29.145.80 生产环境需要增加一个Nginx负载均衡前端用于ELK对接,此处直 ...
- 放弃JavaFx开发学习
放弃JavaFx开发学习 一开始学学习JavaFx是想用java写个小游戏,后来学者JavaFx越来越深,发现坑也越来越多,不禁感叹:JavaFx果然是要抛弃的UI玩儿,UI开发还是用react na ...
- RocketMQ 的基本使用
RocketMQwiki是一个分布式消息和流数据平台,具有低延迟.高性能.高可靠性.万亿级容量和灵活的可扩展性.RocketMQ是2012年阿里巴巴开源的第三代分布式消息中间件,2016年11月21日 ...
- Tailscale 基础教程:Headscale 的部署方法和使用教程
Tailscale 是一种基于 WireGuard 的虚拟组网工具,它在用户态实现了 WireGuard 协议,相比于内核态 WireGuard 性能会有所损失,但在功能和易用性上下了很大功夫: 开箱 ...
- android Handler应用
android在运行时改变ui需要在ui线程中修改才行,不然就会报错或者无法启动应用. 我们怎么可以做事不管呢? 既然不能在ui线程外的地方运行修改ui的代码,我们可以用Handler解决这个问题, ...
- k8s卷管理-2
目录 k8s卷管理-2 pv和pvc pv pv的定义 pvc pvc的定义 pv和pvc的绑定关系 手动指定pv与pvc绑定 pod使用pvc pod挂载pvc 访问模式的区别 k8s卷管理-2 之 ...
- 论文解读丨CIKM'22 MARINA:An MLP-Attention Model for Multivariate Time-Series Analysis
摘要:华为云数据库创新Lab在论文<MARINA: An MLP-Attention Model for Multivariate Time-Series Analysis>中提出了华为自 ...
- AOC萌新探索:搭建和体验在线AOC环境
摘要:AOC是一个做网络设备自动化运维以及三方设备纳管的一个能力平台. 本文分享自华为云社区<AOC萌新探索之旅第一期--在线AOC环境初体验>,作者:oysterzz. 接触AOC没多久 ...