spring-boot-learning-监控相关
springboot提供了对项目的监控功能,首先我们需要引入需要的jar包:
<!--监控包-->

        <!-- https://mvnrepository.com/artifact/org.springframework.boot/spring-boot-starter-actuator -->

        <dependency>

            <groupId>org.springframework.boot</groupId>

            <artifactId>spring-boot-starter-actuator</artifactId>

<!--            <version>2.3.2.RELEASE</version>-->

        </dependency>

        <!-- https://mvnrepository.com/artifact/org.springframework.hateoas/spring-hateoas -->

<!--        hateoas:Hypermedia as the engine of application state-->

<!--        REST架构风格中复杂的约束,支持springboot http监控端点的需要-->

        <dependency>

            <groupId>org.springframework.hateoas</groupId>

            <artifactId>spring-hateoas</artifactId>

            <version>1.1.1.RELEASE</version>

        </dependency>
spring-boot-starter-actuator 是springboot实施监控所必须的包。
Actuator默认会提供的端点包括下面:
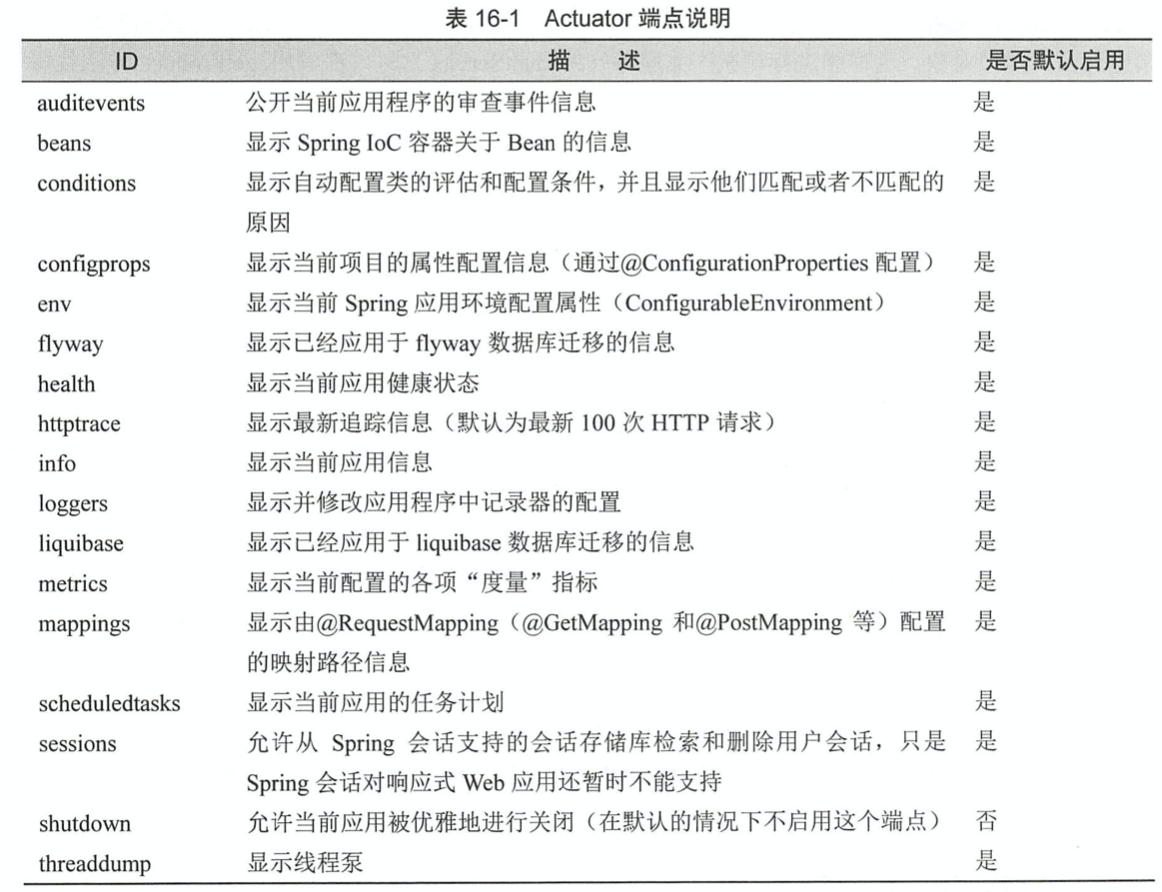
Springboot为这些断电提供多种监控手段,包括http和jmx等。
JMX是什么
JMX(Java Management Extensions,即 Java 管理扩展)是一个为应用程序、设备、系统等植入管理功能的框架。
JMX 可以跨越一系列异构操作系统平台、系统体系结构和网络传输协议,灵活的开发无缝集成的系统、网络和服务管理应用。

JMX 在 Java 编程语言中定义了应用程序以及网络管理和监控的体系结构、设计模式、应用程序接口以及服务。通常使用
JMX 来监控系统的运行状态或管理系统的某些方面,比如清空缓存、重新加载配置文件等。
这里学习的是http
当我们引用的包包括web和actuator的starter包之后,
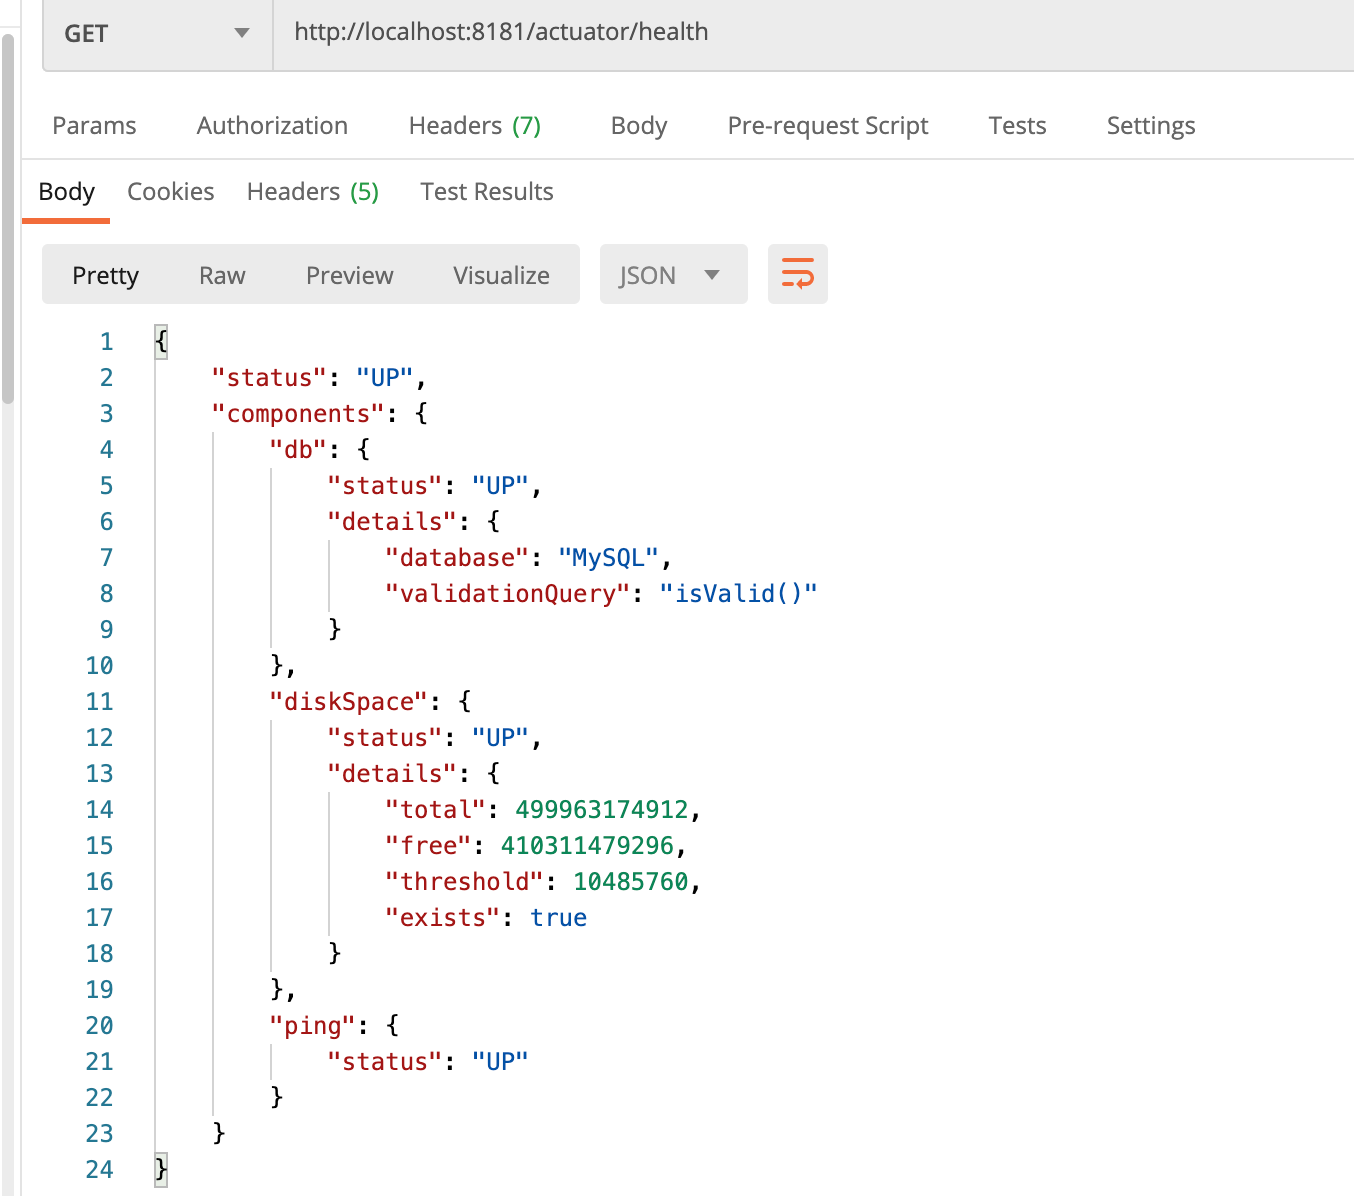
我们启动项目后可以访问:
http://localhost:8181/actuator/health
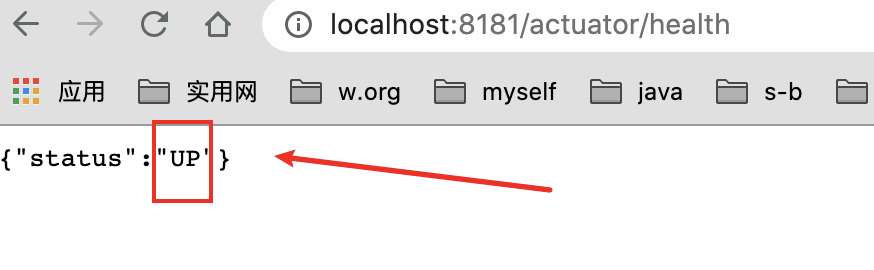
默认只开启了health和info
一些端点会显示一些项目的铭感信息,在默认情况下,springboot只会暴露info和health。其余的不暴露,
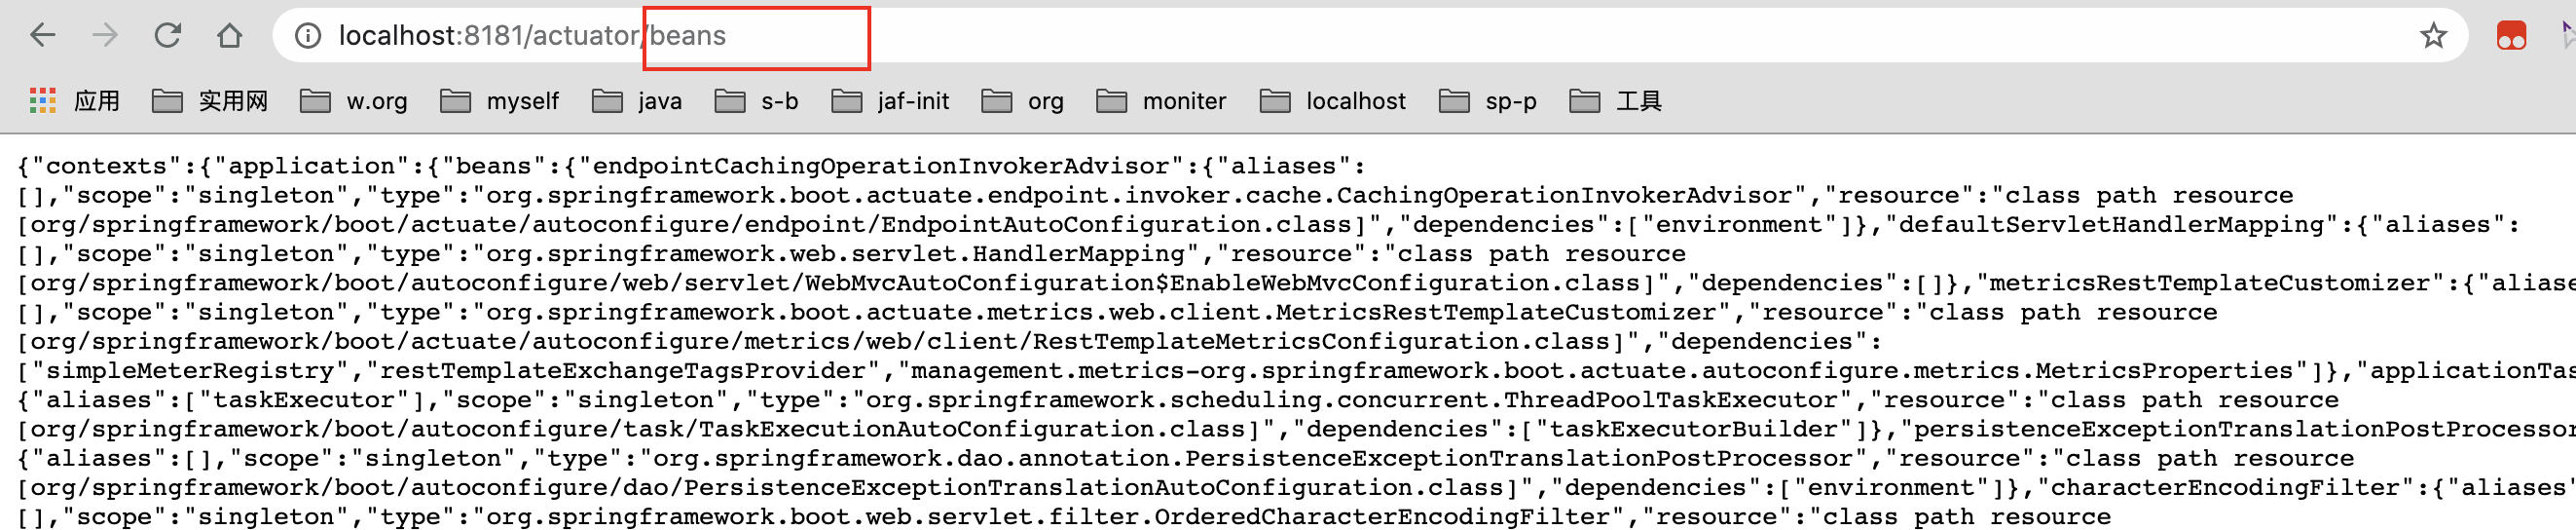
不过我们可以通过application.properties配置文件可以开启:
management.endpoints.web.exposure.include=info,health,beans

#不暴露env端点

#management.endpoints.web.exposure.exclude=env

#暴露所有端点

#management.endpoints.web.exposure.include=*
集合spring security 限制敏感信息特定人员登录:
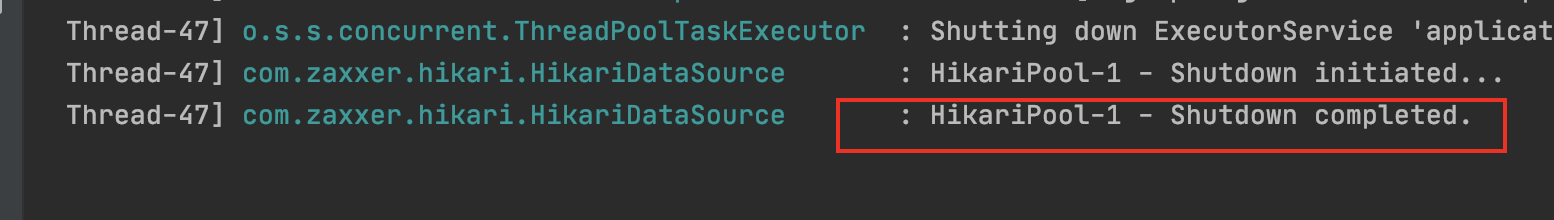
shutdown端点:
。事实上,在默认的情况下, Actuator并不会给开发者启动这个端点, 因为请求它是危险的,从名称就可以知道, 请求它将关闭服务,不过我们可以通过配置文件开启,
#shutdown端点; 直接通过post请求URL关闭服务,

#默认是不会开启的,配置之后可以通过post请求进行访问,直接关闭应用

management.endpoint.shutdown.enabled=true
注意:这个是post请求
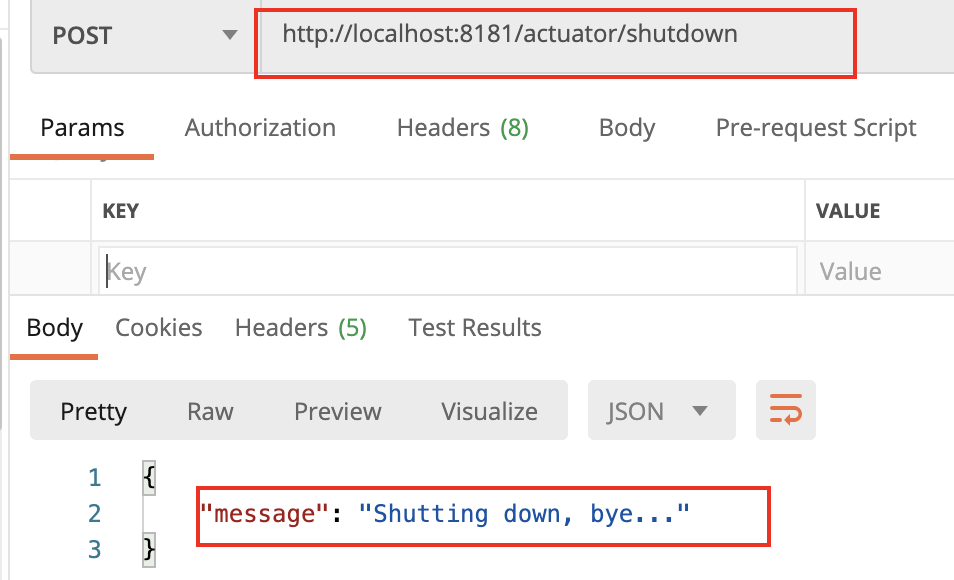
结果
配置端点:
我们可以安装Acuator的默认规则进行使用,也可以自己定义端点的配置:
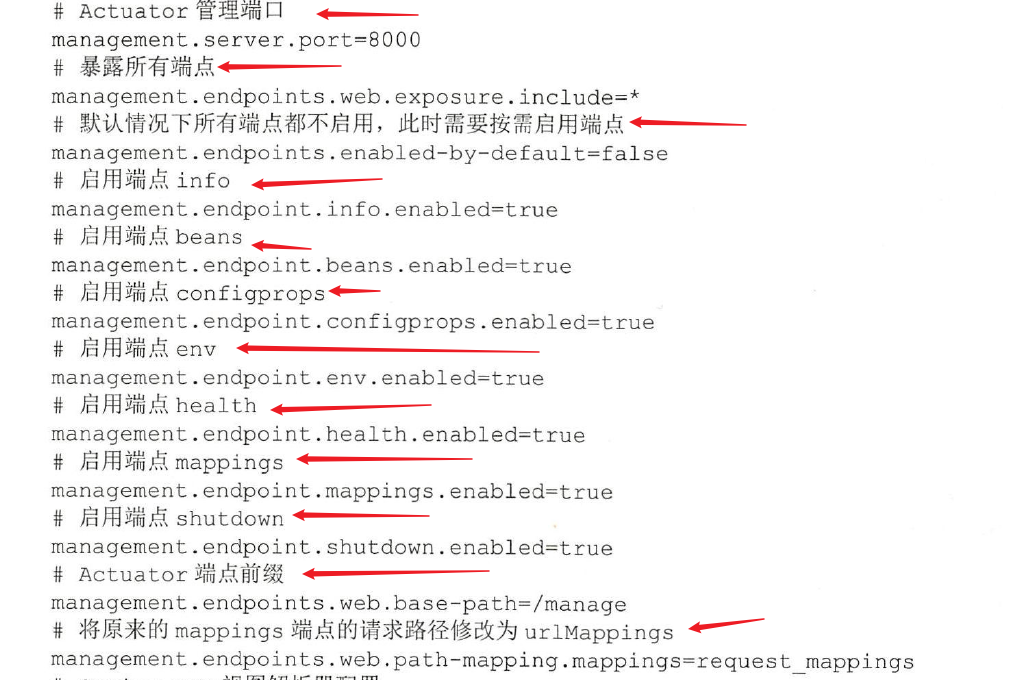
设置了服务器的监控端口为:8000,

通过配置属性management.endpoints.web.base_path=/manage将请求的前缀改为/manage,

所以请求的地址为http://localhost:8000/manage/{endpoint-path}

例如:http://localhost:8000/manage/health

上面设置了不启动任何端点,但是通过下面格式配置可以开启

management.endpoint.<endpointId>.enabled= true

management.endpoints.web.path-mapping.mappings=request_mappings将原来mappings的
端点请求路径从mappings修改为request_mappings
management.endpoints.web.path-mapping.env=/mapping/env将原来env的
端点请求路径从env修改为/mapping/env
自定义端点:
/**

 * 我们可以自定义自己的端点,加入注解@Endpoint,同时提供JMX监控和WEB监控

 * 注意:@JmxEndpoint:只开启JMX监控;@WebEndpoint:只开启web监控

 *

 * 场景:开发一个端点来检测数据是够能够连接上。

 *

 * @Endpoint 定义端点,端点id就是我们的Endpoint的name enableByDefault:默认起不起动端点

 *

 * @ReadOperation 一个端点只能存在一个这个注解去标注方法,代表http的get请求。

 *

 * 最好配置文件加入management.endpoint.dbcheck.enabled=true

 *

 * @ReadOperation == get    成功200  没有返回404

 * @WriteOperation == post  成功200 没有返回值204

 * @DeleteOperation == delete

 */

@Component

@Endpoint(id = "dbcheck",enableByDefault = true)

public class DataBaseConnectionEndPoint {

    private static final String DRIVER = "com.mysql.jc.jdbc.Driver";

    @Value("spring.datasource.url")

    private String url = null;

    @Value("spring.datasource.username")

    private String username= null;

    @Value("spring.datasource.password")

    private String password = null;

    @ReadOperation

    public Map<String,Object> test(){

        Connection connection =null;

        Map<String,Object> msgMap = new HashMap<>();

            try {

                Class.forName(DRIVER);

                connection = DriverManager.getConnection(url,username,password);

                msgMap.put("success",true);

                msgMap.put("message","数据库连接测试");

            } catch (ClassNotFoundException | SQLException e) {

                e.printStackTrace();

            }finally {

                if (connection != null){

                    try {

                        connection.close();

                    } catch (SQLException throwables) {

                        throwables.printStackTrace();

                    }

                }

            }

        return msgMap;

    }

}
配置文件中加入:
management.endpoint.dbcheck.enabled=true
即可启动访问
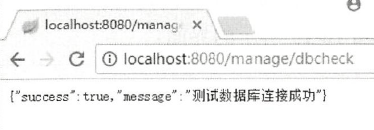
加入的配置就是开启我们自定义的端点dbcheck。
健康指标项
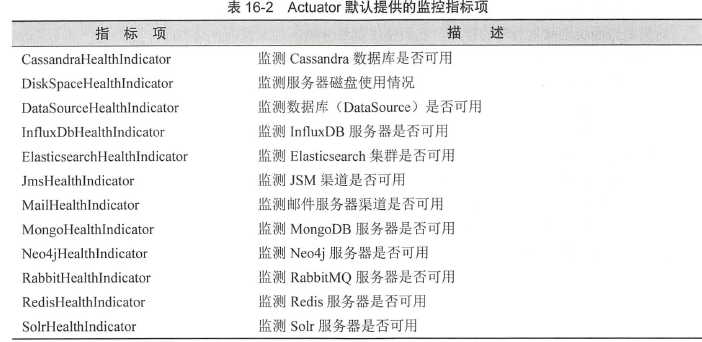
上面的健康指标是Actuator根据我们配置的项目进行自动开启的,只是他们默认请款下,不会进行展示
如果需要展示,需要进行下面配置
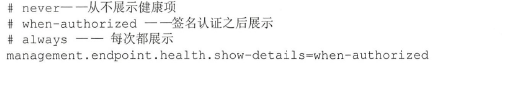
这里设置为always后,访问健康检查:
111也可以根据自己的需求区开启或者关闭自己的健康指标:
management.health.db.enabled=false
关闭对数据库的健康指标
222也可以先关闭所有健康检查指标,在开放自己感兴趣的指标
management.health.defaults.enabled=false

management.health.db.enabled=true
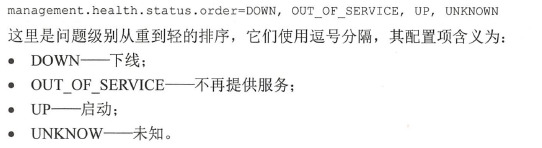
健康指标的严重级别
我们可以自定义自己的健康指标:
场景:现在需要监测服务器是否可以访问万维网( World Wide Web , WWW )
Actuator中的指标设计:

提供作为指标项的接口HealthIndicator,还基于这个接口提供了抽象类AbstractHealthIndicator和指标组合
CompositeHealthIndicator6
@Component

public class WwwHealthIndecator extends AbstractHealthIndicator {

    private final static String BAIDU_HOST = "www.baidu.com";

    private final static int TIME_OUT = 30000;

    @Override

    protected void doHealthCheck(Health.Builder builder) throws Exception {

        boolean status = ping();

        if (status) {

            builder.withDetail("message", "当前服务器可以反问百度").up();

        }else {

            builder.withDetail("message","当前无法访问百度").down();

        }

    }

    private boolean ping() throws Exception{

        try{

            return InetAddress.getByName(BAIDU_HOST).isReachable(TIME_OUT);

        }catch (Exception ex){

            return false;

        }

    }

}
的指标项类标注了@Component ,这样它将被扫描为Spring Bean 。这个指标项继承了

AbstractHealthlndicator,所以需要实现doHealthCheck 方法。doHealthCheck 方法有个Builder 参数,这

个参数的withDetail 方法可以添加一些消息项,还可以根据上下文环境来设置监控状态为“可用”( UP )

或者“不再提供服务” COUT OF SERVICE )。这里,通过监测百度服务器是否可以访问, 来判定万维

网是否可以访问,
结果:

spring-boot-learning-监控相关的更多相关文章
- spring Boot(十九):使用Spring Boot Actuator监控应用
spring Boot(十九):使用Spring Boot Actuator监控应用 微服务的特点决定了功能模块的部署是分布式的,大部分功能模块都是运行在不同的机器上,彼此通过服务调用进行交互,前后台 ...
- 转载-Spring Boot应用监控实战
概述 之前讲过Docker容器的可视化监控,即监控容器的运行情况,包括 CPU使用率.内存占用.网络状况以及磁盘空间等等一系列信息.同样利用SpringBoot作为微服务单元的实例化技术选型时,我们不 ...
- Spring Boot (十): Spring Boot Admin 监控 Spring Boot 应用
Spring Boot (十): Spring Boot Admin 监控 Spring Boot 应用 1. 引言 在上一篇文章<Spring Boot (九): 微服务应用监控 Spring ...
- Spring Boot Actuator监控使用详解
在企业级应用中,学习了如何进行SpringBoot应用的功能开发,以及如何写单元测试.集成测试等还是不够的.在实际的软件开发中还需要:应用程序的监控和管理.SpringBoot的Actuator模块实 ...
- java spring boot 开启监控信息
效果: 配置 // pom <dependency> <groupId>org.springframework.boot</groupId> <artifac ...
- 使用 Spring Boot Admin 监控应用状态
程序员优雅哥 SpringBoot 2.7 实战基础 - 11 - 使用 Spring Boot Admin 监控应用状态 1 Spring Boot Actuator Spring Boot Act ...
- springboot(十九):使用Spring Boot Actuator监控应用
微服务的特点决定了功能模块的部署是分布式的,大部分功能模块都是运行在不同的机器上,彼此通过服务调用进行交互,前后台的业务流会经过很多个微服务的处理和传递,出现了异常如何快速定位是哪个环节出现了问题? ...
- Spring Boot Actuator [监控与管理]
1. 如何添加 2. actuator 的原生端点(API) 2.1 应用类配置 2.1.1 http://localhost:8080/actuator/conditions 2.1.2 http: ...
- (转)Spring Boot (十九):使用 Spring Boot Actuator 监控应用
http://www.ityouknow.com/springboot/2018/02/06/spring-boot-actuator.html 微服务的特点决定了功能模块的部署是分布式的,大部分功能 ...
- Springboot 系列(十七)迅速使用 Spring Boot Admin 监控你的 Spring Boot 程序,支持异常邮件通知
1. Spring Boot Admin 是什么 Spring Boot Admin 是由 codecentric 组织开发的开源项目,使用 Spring Boot Admin 可以管理和监控你的 S ...
随机推荐
- k8s搭建链路监控:skywalking
skywalking架构及简介 官网:https://github.com/apache/skywalking 简介 Java, .NET Core, NodeJS, PHP, and Python ...
- Java中的Unsafe在安全领域的一些应用总结和复现
目录 0 前言 1 基本使用 1.1 内存级别修改值 1.2 创建对象 1.3 创建VM Anonymous Class 2 利用姿势 2.1 修改值以关闭RASP等防御措施 2.2 创建Native ...
- 有了这个BI工具,财务分析再也不用愁
财务软件的发展已基本上将财会工作者从登记凭证.记账.编制会计报表等繁重和重复性的工作中解放出来.但是,当前大多数管理软件或财务软件的财务分析功能还停留在会计信息或财务指标的数据处理.图表展现层面,支持 ...
- jar工具常用命令
参考链接:https://www.ibm.com/developerworks/cn/java/j-jar/index.html
- Kubernetes云供应商架构的未来
首先,我想分享SIG的使命,因为我们用它来指导我们现在和将来的工作.从我们的章程中直接来看,SIG的使命是简化,开发和维护云供应商集成,作为Kubernetes集群的扩展或附加组件.这背后的动机是双重 ...
- MongoDB数据库的下载安装及配置方法
MongoDB安装与配置步骤 MongoDB数据库之安装篇 # 1 下载MongoDB数据库 1.打开浏览器,登录"https://www.mongodb.com/try/download/ ...
- Python回顾笔记(此讲大致说明,详情请看之前的笔记)
内容概要 数据分析(numpy,pandas,matplib) 数据清洗 爬虫 teableau软件 今日内容概要 Python知识回顾 数据分析 ipython模块 anaconda软件 numpy ...
- WPF优秀组件推荐之MahApps
概述 MahApps是一套基于WPF的界面组件,通过该组件,可以使用较小的开发成本实现一个相对很好的界面效果. 官方网站:MahApps.Metro - Home 开源代码:MahApps · Git ...
- C#控制打印机打印
一.引用BarcodeStandard.dll #region BarcodeStandard.dll /* * * 使用说明 需要通过NuGet进行安装BarcodeLib.dll,必不可少 */ ...
- VUE npm run build的项目出现跨域请求的问题npm run dev没有这个问题
报错信息 Access to XMLHttpRequest at 'http://platformapi-test.lih-elearning.cn/api/v1/login' from origin ...