Using an open debug interconnect model to simplify embedded systems design
Using an open debug interconnect model to simplify embedded systems design
Tom Cunningham, Freescale Semiconductor
AUGUST 29, 2007
Technology people are generally familiar with the Open Systems Interconnection model for computer networks and protocols, often referred to as the OSI Reference Model (ISO 7498)[1]. The Basic Reference portion of the model consists of seven layers which build upon each other with increasing levels of abstraction (See Figure 1 below).
This article postulates that a similar abstraction may be applied to the embedded debugging world, with functional layers analogous to the OSI model. Further, individual layers can be assigned to particular debug entities, just like, for example, the association of the OSI network layer to routers, or the application layer association with a host.

Figure 1. OSI Layers and Example implementations
The intent here is to explore levels of debugging functionality, with the OSI model as a guide, and identify hierarchical layers and associations among hardware and software to produce a model of debugging interrelationships. It is hoped that such a model may provide clarity in understanding the myriad ways debugger components interact.
Layer 1: The Test Access Port (TAP) Layer
In the embedded debug domain, the physical layer usually corresponds to some form of synchronous serial interface that operates at a fraction of the target processor speed. Analogous to the ubiquity of TCP/IP in the networking world, the most common debug interface at the physical level is IEEE 1149.1, otherwise known as JTAG [2].

Figure 2. TAP Controller State Machine
JTAG was not conceived as a debug interface originally; its formal name is Standard Test Access Port and Boundary-Scan Architecture, and it was designed as a mechanism for testing printed circuit boards. The idea was to attach a shift register cell to every signal on the device, chaining the cells together around the periphery (hence boundary scan).
The Test Access Port, or TAP, is a state machine that cycles through the various TAP states, shifting in data and instructions (See Figure 2 below). There are four dedicated JTAG signals corresponding to clock (TCK), input (TDI), output (TDO), and mode (machine state) select (TMS). By clocking in commands on TDI via the IR scan path of the TAP controller, a device can be made to send or receive scan data through the DR scan path.
So how does JTAG apply to debugging? The JTAG interface provides excellent visibility into the internal workings of a target, with little to no overhead affecting normal system operation. JTAG signals can be daisy-chained among devices, giving access to any JTAG-enabled devices on a board, or more commonly in the present day to multiple modules on a single piece of silicon.
Another form of physical connection peculiar to Freescale (the company I work for) ColdFire devices, and previously Motorola CPU32/16 processors, is the serial interface to Background Debug Mode, or BDM2 [3]. The signal interface consists of data serial in (DSI), data serial out (DSO), data serial clock (DSCLK), breakpoint, and reset.
In later versions there are also pins for trace data, system clock, and transfer acknowledge. Data is shifted in and out in 17 bit packets at a maximum clock rate of one-fifth the core processor speed. Machine states are dictated by specific BDM commands, but the general flow is illustrated in Figure 3 below.

Figure 3. BDM Command Sequence Diagram
Layer 2: The Controller Layer
Similar to the way the OSI model data link layer offers a measure of error detection and ease of interfacing, the next layer up in the embedded debug realm recognizes basic commands and performs rudimentary error reporting.
For example, in some architectures it is necessary to shift through the entire device scan chain to isolate particular register values. Since the JTAG scan chain is the least critical path in a design, it tends to be arbitrarily placed by circuit routing algorithms.
This means the JTAG layout can change between different revisions of a design. Moreover, the complete scan chain, since it encompasses every signal on the device, can be quite large on modern integrated circuits. The upshot is that in order to obtain, say, the contents of a 32-bit general-purpose register, thousands of bits must be shifted through the chain, slowing the overall debug process. All of these drawbacks are eloquently described by Craig Haller in his 1996 article, "The Zen of BDM" [4].
Chip designers have addressed this problem by subsetting the scan chain and providing higher-level controllers that extend the operation of the basic JTAG TAP. One such device is the On-Chip Emulation (OnCE) module found in Freescale DSPs4.
With OnCE, the JTAG instruction register command set is extended to provide functions for selecting a TAP in a multi-processor configuration, obtaining processor status, issuing processor debug requests, and multiplexing the data register scan path to further extend functionality and target accessibility.
For example, the OnCE is capable of performing arbitrary core instructions through a mechanism called instruction stuffing, where a core instruction encoding is literally stuffed into the execution pipeline. This is done by issuing an extended JTAG instruction ENABLE_ONCE, which tells the OnCE circuit to expect a data shift into the emulator control register (ECR, see Figure 4 below).
For each shift into the ECR, selected bits indicate: 1) whether a subsequent operation is to be a read or write, 2) whether or not the processor is to execute a shifted core instruction, 3) whether or not the processor is to exit debug mode after the subsequent operation, and 4) the offset to one of the myriad OnCE registers to be read or written, if applicable.
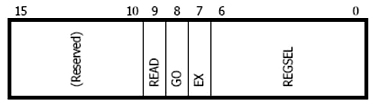
Figure 4. OnCE Emulator Control Register
For the case of a stuffed instruction, the hexadecimal sequence 17E is shifted through the DR scan chain into the ECR, indicating a write to the OnCE CORE_CMD register, execution of the instruction written, and a return to debug mode thereafter. The following DR scan shifts the encoding into the CORE_CMD register, and the instruction is executed.
Any results from the instruction can be retrieved by moving the data into the OnCE ETRSMT register and shifting out from there. The OnCE has registers for supporting high-level debugging tasks such as hardware breakpoints, watchpoints, and instruction tracing.
Another example at this layer is the previously-mentioned BDM controller on ColdFire processors. The BDM controller provides a rich set of commands for performing familiar debugging tasks (see Figure 5 below).
This command set is reminiscent of the commands found in older ROM monitors, but the BDM controller is much less intrusive than a monitor program. Note that some operations can be done in parallel with normal system operation, or by stealing cycles during memory accesses.
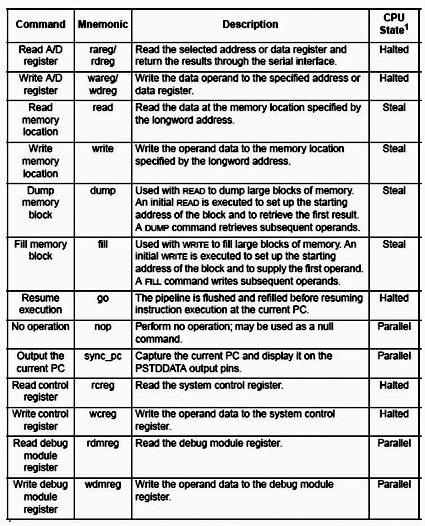
Figure 5. BDM Command Summary
Layer 3: The Driver Layer
The TAP and controller layers reside completely on the target. At the next layer, we leave the target for functionality on the host or, more commonly, on an intermediary device variously called an emulator probe, command translator, or protocol converter.
Similar to the routers that inhabit the corresponding OSI network layer, protocol converters are special-purpose computers with firmware stacks for deserializing target bit streams and communicating over a general-purpose network to a host.
Commercial examples of protocol converters include ARM's RealView ICE, Green Hills Probe, Abatron's BDI 2000, P&E's Cyclone MAX, Lauterbach's ICD, Ashling's Opella, and Freescale's Ethernet TAPand USBTAP.
The driver layer interacts directly with the target, modulating the clocked signals and buffering and assimilating bit streams into aggregate data blocks. Protocol converters generally have an FPGA or similar device which actually does the work of clocking and latching the signals for consumption by the target or driver firmware. The driver firmware then buffers values for use by the FPGA or other firmware modules.
Layer 4: The Device Template Layer
Just like the driver layer, the device template layer can reside either on the host or a separate probe device. Templates encapsulate the highest level of run-control abstraction specific to the debugged target. Template interfaces resemble standard debug command sets such as those supported by ColdFire BDM, but they have internal knowledge of a particular processor core and its relationship to the TAP driver and controller (Figure 6 below).

Figure 6. Sample Generic Template Functions
The template knows about internal core register numbering, core JTAG IR and bypass lengths, and initialization sequences to commence interaction with the target. Additionally, the template can provide optimizations for multiple register retrieval and memory operations, in particular high-speed download services.
Templates are usually implemented as shared or dynamically-linked libraries that can be loaded as needed by the host or interface device. This is useful in cases where a target consists of multiple heterogeneous cores, where arbitrary combinations of core functionality are possible.
Hybrid forms of templates make it easier to handle special device cases. A filtered template is analogous to a C++ virtual function in that it augments or selectively replaces functionality in an existing template. For example, a device might need to change its JTAG speed in a particular system, and this could be built as a lightweight filter on top of a standard template for the device.
Another special-purpose type of template is an SOC template that assumes an underlying set of cores that can be controlled as a group or subgroup. Such a template would be useful where a single stop command directed to the SOC template would put all of the cores in debug mode as quickly and efficiently as possible, i.e. by scanning out debug requests as JTAG IR commands to all cores simultaneously. Go and even step commands could be handled similarly.
Layer 5: The Communications Protocol Layer
In the OSI model, the session layer manages connections between host computers using mechanisms such as pipes and sockets. In the embedded debug world, a debugger host may be separated from its target by rooms, buildings, cities, or continents. It is useful to have a layer that manages these distances and multiple connections as well.
The communications layer is often implemented as a standalone server that listens for debug requests on a network socket address and either forwards the request to another server instance or dispatches the command to an underlying target probe device.
The GNU Debugger [5] provides a mechanism for doing this in gdbserver. Gdbserver uses a remote serial protocol made up of request and reply packets. The packets themselves are comprised of ASCII character sequences representing debugger commands and target responses.
Assume a protocol converter running the Linux operating system. Gdbserver runs as a process on the probe, listening for connection requests on an arbitrary port number.
A host specifies the IP address of the probe and the agreed-upon port number and a connection is established. The host then sends debug commands as remote serial protocol packets.
Gdbserver decodes these packets and either passes the information to an FPGA driver or another process that handles target debug interactions. Gdbserver can also be used to debug processes and applications running on the probe itself!
Another variation of a debugger server is Freescale's CodeWarrior Connection Server which uses a proprietary protocol encapsulated in an API to obtain debug information about the target. A host debugger uses the API to establish a connection with the target via a probe device, configure target characteristics, and perform basic debugging tasks including resetting the target.
As a troubleshooting aid to avoid always programmatically accessing the target, it includes a TCL interface that is implemented as a command console (see Figure 7 below). The commands correspond to the debugger server API calls, and logging capabilities make it possible to reconstruct troublesome debugging sequences.
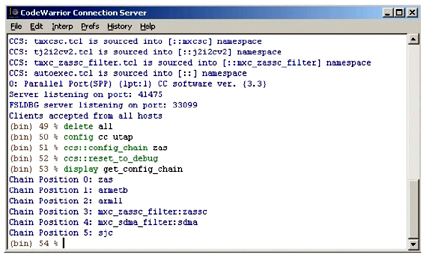
Figure 7. CodeWarrior Connection Server Console Window
Layer 6: The Debug Layer
The OSI presentation layer is responsible for insuring that session layer data is formatted or otherwise repackaged for efficient use by the application layer. Some of these tasks are performed in the corresponding debug layer, but this layer also comprises the focus of functionality in the debug interconnect framework. When people refer to a particular debugger, such as CodeWarrior or GDB, this layer represents the bulk of what they mean.
The debug layer consists of most of the familiar abstractions associated with debuggers: support for setting breakpoints and watchpoints, single stepping with source file mappings, register access by name, formatted memory retrieval, target reset and run control.
At this level there is intimate familiarity with the target in terms of memory layout and processor initialization, but there is also knowledge of program files, object formats, and symbols. The domain of the debug layer is always on the host machine.
This layer may additionally encompass selected extensions to basic functionality, such as project support or source control access mechanisms. Trace data collection, presentation, and assimilation underlie clever innovations such as CodeWarrior CodeTest or Green Hills Time Machine.
The debug layer handles any connection operations from the host side, e.g. what protocol converter if any, probe IP address or other identifier, server or direct-connect interaction, and debug clock speed. The debugger must be capable of reading and loading object files, exporting transportable versions of object code, and providing disassembly of program code in memory.
Layer 7: The Application Layer
In the debug interconnect framework, the closest analog to the OSI application layer is the GUI or command window, the access point or user interface to the debug layer. This may be implemented as a custom integrated development environment (IDE) or provided through a third-party offering such as Eclipse [7] or Tcl/Tk [8].
For example, in GDB the application layer can range from a simple command line interface, to the Insight [9] front-end from Red Hat and Cygnus Solutions, to DDD [10], theData Display Debugger.
For the latest incarnation of the CodeWarrior debugger, a proprietary front-end ("CodeWarrior Classic") was replaced with a custom Eclipse-based GUI. This makes it possible to provide all of the functionality users have come to expect from the debugger, while benefiting from improvements offered by the open-source community. There is also a development discipline in the Eclipse world which insures that applications will not stray too far from a standard Eclipse look-and-feel expected by users.

At this layer, too, the GUI can not only accommodate debugger functionality but other development operations as well, becoming a true IDE that brings together building tools (editors, compilers, linkers), source control programs (CVS, Subversion, Clearcase), and bug reporting systems inside the debug framework.
Broad-based integration such as this, combined with bottom-up integration of the debug interconnect model, comprise a powerful and flexible development environment for embedded systems.
References:
1. Hubert Zimmermann, "OSI Reference Model — The ISO Model of Architecture for Open Systems Interconnection", IEEE Transactions on Communications, April 1980.
2. Freescale Semiconductor, "11.5 Background Debug Mode (BDM)", ColdFire CF4e CoreUser's Manual, V4ECFUM/D, Rev. 0, 06/2001.
3. Craig Haller, "The Zen of BDM", Macraigor Systems, Inc. 1996.
4. StarCore LLC, OCE30 Architecture Specification, Rev. 03.02, April 5, 2006.
5. Free Software Foundation, Inc., "Debugging with GDB", Ninth Edition, GDB Version 6.6.50.20070518.
6. O. Gruber, et. al., "The Eclipse 3.0 platform: Adopting OSGi technology", IBM Systems Journal, Vol. 44, No. 2, 2005.
7. John K. Ousterhout, Tcl and the Tk Toolkit, Addison-Wesley, Reading, MA, USA, ISBN 0-201-63337-X, 1994.
8. "Insight: The GDB GUI."
9. "DDD: Data Display Debugger."
Using an open debug interconnect model to simplify embedded systems design的更多相关文章
- 对Design model的理解与Java design model的归纳
设计模式的起源是面向对象程序设计思想,是面向对象设计的精髓--抽象.面向对象通过类和对象来实现抽象,实现时产生了面向对象的三个重要机制:封装.继承.多态.正是这三个机制衍生出了各种各样的设计模式.在面 ...
- (转) [it-ebooks]电子书列表
[it-ebooks]电子书列表 [2014]: Learning Objective-C by Developing iPhone Games || Leverage Xcode and Obj ...
- 泡泡一分钟:Cubic Range Error Model for Stereo Vision with Illuminators
Cubic Range Error Model for Stereo Vision with Illuminators 带有照明器的双目视觉的三次范围误差模型 "链接:https://pan ...
- Swift - 从字典(或者Alamofire)直接创建Model文件的工具
Swift - 从字典(或者Alamofire)直接创建Model文件的工具 效果 1. 常规生成model的方式 2. 通过debug创建model的方式 特性 1. 可以处理JSON格式的字典数据 ...
- Chrome Service Model
Chrome Service Model John Abd-El-Malek February 2016 Objective Move Chrome codebase towards a servic ...
- ADF_Database Develop系列1_通过UML数据库开发之建Logical UML Class Model
2013-05-01 Created By BaoXinjian
- selenium page object model
Page Object Model (POM) & Page Factory in Selenium: Ultimate Guide 来源:http://www.guru99.com/page ...
- 推荐系统中的Graph Model
转自:http://www.cnblogs.com/wentingtu/archive/2012/05/28/2521166.html 推荐中对graph model的研究主要有两个方面,一个是如何构 ...
- ARM architecture
http://en.wikipedia.org/wiki/ARM_architecture ARM architecture ARM architectures The ARM logo De ...
随机推荐
- Apache虚拟主机配置(多个域名访问多个目录)(转)
Apache虚拟主机配置(多个域名访问多个目录) 为了方便管理虚拟主机,我决定使用一种方法,那就是修改httpd-vhosts.conf文件. 第一步首先要使扩展文件httpd-vhosts.conf ...
- 在flask中返回requests响应
在flask服务端,有时候需要使用requests请求其他url,并将响应返回回去.查阅了flask文档,About Responses,可以直接构造响应结果进行返回. If a tuple is r ...
- Hadoop(一):概述
一.Hadoop是什么? Hadoop是一个由Apache基金会所开发的分布式系统基础架构.Hadoop框架最核心的设计包含两个方面,一是分布式文件系统(Hadoop Distributed File ...
- web项目更改文件后缀,隐藏编程语言
从Java EE5.0开始,<servlet-mapping>标签就可以配置多个<url-pattern>.例如可以同时将urlServlet配置一下多个映射方式: <s ...
- #include<stdarg.h> 可变参数使用
今天上计算方法这课时觉得无聊至极,于是拿出C++编程之道来看了看..无意之中看到了#include<stdarg.h> va_list,va_start,va_end等东西,不知是怎么用的 ...
- FPGA 17最佳论文导读 ESE: Efficient Speech Recognition Engine with Compressed LSTM on FPGA
欢迎转载,转载请注明:本文出自Bin的专栏blog.csdn.net/xbinworld. 技术交流QQ群:433250724,欢迎对算法.机器学习技术感兴趣的同学加入. 后面陆续写一些关于神经网络加 ...
- GLASNICI 解题报告
GLASNICI 解题报告 题目描述 有N个人在一直线上,第i个人的位置为Di,满足Di≤Di+1.最初只有第1个人(在最左边)知道消息. 在任意时刻,每个人可以以每秒1单位的速度向左或向右移动,或者 ...
- linux中忘记root密码解决方案
方法一: 如果用户具有sudo权限,那么直接可以运行如下命令: #sudo su root #passwd #更改密码 或者直接运行sudo passwd root命令就可以直接更改root密码. 有 ...
- 转:Meltdown Proof-of-Concept
转:https://github.com/IAIK/meltdown Meltdown Proof-of-Concept What is the difference between Meltdown ...
- XV6操作系统代码阅读心得(一):启动加载、中断与系统调用
XV6操作系统是MIT 6.828课程中使用的教学操作系统,是在现代硬件上对Unix V6系统的重写.XV6总共只有一万多行,非常适合初学者用于学习和实践操作系统相关知识. MIT 6.828的课程网 ...