
golang 性能剖析pprof
作为一个golang coder,使用golang编写代码是基本的要求。
能够写出代码,并能够熟悉程序执行过程中各方面的性能指标,则是更上一层楼。
如果在程序出现性能问题的时候,可以快速定位和解决问题,那么写起代码来,会更加自信。
本文介绍的pprof,是golang 自带性能剖析工具,可以帮助定位程序中可能存在的问题。
1.profile文件的收集
pprof使用profile文件进行性能分析,profile文件是应用程序执行状态的数据。
收集profile文件有两种方式,对应go 语言提供的 runtime/pprof 和 net/http/pprof 两个库。
1.1 runtime/pprof
一般用于应用程序执行一段时间后,就会结束的情况。
例如,进行CPU profiling:
f, err := os.Create(*cpuprofile)

...

pprof.StartCPUProfile(f)

defer pprof.StopCPUProfile()
应用程序启动时开始收集,应用程序结束后,就生成一个文件。
再例如,进行Mem profiling:
f, err := os.Create(*memprofile)

pprof.WriteHeapProfile(f)

f.Close()
生成一个mem profile文件。
1.2 net/http/pprof
这种方式主要用于程序一直在跑的场景。
如果使用了默认的 http.DefaultServeMux(通常是代码直接使用 http.ListenAndServe("0.0.0.0:8000", nil)),只需要添加一行:
import _ "net/http/pprof"
如果你使用自定义的 Mux,则需要手动注册一些路由规则:
r.HandleFunc("/debug/pprof/", pprof.Index)

r.HandleFunc("/debug/pprof/cmdline", pprof.Cmdline)

r.HandleFunc("/debug/pprof/profile", pprof.Profile)

r.HandleFunc("/debug/pprof/symbol", pprof.Symbol)

r.HandleFunc("/debug/pprof/trace", pprof.Trace)
不管哪种方式,你的 HTTP 服务都会多出 /debug/pprof endpoint,访问它会得到类似下面的内容:
/debug/pprof/

profiles:

0    block

62    goroutine

444    heap

30    threadcreate

full goroutine stack dump
下面的演示中,使用的例子代码如下:
/*simple.go*/

package main

import (

        "log"

        _ "net/http/pprof"

        "net/http"

        "time"

)

func main() {

        go func() {

                log.Println(http.ListenAndServe("localhost:6060", nil))

        }()

        go worker()

        select{}

}

// simple worker

func worker(){

        strSlice := []string{}

        for {

                str := "hello world "

                strSlice = append(strSlice, str)

                time.Sleep(time.Second)

        }

}
代码开始引入net/http/pprof,在端口6060启动http服务。
启动应用程序
go build simple.go

./simpe
2.pprof分析profiling数据
pprof分析profiling数据主要有两种方式:
- 交互式终端
- 页面显示
2.1 交互式终端
2.1.1 查看内存使用情况
使用heap profile查看内存使用情况。
go tool pprof http://localhost:6060/debug/pprof/heap

Fetching profile over HTTP from http://localhost:6060/debug/pprof/heap

Saved profile in /Users/lanyang/pprof/pprof.alloc_objects.alloc_space.inuse_objects.inuse_space.001.pb.gz

Type: inuse_space

Time: Sep 21, 2019 at 1:56pm (CST)

Entering interactive mode (type "help" for commands, "o" for options)

(pprof)

(pprof) top10

Showing nodes accounting for 514kB, 100% of 514kB total

      flat  flat%   sum%        cum   cum%

     514kB   100%   100%      514kB   100%  unicode.init

         0     0%   100%      514kB   100%  runtime.doInit

         0     0%   100%      514kB   100%  runtime.main

(pprof)
默认的Type是inuse_space,即常驻内存.
与之对应的是alloc_objects,表示临时分配的内存。
列出top10的内存占用。
2.1.2 查看CPU使用情况
使用cpu profile查看cpu使用情况。
例如查看过去30s的cpu profile
go tool pprof http://localhost:6060/debug/pprof/profile?seconds=30

Fetching profile over HTTP from http://localhost:6060/debug/pprof/profile?seconds=30

Saved profile in /Users/lanyang/pprof/pprof.samples.cpu.001.pb.gz

Type: cpu

Time: Sep 21, 2019 at 2:19pm (CST)

Duration: 30s, Total samples = 0

No samples were found with the default sample value type.

Try "sample_index" command to analyze different sample values.

Entering interactive mode (type "help" for commands, "o" for options)

(pprof)
2.1.3 保存profile文件
从pprof使用上看,是首先保存profile文件,再进行分析的。
在一些场景,例如在线上环境,最好先保存profile,然后拿到线下做分析。
将profile文件保存下来:
wget  http://localhost:6060/debug/pprof/heap

--2019-09-21 15:20:17--  http://localhost:6060/debug/pprof/heap

正在解析主机 localhost (localhost)... ::1, 127.0.0.1

正在连接 localhost (localhost)|::1|:6060... 失败:Connection refused。

正在连接 localhost (localhost)|127.0.0.1|:6060... 已连接。

已发出 HTTP 请求,正在等待回应... 200 OK

长度:1162 (1.1K) [application/octet-stream]

正在保存至: “heap”

heap                                         100%[============================================================================================>]   1.13K  --.-KB/s  用时 0s

2019-09-21 15:20:17 (111 MB/s) - 已保存 “heap” [1162/1162])

ll

-rw-r--r--  1 lanyang  staff   1.1K  9 21 15:20 heap
然后使用pprof进行分析,其中,./simple是可执行文件,用于解析各种符号,./heap是刚才获取到的profile文件。
go tool pprof ./simple ./heap

Type: inuse_space

Time: Sep 21, 2019 at 3:20pm (CST)

No samples were found with the default sample value type.

Try "sample_index" command to analyze different sample values.

Entering interactive mode (type "help" for commands, "o" for options)

(pprof)
2.2 页面显示
2.2.1 浏览器打开pprof页面
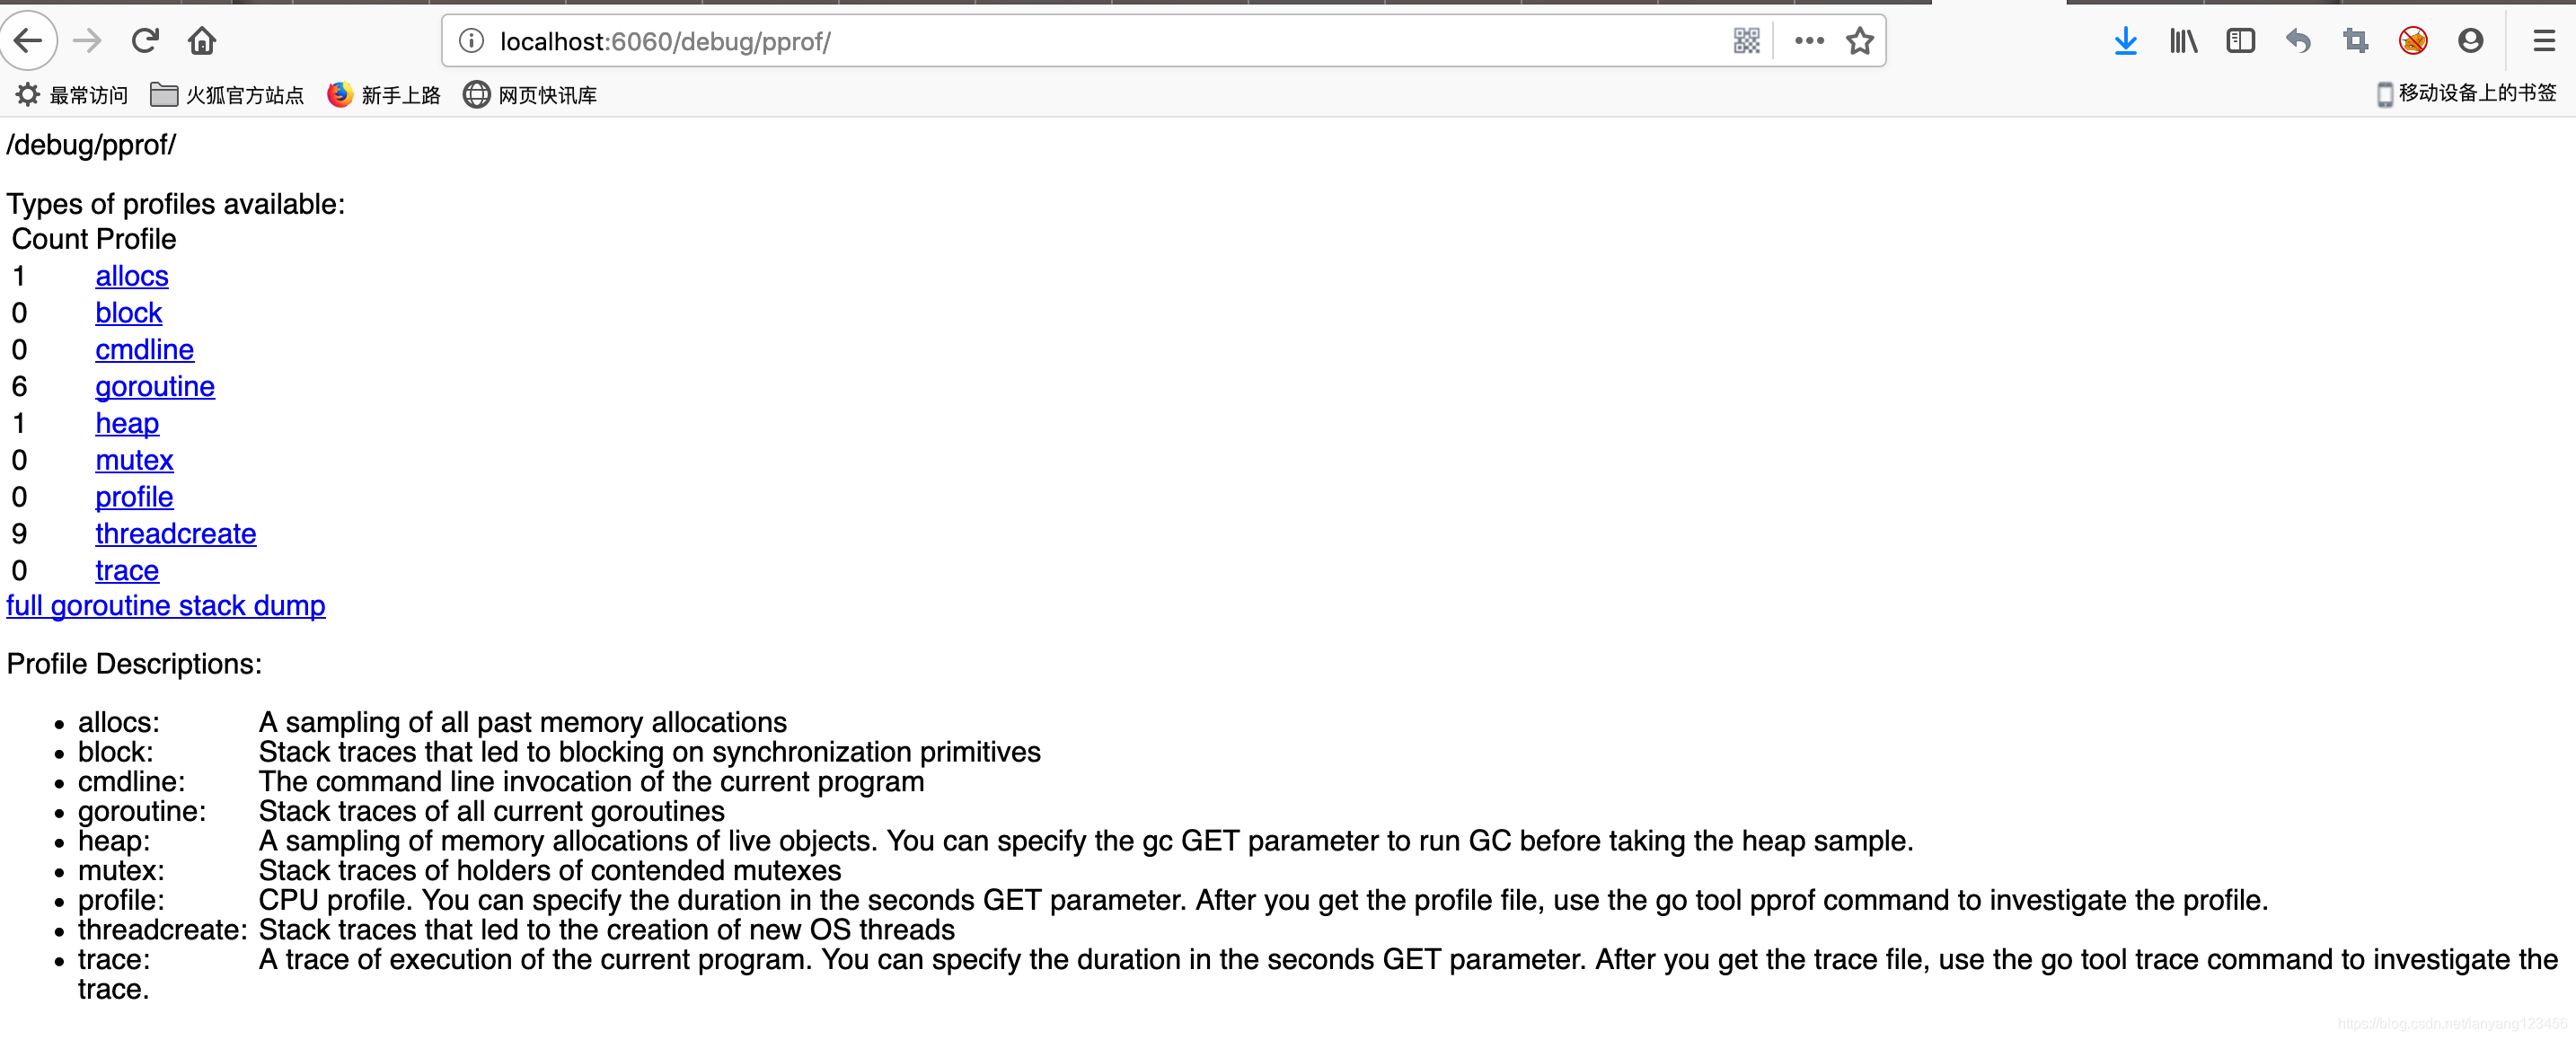
浏览器中打开http://localhost:6060/debug/pprof/
如图所示,列出了很多监控项,
 Profile Descriptions:

allocs:

A sampling of all past memory allocations

block:

Stack traces that led to blocking on synchronization primitives

cmdline:

The command line invocation of the current program

goroutine:

Stack traces of all current goroutines

heap:

A sampling of memory allocations of live objects. You can specify the gc GET parameter to run GC before taking the heap sample.

mutex:

Stack traces of holders of contended mutexes

profile:

CPU profile. You can specify the duration in the seconds GET parameter. After you get the profile file, use the go tool pprof command to investigate the profile.

threadcreate:

Stack traces that led to the creation of new OS threads

trace:

A trace of execution of the current program. You can specify the duration in the seconds GET parameter. After you get the trace file, use the go tool trace command to investigate the trace.
可以通过链接跳转到对应界面。
2.2.2. 更详细的页面显示
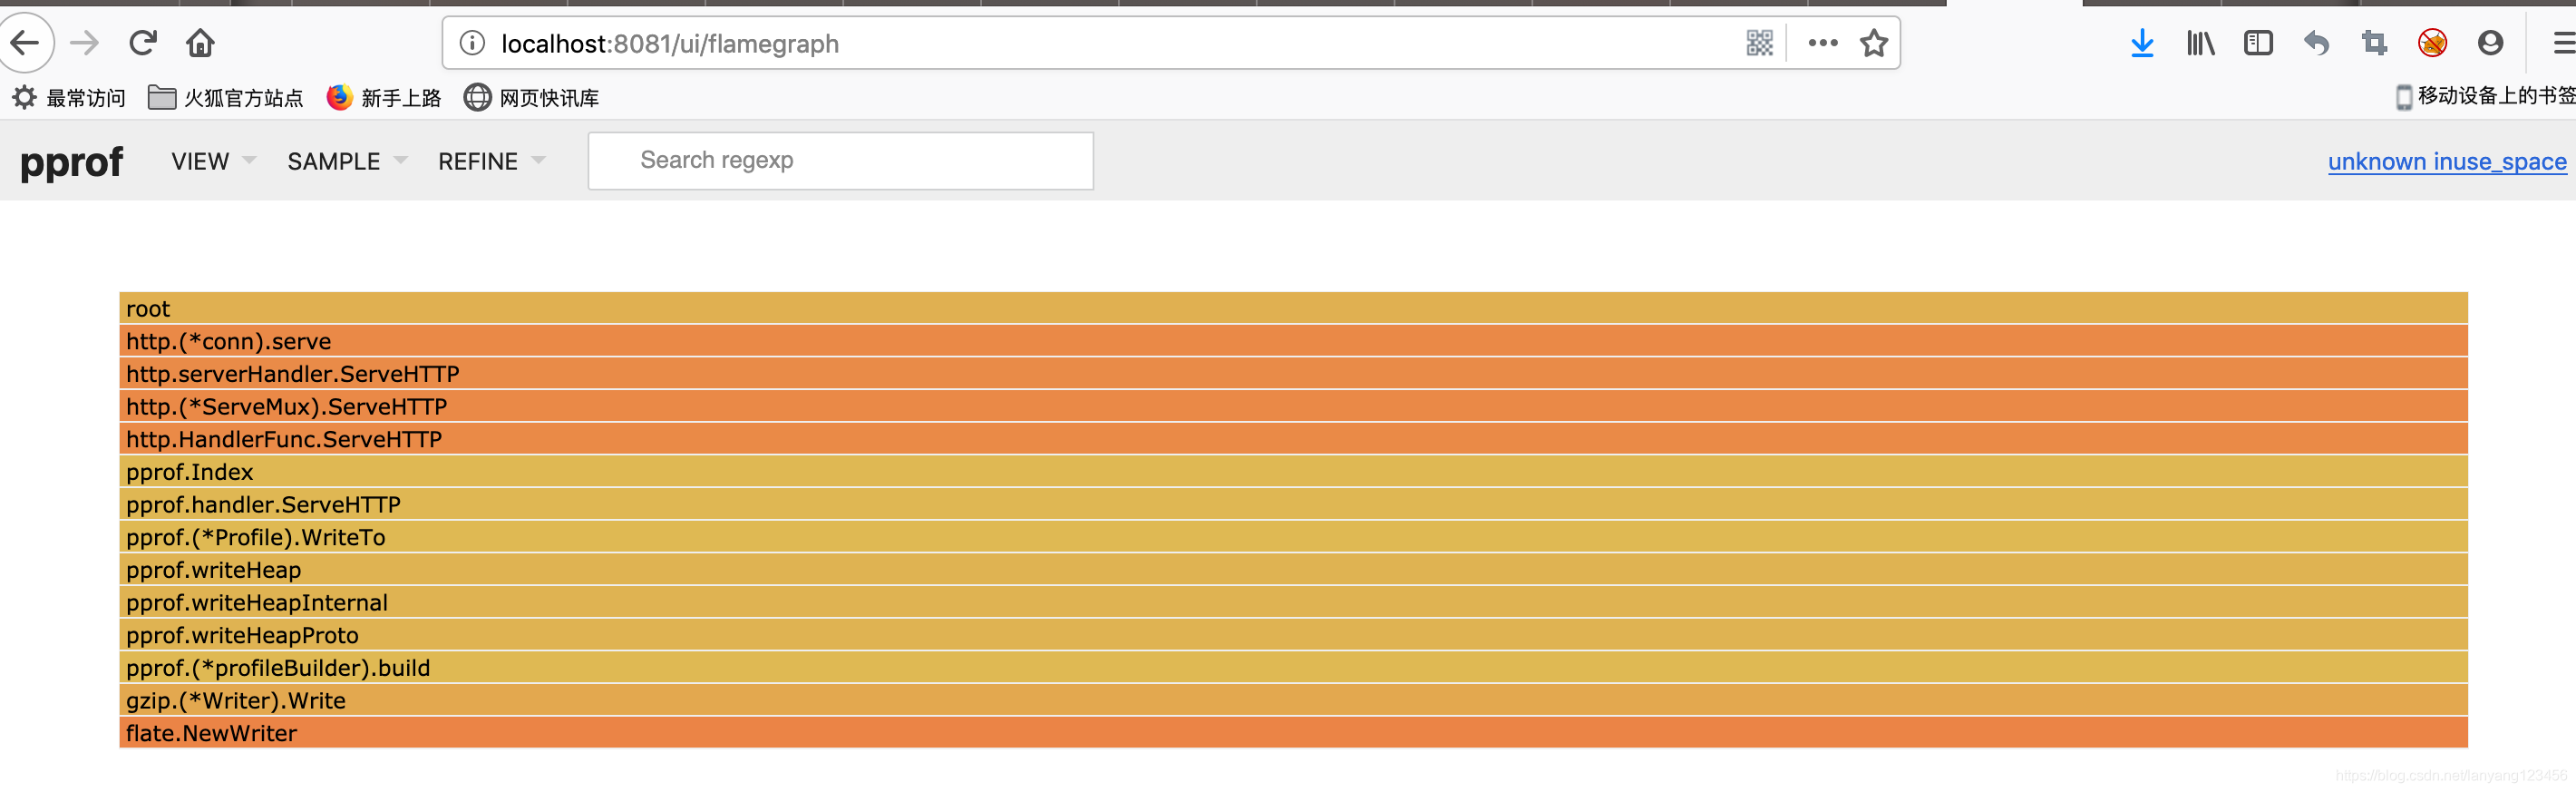
go 从1.11开始的pprof提供了更丰富性能数据展示方式,包括火焰图,直接使用如下命令:
$ go tool pprof -http=":8081" [binary] [profile]
会打开浏览器页面。
端口可以自己选择,这里使用了8081。
binary是应用程序的可执行文件,读取符号信息。
profile 是profile文件,可以是本地文件,或者http地址。
例如,使用本地保存的profile文件:
$ go tool pprof -http=":8081" ./simple ./heap
或者,通过http 的profile:
go tool pprof -http=":8081" ./simple  http://localhost:6060/debug/pprof/heap

Fetching profile over HTTP from http://localhost:6060/debug/pprof/heap

Saved profile in /Users/zhangyunyang/pprof/pprof.simple.alloc_objects.alloc_space.inuse_objects.inuse_space.001.pb.gz

Serving web UI on http://localhost:8081
火焰图如图所示,示例代码比较简单,所以火焰图不是很明显。
如果不能使用go1.11,则可以使用最新的pprof工具:
# Get the pprof tool directly

$ go get -u github.com/google/pprof

$ pprof -http=":8081" [binary] [profile]
3.参考
golang 性能剖析pprof的更多相关文章
- golang 性能调优分析工具 pprof (上)
一.golang 程序性能调优 在 golang 程序中,有哪些内容需要调试优化? 一般常规内容: cpu:程序对cpu的使用情况 - 使用时长,占比等 内存:程序对cpu的使用情况 - 使用时长,占 ...
- golang 性能调优分析工具 pprof(下)
golang 性能调优分析工具 pprof(上)篇, 这是下篇. 四.net/http/pprof 4.1 代码例子 1 go version go1.13.9 把上面的程序例子稍微改动下,命名为 d ...
- golang 性能优化分析:benchmark 结合 pprof
前面 2 篇 golang 性能优化分析系列文章: golang 性能优化分析工具 pprof (上) golang 性能优化分析工具 pprof (下) 一.基准测试 benchmark 简介 在 ...
- Golang 性能优化实战
小结: 1. 性能查看工具 pprof,trace 及压测工具 wrk 或其他压测工具的使用要比较了解. 代码逻辑层面的走读非常重要,要尽量避免无效逻辑. 对于 golang 自身库存在缺陷的,可以寻 ...
- 快速学习C语言二: 编译自动化, 静态分析, 单元测试,coredump调试,性能剖析
上次的Hello world算是入门了,现在学习一些相关工具的使用 编译自动化 写好程序,首先要编译,就用gcc就好了,基本用法如下 gcc helloworld.c -o helloworld.o ...
- C++ 性能剖析 (一)
C++ 性能剖析 (一) 性能问题也不是仅仅用“技术”可以解决的,它往往是架构,测试,假设等综合难题.不过,对于一个工程师来说,必须从小做起,把一些“明显”的小问题解决.否则的话积小成多,千里堤坝,溃 ...
- PDF.NET开发框架性能剖析
PDF.NET开发框架性能剖析 前俩天发布了 关于PDF.NET开发框架对Mysql Sqlite PostgreSQL数据库分页支持的个人看法 ,说明了本人对框架的一些介绍和看法.今天我们一起思考一 ...
- ANTS Performance Profiler 8:支持对Web请求、异步代码和WinRT的性能剖析
下载与激活:http://download.csdn.net/detail/lone112/6734291 离线激活 位于英国的Red Gate Software有限公司最近发布了ANTS Per ...
- MySQL性能剖析工具(pt-query-digest)【转】
这个工具同样来自percona-toolkit 该工具集合的其他工具 MySQL Slave异常关机的处理 (pt-slave-restart) 验证MySQL主从一致性(pt-table-chec ...
随机推荐
- Spring AOP的理解和使用
AOP是Spring框架面向切面的编程思想,AOP采用一种称为“横切”的技术,将涉及多业务流程的通用功能抽取并单独封装,形成独立的切面,在合适的时机将这些切面横向切入到业务流程指定的位置中. 掌握AO ...
- 1、Bash Shell
一.什么是Bash shell BashShell是一个命令解释器,它在操作系统的最外层,负责用户程序与内核进行交互操作的一种接口,将用户输入的命令翻译给操作系统,并将处理后的结果输出至屏幕. 当我们 ...
- 海康RTSP取流URL格式
预览取流url [海康威视]举例说明: 主码流取流: rtsp://admin:12345@192.0.0.64:554/h264/ch1/main/av_stream 子码流取流: rtsp://a ...
- Redis01——Redis产生背景
Redis 产生背景 1.1.数据存储的发展史 1.1.1.磁盘时代 很久之前,我们的数据存储方式是磁盘存储,每个磁盘都有一个磁道.每个磁道有很多扇区,一个扇区接近512Byte. 磁盘的寻址速度是毫 ...
- java8学习之深入函数式接口与方法引用
函数式接口: 函数式接口[FunctionalInterface]是整个Lambda表达式的一个根源,换句话来说java8中的Lambda表达式要想彻底掌握,前提是要彻底理解好函数式接口,所以这次继续 ...
- python在pycharm中导包一直出错的问题
之前的net在code的子目录中,怎么调试都无法解决.最后用一个简单粗暴的方式,将net直接拿到项目的根目录中.如此即可
- MQTT 入门介绍——菜鸟教程
一.简述 MQTT(Message Queuing Telemetry Transport,消息队列遥测传输协议),是一种基于发布/订阅(publish/subscribe)模式的"轻量级& ...
- php类知识 self $this都只能在当前类中使用
$this是当前对象的指针,self是当前类的指针 $this只能用在成员方法中,不能存在于静态方法 self 静态方法和成员方法中都能使用 self可以访问类常量,静态属性,静态方法,成员方法--- ...
- node的http与前端交互示例(入门)
一.目录(node_modules是npm install后新增的) node 和 npm 版本 npm install http 二.node下的index.js var http = requir ...
- oracle rowtype
v_customer customerinfo%rowtype; select * into v_customer from customerinfo where guid = v_loan.cust ...