matplotlib.pyplot 导引
matplotlib.pyplot 是采用 python 语言和使用数值数学库 numpy 数组数据的绘图库.其主要目标是用于数据的可视化显示.
输出图形组成
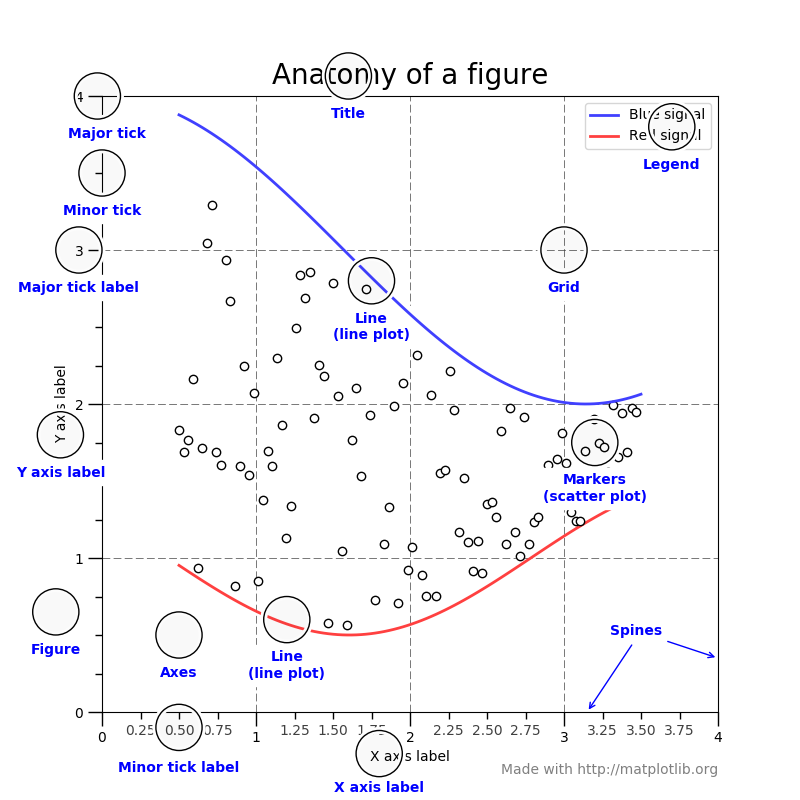
matplotlib.pyplot 模块中,其绘制的输出图形 (Figure) 的各组成部分,如下图所示
其中
Figure 是整个输出图形,记录了所有子 Axes 对象,一些特殊的 artists (如标题,图例等) 和画布 (canvas).画布 (canvas) 对用户是不可见的.
Axes 是含有数据空间的图像区域.一个 figure 可以包含多个 Axes,但一个给定的 Axes 只能在一个 Figure 中.注意 Axes 与 Axis 的区别,Axis是指数学上的坐标轴,Axes可以包含 2 个 (二维) 或 3 个坐标轴 (三维).在 matplotlib 模块中,matplotlib.axes.Axes类,包含大多数的图形元素,如坐标轴 (matplotlib.axis.Axis), 刻度 (matplotlib.axis.Tick), 二维线段 (matplotlib.lines.Line2D), 文本 (matplotlib.text.Text), 多边形 (matplotlib.patches.Polygon),并设置坐标系统;matplotlib.pyplot.axes(arg=None, **kwargs) 函数向当前的图形 (current figure) 中,增加一个 Axes 对象,并设置其为当前的 Axes 对象;matplotlib.pyplot.axis(*v, **kwargs) 函数用于获取或设置坐标轴属性.
在 Figure 上的任何对象,基本都是 Artist.当渲染图形时,所有的 Artists 都会画到画布 (canvas) 上.大多数 Artists 都绑定到一个 Axes 上,不能被多个 Axes 共享,或从一个 Axes 移动到另一个.
编码风格
使用 matplotlib.pyplot 模块,通常有两种编码风格,一种是采用面向对象接口 (object-oriented interface) 的编码风格,另一种是类似 MATLAB (MATLAB-like) 的编码风格.对于复杂的图形绘制,推荐采用面向对象接口的编码风格.
- 面向对象编码风格的示例代码,如下所示.
import matplotlib.pyplot as plt

import numpy as np

x = np.arange(0, 10, 0.2)

y = np.sin(x)

fig = plt.figure()

ax = fig.add_subplot(111)

ax.plot(x, y)

plt.show()
上述代码中,使用 pyplot 创建和显示图形,剩下的使用对象方法实现,其中 ax 对象是 Axes 类的对象.对于 matplotlib.pyplot 模块,Axes 类和它的成员函数使用面向对象接口的主要入口点.
- 类似 MATLAB 的编码风格的示例代码,如下所示
import matplotlib.pyplot as plt

import numpy as np

x = np.arange(0, 10, 0.2)

y = np.sin(x)

plt.figure()

plt.subplot(111)

plt.plot(x, y)

plt.show()
pylab 和 pyplot 关系
matplotlib.pyplot 是 matplotlib 模块中的一个模块;pylab 是安装 matplotlib 模块时附带安装的模块.
pylab 是一个带来便利的模块,其可以在单一的命名空间 (pylab namespace) 下导入用于绘图的 matplotlib.pyplot 模块和用于数值数学和操作数组的 numpy 模块.虽然有许多例子使用 pylab,但不再推荐使用.其示例代码,如下所示:
import pylab

x = pylab.arange(0, 10, 0.2)

y = pylab.sin(x)

fig = pylab.figure()

ax = fig.add_subplot(111)

ax.plot(x,y)

pylab.show()
参考资料
1. Usage - The Matplotlib FAQ. https://matplotlib.org/faq/usage_faq.html.
2. matplotlib.pyplot - The Matplotlib API. https://matplotlib.org/api/_as_gen/matplotlib.pyplot.html.
3. pyplot summary - The Matplotlib API. https://matplotlib.org/api/pyplot_summary.html.
4. Axes class - The Matplotlib API. https://matplotlib.org/api/axes_api.html#matplotlib.axes.Axes
5. matplotlib.pyplot.axes - matplotlib.pyplot. https://matplotlib.org/api/_as_gen/matplotlib.pyplot.axes.html#matplotlib.pyplot.axes
6. matplotlib.pyplot.axis - matplotlib.pyplot. https://matplotlib.org/api/_as_gen/matplotlib.pyplot.axis.html#matplotlib.pyplot.axis
7. Pyplot tutorials - Tutorials. https://matplotlib.org/tutorials/introductory/pyplot.html.
matplotlib.pyplot 导引的更多相关文章
- matplotlib.pyplot 绘图详解 matplotlib 安装
apt-get install python-matplotlib 转载自: http://www.cnblogs.com/qianlifeng/archive/2012/02/13/2350086. ...
- matplotlib.pyplot.hist
**n, bins, patches = plt.hist(datasets, bins, normed=False, facecolor=None, alpha=None)** ## 函数说明 用于 ...
- 数据分析之matplotlib.pyplot模块
首先都得导模块. import numpy as np import pandas as pd import matplotlib.pyplot as plt from pandas import S ...
- Python Matplotlib.pyplot plt 中文显示
话不多说,上代码 # -*- coding: UTF-8 -*- import matplotlib.pyplot as plt from matplotlib.font_manager import ...
- 在绘图的时候import matplotlib.pyplot as plt报错:ImportError: No module named '_tkinter', please install the python-tk package
在绘图的时候import matplotlib.pyplot as plt报错:ImportError: No module named '_tkinter', please install the ...
- Matplotlib.pyplot 把画图保存为图片
在plt.show()之前执行plt.savefig()函数即可. 简单例子: import matplotlib.pyplot as plt x=[1,2,3,4,5] y=[10,5,15,10, ...
- 使用numpy与matplotlib.pyplot画图
使用numpy与matplotlib.pyplot画图 1. 折线图 1 # -*- enccoding:utf-8 -*- 2 import numpy as np 3 import matplot ...
- 用matplotlib.pyplot画简单的折线图,直方图,散点图
#coding=utf-8 """ 用matplotlib.pyplot画简单的折线图,直方图,散点图 """ import matplot ...
- matplotlib.pyplot展示MNIST图片
import torch import torch.utils.data as Data import torchvision import torchvision.transforms as tra ...
随机推荐
- 一款开源免费的办公套件系统:DzzOffice详细部署
一.系统环境 个人建议centos 7 系统 cat /etc/redhat-release CentOS Linux release (Core) 基本更新 yum update -y 基本优化 关 ...
- android:activity知识点
一.活动流程 1.创建活动 public class firstActivity extends Activity{} 2.创建布局 新建first_layout.xml文件 3.注册活动 在andr ...
- OpenERP how to set the tree view limit
return { 'name':u'库存报表', 'view_type':'form', 'view_mode':'tree,form', 'res_model':'rainsoft.account. ...
- (转)GlusterFS 01 理论基础,企业实战,故障处理
https://jaminzhang.github.io/glusterfs/GlusterFS-01-Theory-Basis/--------GlusterFS 01 理论基础 https://j ...
- JavaScript数据结构-13.散列碰撞(开链法)
<!DOCTYPE html> <html> <head> <meta charset="UTF-8"> <title> ...
- 【扫盲】】32位和64位Windows的区别
用户购买windows安装盘或者重新安装操作系统的时候,通常会遇到这个问题,就是不知道该如何选择使用32位操作系统和64位操作系统,有人说64位系统速度快,其实理论上确实是这样,不过具体还要根据你的个 ...
- 关于rails中 rake db:create 失败的问题
提示信息: rake aborted!Could not find a JavaScript runtime. See https://github.com/sstephenson/execjsfor ...
- 汇编语言、与C语言、实现--汉诺塔--
题意描述: 用汇编语言实现汉诺塔.只需要显示移盘次序,不必显示所移盘的大小,例如: X>Z,X>Y,Z>Y,X>Z,..... (n阶Hanoi塔问题)假设有三个分别命名为 ...
- sql 解释顺序
from:全量数据, where:数据过滤,生成新的虚表.个人主观上理解,where中的条件,如果涉及到join中的表,则会移动到相应的on条件中,减少后续生成的虚表大小. join:根据on中的条件 ...
- Redis 的 Lua 脚本支持
Redis 2.6.0 内置的Lua Script支持,可以在Redis的Server端一次运行大量逻辑. 整个Script默认是在一个事务里的. Script里涉及的所有Key尽量用变量,从外面传入 ...