第八章 监控 Zabbix
1.1 YUM部署 Zabbix 2.4
1. 前期准备(省略)
l Yum源的配置
cd /etc/yum.repos.d/; mkdir old;mv ./* old/
rpm -Uvh https://mirror.webtatic.com/yum/el6/latest.rpm
wget -O /etc/yum.repos.d/CentOS-Base.repo http://mirrors.aliyun.com/repo/Centos-6.repo
wget -O /etc/yum.repos.d/epel.repo http://mirrors.aliyun.com/repo/epel-6.repo
yum clean all
yun list
l MySQL部署
rpm -e mysql-libs-5.1.66-2.el6_3.x86_64 --nodeps
yum install mysql55w-server.x86_64
/etc/init.d/mysqld start
mv /etc/yum.repos.d/webtatic* /etc/yum.repos.d/old
yum clean all
l OS 优化
2. 下载并安装Zabbix官方源(http://repo.zabbix.com/zabbix/)
rpm -ivh http://repo.zabbix.com/zabbix/2.4/rhel/6/x86_64/zabbix-release-2.4-1.el6.noarch.rpm
3. YUM安装Zabbix
yum -y install iksemel libssh2 zabbix-server-mysql zabbix-web-mysql zabbix-agent net-snmp-devel net-snmp-libs net-snmp-perl net-snmp-utils net-snmp
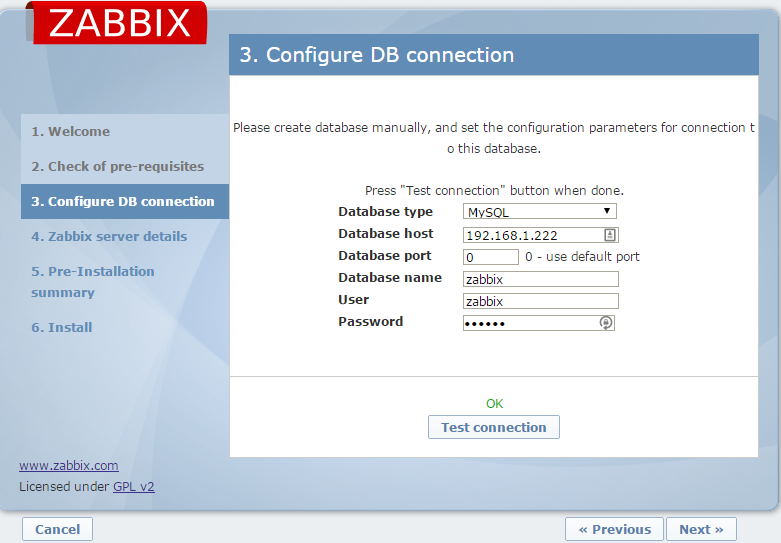
4. 创建Zabbix数据库及远程连接用户(服务端)
mysql -uroot-S /tmp/mysql.sock-e "create database zabbix character set utf8 collate utf8_bin;"
mysql -uroot-S /tmp/mysql.sock -e "grant all privileges on zabbix.* to zabbix@'10.1.1.%' identified by 'zabbix'; flush privileges;"
5. 导入Zabbix基础数据并启动Zabbix
cd /usr/share/doc/zabbix-server-mysql-2.4.*/create/
mysql -uroot-S /tmp/mysql.sock zabbix < schema.sql
mysql -uroot-S /tmp/mysql.sock zabbix < images.sql
mysql -uroot-S /tmp/mysql.sock zabbix < data.sql
6. Zabbix_Server配置文件
DBHost/DBSocket参数根据需要进行修改
sed -i 's/^.*DBPassword=.*$/DBPassword=zabbix/' /etc/zabbix/zabbix_server.conf
缺一键修改
egrep -v '(^$|\#)' /etc/zabbix/zabbix_server.conf
LogFile=/var/log/zabbix/zabbix_server.log
LogFileSize=0
PidFile=/var/run/zabbix/zabbix_server.pid
DBHost=192.168.1.222
DBName=zabbix
DBUser=zabbix
DBPassword=zabbix
DBSocket=/tmp/mysql.sock
SNMPTrapperFile=/var/log/snmptt/snmptt.log
AlertScriptsPath=/usr/lib/zabbix/alertscripts
ExternalScripts=/usr/lib/zabbix/externalscripts
启动zabbix服务
service zabbix-server start
service zabbix-agent start
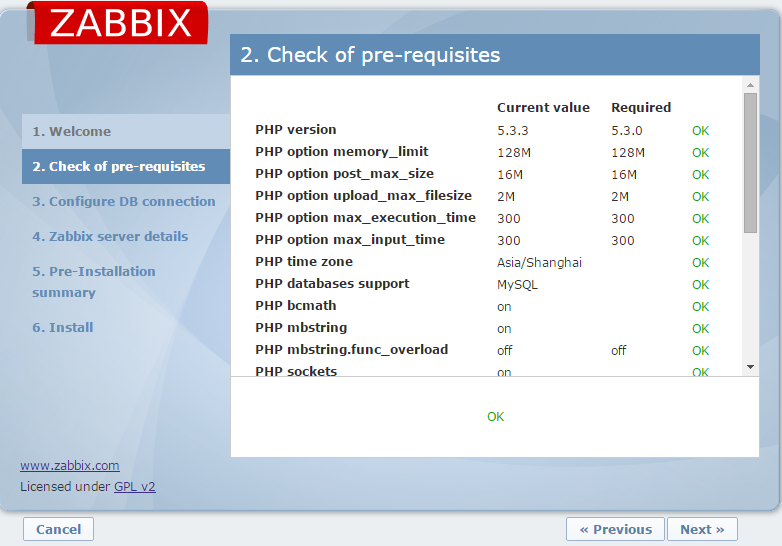
7. 调整PHP配置(php.ini)
sed -i 's/^.*date.timezone =.*$/date.timezone = Asia\/Shanghai/g' /etc/php.ini
sed -i 's/^.*post_max_size =.*$/post_max_size = 16M/g' /etc/php.ini
sed -i 's/^.*max_execution_time =.*$/max_execution_time = 300/g' /etc/php.ini
sed -i 's/^.*max_input_time =.*$/max_input_time = 300/g' /etc/php.ini
sed -i 's/^.* memory_limit =.*$/memory_limit = 128M/g' /etc/php.ini
service httpd restart
8. 配置服务开机启动
chkconfig zabbix-server on
chkconfig zabbix-agent on
chkconfig httpd on
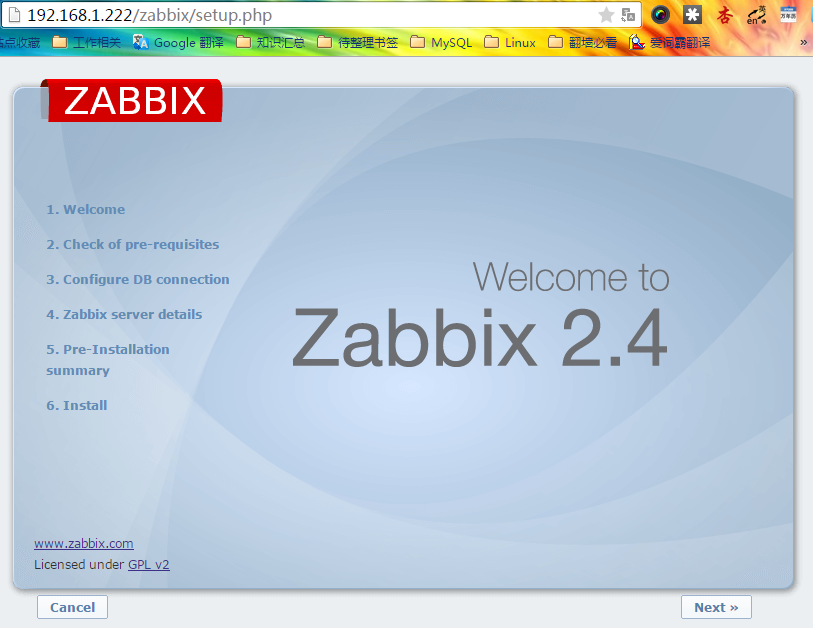
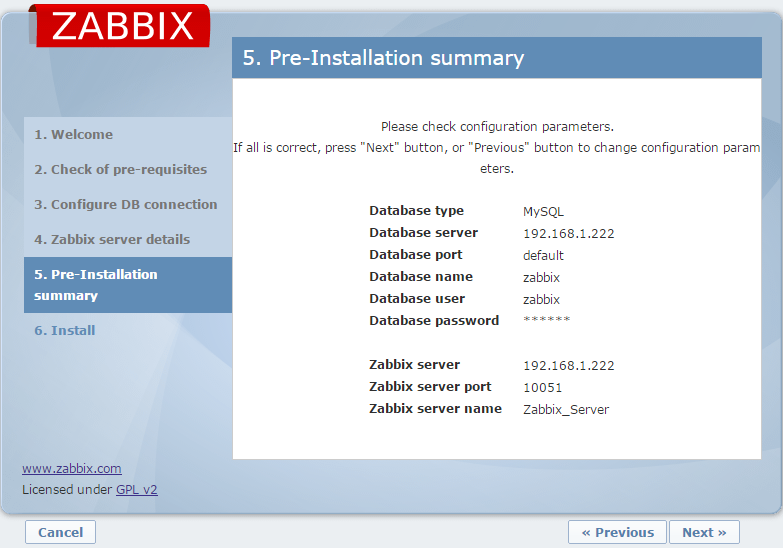
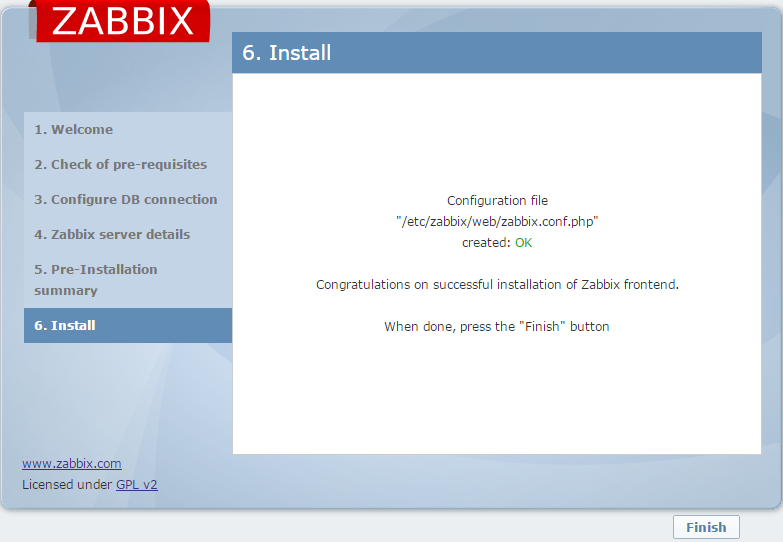
9. 打开浏览器,访问http://server_ip/zabbix/
登陆Zabbix 用户名密码:Admin/zabbix注意Admin的“A”大写
10. 配置Zabbix显示中文
profile-->Language-->chinese
11. 解决图形中中文显示问题
从Windows中C:\Windows\Fonts拷贝想要的字体到/opt下
cat /opt/msyhbd.ttf > /usr/share/zabbix/fonts/graphfont.ttf
不替换 graphfont.ttf的方法
vi /usr/share/zabbix/include/defines.inc.php
('ZBX_GRAPH_FONT_NAME', 'graphfont');
#将graphfont替换为下载的文件名即可
('ZBX_FONT_NAME', 'graphfont');
#将graphfont替换为下载的文件名即可
12. 关注Zabbix_Server日志
tail -f /var/log/zabbix/zabbix_server.log
1922:20141126:144903.783 cannot send list of active checks to [127.0.0.1]: host [Zabbix server] not monitored
其中有一个'cannot send list of active checks to ' 这种类型不算错误,后续更新Zabbix Agent(active)会描述这个情况.
1.2 YUM部署Zabbix2.4客户端(Centos)
rpm -ivh http://repo.zabbix.com/zabbix/2.4/rhel/6/x86_64/zabbix-release-2.4-1.el6.noarch.rpm
yum install zabbix-agent zabbix-sender zabbix-get -y
1. 修改Zabbix_Agent配置文件(服务器端自监控用也需要配置)
grep -vE '(^$|^\#)' /etc/zabbix/zabbix_agentd.conf
PidFile=/var/run/zabbix/zabbix_agentd.pid
LogFile=/var/log/zabbix/zabbix_agentd.log
LogFileSize=0
Server=192.168.1.222
#修改为Server的IP,支持多个IP,逗号分隔,使用域名的话,需要支持反向解析
#ServerActive=192.168.1.222
#修改为Server的IP,不支持写多个IP
HostnameItem=system.hostname
#默认是用Hostname需要手动指定主机名,改为HostnameItem 使用内部key的自动获取方式
Include=/etc/zabbix/zabbix_agentd.d/
标准配置文件
[root@Server-B opt]# grep -vE '(^$|^\#)' /etc/zabbix/zabbix_agentd.conf
PidFile=/var/run/zabbix/zabbix_agentd.pid
LogFile=/var/log/zabbix/zabbix_agentd.log
LogFileSize=0
Server=192.168.1.200
ServerActive=192.168.1.200
HostnameItem=system.hostname
Include=/etc/zabbix/zabbix_agentd.d/
2. 启动zabbix-agent并配置开机启动
/etc/init.d/zabbix-agent start
chkconfig zabbix-agent on
1.3 Zabbix客户端部署(Windows)
在windows控制台下执行以下命令:
E:\zabbix\bin\win32\zabbix_agentd.exe -c E:\zabbix\conf\zabbix_agentd.win.conf –i
启动命令如下:
E:\zabbix\bin\win32\zabbix_agentd.exe -c E:\zabbix\conf\zabbix_agentd.win.conf –s
1.4 Fpmmm模板部署(原MPM)
手册地址:http://www.fromdual.com/fpmmm-installation-guide
下载地址:https://support.fromdual.com/admin/download/fpmmm-0.10.5.tar.gz
1. 安装及基础设置
yum install php-cli php-process php-mysqli
cat << _EOF >/etc/php.d/fpmmm.ini
variables_order = "EGPCS"
date.timezone = 'Asia/Shanghai'
_EOF
rpm -Uvh http://repo.zabbix.com/zabbix/2.2/rhel/6/x86_64/zabbix-release-2.4-1.el6.noarch.rpm
yum update
yum install zabbix-sender zabbix-agent zabbix
2. 下载并上传fpmmm文件到/opt目录下
cd /opt
tar xf /tmp/fpmmm-0.10.5.tar.gz
ln -s fpmmm-0.10.5 fpmmm
3. 配置fpmmm
mkdir /etc/fpmmm
cp /opt/fpmmm/tpl/fpmmm.conf.template /etc/fpmmm/fpmmm.conf
chown -R zabbix: /etc/fpmmm
模板
[default]
Type= mysqld
LogLevel= 2
LogFile= /tmp/fpmmm/fpmmm.log
CacheFileBase = /tmp/fpmmm/fpmmmCache
AgentLockFile = /tmp/fpmmm/fpmmm.lock
# Zabbix Server IP address
ZabbixServer= 192.168.1.233
[G1-MySQL-M1] # This MUST match Hostname in Zabbix!
Type= mysqld
Username= fpmmmonit
Password= fpmmmonit
MysqlPort= 3306
MysqlHost= 192.168.1.210
Modules= process mysql myisam innodb master server fpmmm security
PidFile= /data/mysql3306/G1-MySQL-M1.pid
[G1-MySQL-M1]要和zabbix中的Host name中的定义要一致
4. 增加本地授权(收集数据)
GRANT SELECT, PROCESS, REPLICATION SLAVE, REPLICATION CLIENT ON *.* TO 'fpmmmonit'@'127.0.0.1' IDENTIFIED BY 'fpmmmonit';
flush privileges;
5. 测试
/opt/fpmmm/bin/fpmmm --config=/etc/fpmmm/fpmmm.conf
1
cat /tmp/fpmmm/fpmmm.log
6799:2016-03-03 20:56:50.016 - INFO: FromDual Performance Monitor for MySQL and MariaDB (fpmmm) (0.10.5) run started.
6799:2016-03-03 20:56:51.666 - INFO: FromDual Performance Monitor for MySQL and MariaDB (fpmmm) run finished (rc=0).
6. ADDING THE FPMMM TEMLATES TO ZABBIX
Go to Configuration > Templates > Import and import all the fpmmm templates.
7. CREATE HOSTS ON YOUR ZABBIX SERVER
A host in Zabbix terminology is a device you want to monitor. This can be either a machine or a MySQL database or something else.
First we have to create 2 hosts, one for the machine and one for the database: Configuration > Hosts > Create host.
Make sure that Host name matches exactly the hostname specified in fpmmm.conf (my_machine and my_mysqld).
Then add the templates fpmmm and server to the machine host (my_machine) and the other templates to the database host (my_mysqld).
Then test again if your fpmmm data reaches your Zabbix server: Monitoring > Latest data > fpmmm and check the time stamp of Last check for example.
8. REGULARLY RUNNING THE FPMMM AGENT
There are 2 different possibilities to run fpmmm regularly. First by the Zabbix agent:
Put the following line either into its own file (/etc/zabbix/conf.d/fpmmm.conf) or add it to the Zabbix agent configuartion file (/etc/zabbix/zabbix_agentd.conf).
UserParameter=FromDual.MySQL.check,/opt/fpmmm/bin/fpmmm --config=/etc/fpmmm/fpmmm.conf
or second by the crontab:
* * * * * /opt/fpmmm/bin/fpmmm --config=/etc/fpmmm/fpmmm.conf >/dev/null
1.5 集成OneAlter短信、邮箱、微信告警
OneAlter属于OneAPM下的子模块,可免费试用
网站首页:http://www.onealert.com/
下载页面:http://www.onealert.com/open/alert/download.jsp
1. 下载agent软件包
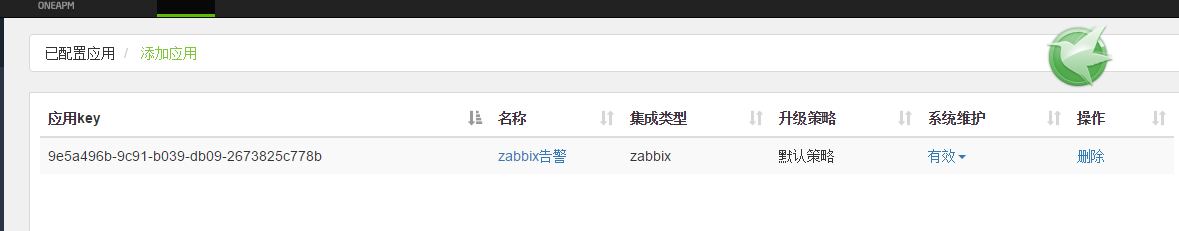
2. OneAlter中配置
设置分派、设置应用,获得应用key
3. 安装Agent
将agent更新到zabbix的外部告警脚本目录alertscripts,如果是源码安装的请自行更改目录。
tar xzf alert-agent-4.1.3.1-linux-x64.tar.gz
cp -R alert-agent /usr/lib/zabbix/alertscripts
cd /usr/lib/zabbix/alertscripts
chown -R zabbix:zabbix alert-agent
cp alert-agent/plugin/zabbix-plugin/110monitor /usr/lib/zabbix/alertscripts/
chmod +x /usr/lib/zabbix/alertscripts/110monitor
源码安装的盆友需要注意看配置文件/etc/zabbix/zabbix_server.conf
# AlertScriptsPath=/zabbix/alertscripts
AlertScriptsPath=/usr/lib/zabbix/alertscripts
请将agent更新至AlertScriptsPath目录中
alert-agent目录和110monitor需要放在同一级目录里面
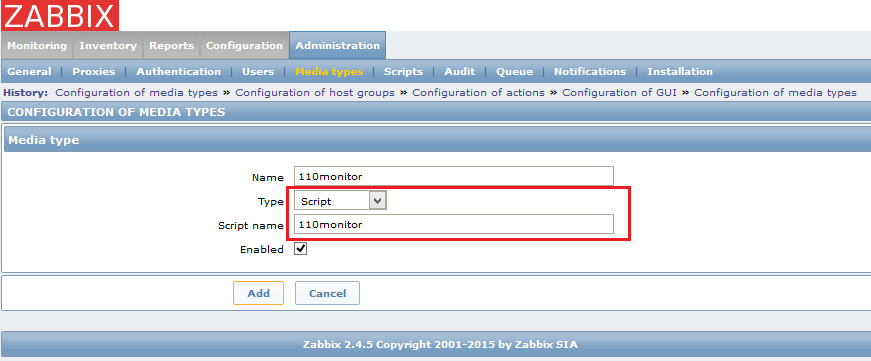
4. 创建110monitor通知方式
创建媒体类型Media types,,“Administrator”->“Media types”->“Create media type”
采用脚本模式script,脚本名为110monitor. 系统会在/usr/lib/zabbix/alertscripts/下查找上面的110monitor指令
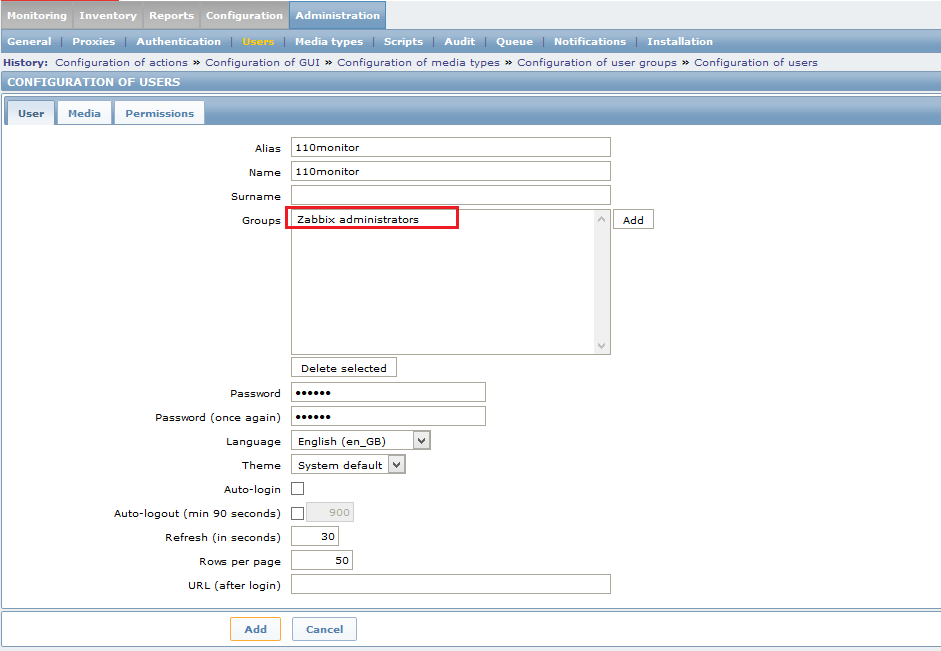
5. 创建110monitor用户
创建用户110monitor并设置通知媒介,登录zabbix,“Administrator”->“Users”->“create user”.
l 将110monitor用户加入到"Zabbix Administrator组"或者是新建组.
l 媒体类型,添加110monitor,并且设置appkey为发送目标.
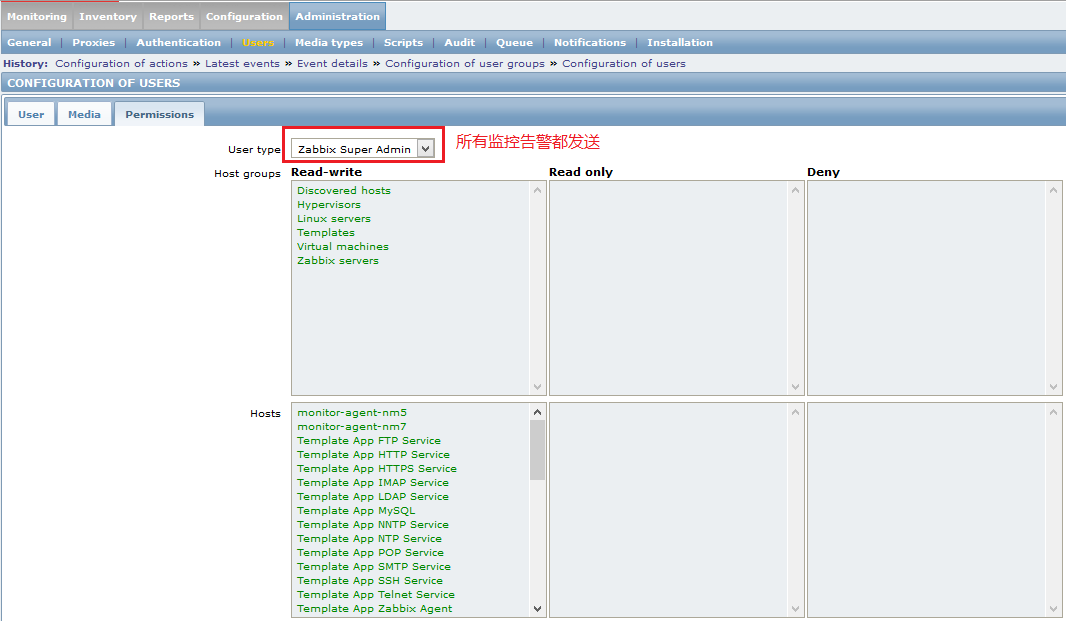
l 设置所有权限"Zabbix Super Admin"
新建110monitor用户.
设置媒介类型.

设置权限.
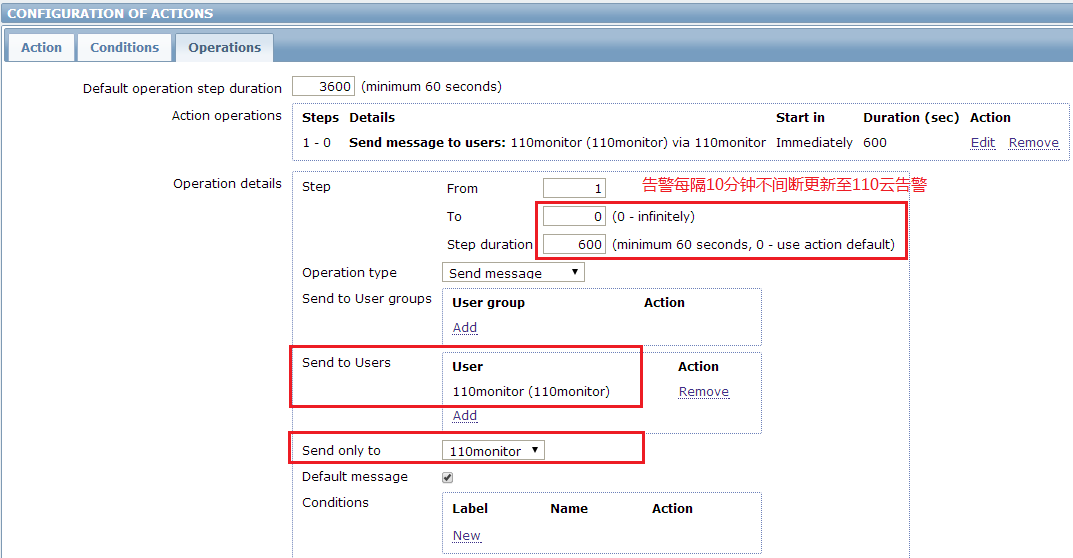
6. 创建触发动作发送通知
创建告警通知策略,"Configurationg"->"Actions"->"Create action"
l 名称110monitor
l 主题为trigger和resolve,意味着告警触发和恢复都会同步到110monitor
l 设置告警内容,注意冒号":"前的内容不可变更,冒号":"后的内容可以自行编辑
alarmName:{TRIGGER.NAME}
entityName:{HOSTNAME}
entityId:{IPADDRESS}
value:{TRIGGER.VALUE}
eventId:{EVENT.ID}
priority:{TRIGGER.SEVERITY}
alarmContent:{IPADDRESS} {ITEM.NAME}:{ITEM.VALUE}
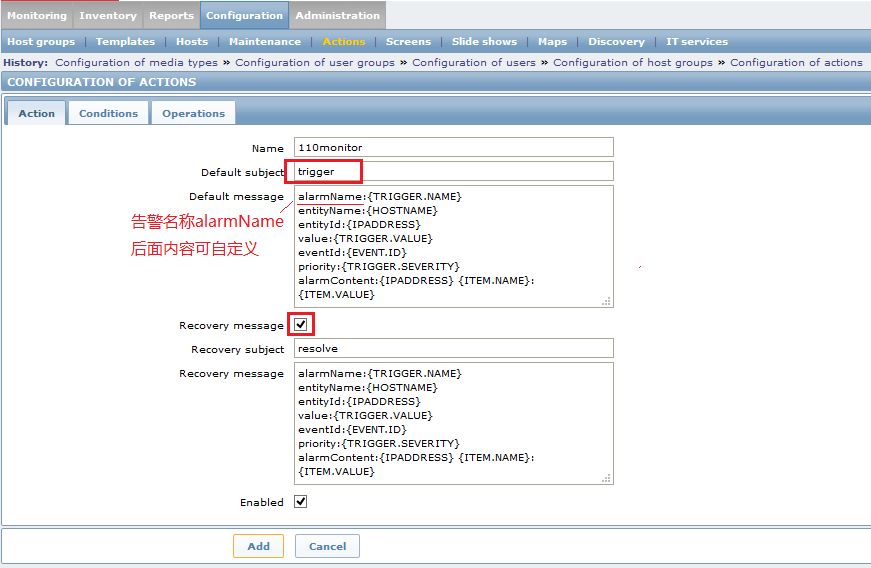
注意!自行配制的通知模板是不行的,需要严格按照以上配置。

7. 测试验证
查看agent日志,出现sucess字样代表成功,如果发送的告警通知,则会同步发送微信、移动app、短信、邮件
tail -f /usr/lib/zabbix/alertscripts/alert-agent/log/agent.log
1.6 Zabbix API测试
1.6.1 基础环境
l Python(2.6.6 laster)
1.6.2 制作脚本
1. 获取验证密钥
加粗地方需要求改
import urllib2
import json
zabbix_url="http://192.168.1.222/zabbix/api_jsonrpc.php"
api_pass='zabbix'
auth_data={ 'jsonrpc':'2.0','method':'user.login','params':{'user':'Admin','password':api_pass},'id':1}
#auth function
def get_auth():
request=urllib2.Request(zabbix_url,json.dumps(auth_data))
request.add_header('Content-Type','application/json')
response=urllib2.urlopen(request)
var1=json.loads(response.read())
return var1
#get auth session
session=get_auth()
print(session)

2. 修改请求脚本
l 将密钥写到粗体位置
[root@G1-WEB-1 tmp]# cat zbx_get.py
import urllib2
import json
zabbix_url="http://192.168.1.222/zabbix/api_jsonrpc.php"
api_pass='zabbix'
auth_data={
"jsonrpc": "2.0",
"method": "trigger.get",
"params": {
"output": [
"triggerid",
"description",
"priority"]
},
"id": 2,
"auth": "9ef715599db2c9f7600c2d2ab08eb122"
}
#auth function
def get_auth():
request=urllib2.Request(zabbix_url,json.dumps(auth_data))
request.add_header('Content-Type','application/json')
response=urllib2.urlopen(request)
var1=json.loads(response.read())
return var1
#get auth session
session=get_auth()
print(session)
1.6.3 脚本注释
[root@G1-WEB-1 tmp]# cat zbx_get.py
import urllib2
import json
zabbix_url="http://192.168.1.222/zabbix/api_jsonrpc.php"
api_pass='zabbix'
auth_data={
"jsonrpc": "2.0",
"method": "trigger.get",
"params": {
"output": [
"triggerid",
"description",
"priority"
],
"filter": {
"value": 1
},
"sortfield": "priority",
"sortorder": "DESC"
},
"id": 2,
"auth": "9ef715599db2c9f7600c2d2ab08eb122"
}
#auth function
def get_auth():
request=urllib2.Request(zabbix_url,json.dumps(auth_data))
request.add_header('Content-Type','application/json')
response=urllib2.urlopen(request)
var1=json.loads(response.read())
return var1
#get auth session
session=get_auth()
print(session)
以上粗体部分需要根据Zabbix的API手册进行修改;
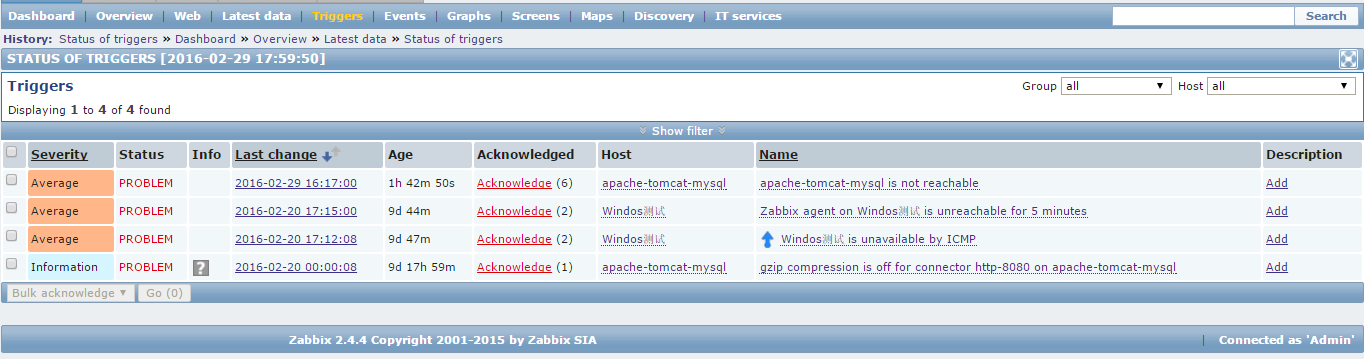
解释:使用“trigger.get”方法,调用 "triggerid", "description", "priority"对象,通过"filter","sortfield","sortorder"
进行过滤。
返回结果如下
{
'jsonrpc': '2.0',
'result': [
{
'priority': '3',
'triggerid': '13773',
'description': '{
HOST.NAME
} is not reachable'
},
{
'priority': '3',
'triggerid': '13775',
'description': '{
HOST.NAME
} is unavailable by ICMP'
},
{
'priority': '3',
'triggerid': '13779',
'description': 'Zabbix agent on {
HOST.NAME
} is unreachable for 5 minutes'
},
{
'priority': '2',
'triggerid': '13776',
'description': 'Ping loss is too high on {
HOST.NAME
}'
},
{
'priority': '1',
'triggerid': '13744',
'description': 'gzip compression is off for connector http-8080 on {
HOST.NAME
}'
}
],
'id': 2
}
注意:实际只看到4个触发器,是因为有一个触发器有依赖,也一起报警

1.6.4 根据API手册修改
1. 查看当前主机情况
{
"jsonrpc": "2.0",
"method": "host.get",
"params": {
"output": [
"hostid",
"host"
],
"selectInterfaces": [
"interfaceid",
"ip"
]
},
"id": 2,
"auth": "0424bd59b807674191e7d77572075f33"
}
2. 返回结果如下
{
'jsonrpc': '2.0',
'result': [
{
'interfaces': [
{
'interfaceid': '1',
'ip': '192.168.1.222'
}
],
'host': 'Zabbix server',
'hostid': '10084',
'name': 'Zabbix server'
},
{
'interfaces': [
{
'interfaceid': '6',
'ip': '192.168.1.200'
},
{
'interfaceid': '7',
'ip': '192.168.1.200'
}
],
'host': 'G1-WEB-1',
'hostid': '10120',
'name': 'apache-tomcat-mysql'
},
{
'interfaces': [
{
'interfaceid': '8',
'ip': '192.168.1.110'
}
],
'host': 'a-506ef4ce25484.',
'hostid': '10122',
'name': 'Windos测试'
}
],
'id': 2
}
1.7 Zabbix自定义监控项
1.7.1 步骤概述
l 开发自定义监控脚本(通过传参获取对应状态值)
l 增加Zabbix模板及触发器
l 测试&导出项目
1.7.2 实际案例(MySQL监控)
1. 开发自定义监控脚本
l 主文件
#!/bin/sh
#Version:V1.0
# Load system function library.
. /etc/init.d/functions
#Define the current position
Script_Base_Home=`pwd`
#Load getValue function
. ./Get_Function/MySQL/MySQL_Public_Fun.sh
if [ $# -ne 1];then
echo "Only allow you enter a parameter."
fi
#Receive Values
Input_Value=$1
Get_Value $Input_Value;
l 函数文件
#!/bin/sh
#Version:V1.0
#Public function
function Get_Value()
{
#Based on the input value ,get the value.
echo `grep "^$Input_Value\s" $Script_Base_Home/Tmp/MySQL_GetValue_Tmp | awk -F " " '{print $2}'`
}
l 定时获取参数脚本
#!/bin/sh
#Version:V1.0
#Load conf function
. ./Conf/MySQL_Get_Configure.sh
#Define the current position
Script_Base_Home=`pwd`
$MySQL_App_Base/bin/mysql -u$MySQL_User -p$MySQL_Password -P$MySQL_Port -h$MySQL_Host -e "SELECT * FROM information_schema.global_variables;">$Script_Base_Home/Tmp/MySQL_GetValue_Tmp
l 参数文件
#!/bin/sh
#Version:V1.0
#MySQL Base Home
MySQL_App_Base=/app/mysql56/
#Remote Connection MySQL User
MySQL_User=GetV
MySQL_Password=GetV
MySQL_Port=3306
MySQL_Host=10.1.1.3
#Other Configure
Log_File=$Script_Base_Home/Log/
2. Zabbix_Agent中增加自定义key(zabbix_agent.conf)
UserParameter=MySQL_PERFORMANCE_SCHEMA,sh/opt/Shell_Toos_BrandynX/MySQL_Status_Get.sh PERFORMANCE_SCHEMA
UserParameter=MySQL_QUERY_CACHE_TYPE,sh /opt/Shell_Toos_BrandynX/MySQL_Status_Get.sh QUERY_CACHE_TYPE
UserParameter=MySQL_AUTO_INCREMENT_OFFSET,sh /opt/Shell_Toos_BrandynX/MySQL_Status_Get.sh AUTO_INCREMENT_OFFSET
UserParameter=MySQL_INNODB_IO_CAPACITY,sh /opt/Shell_Toos_BrandynX/MySQL_Status_Get.sh INNODB_IO_CAPACITY
3. 新建Zabbix模板、Item、触发器等
第八章 监控 Zabbix的更多相关文章
- 运维监控-Zabbix Server 使用微信 WeChat 告警
运维监控-Zabbix Server 使用微信 WeChat 告警 作者:尹正杰 版权声明:原创作品,谢绝转载!否则将追究法律责任. 微信公众号告警每个一天只支持1000次告警,如果超出这个次数了就不 ...
- 运维监控-Zabbix Server 使用QQ SMTP发送邮件报警及定制报警内容
运维监控-Zabbix Server 使用QQ SMTP发送邮件报警及定制报警内容 作者:尹正杰 版权声明:原创作品,谢绝转载!否则将追究法律责任. 本篇博客采用腾讯邮箱,想必大家都对QQ很了解,所以 ...
- Zabbix WebUI 配置监控Zabbix Agent
Zabbix WebUI 配置监控Zabbix Agent 作者:尹正杰 版权声明:原创作品,谢绝转载!否则将追究法律责任. 一.部署zabbix服务 1>.部署zabbix server 和z ...
- 企业级监控zabbix基础
一个标准的监控系统所具备的基本功能: 1.数据的采集 2.为了展示其长期走势,将数据存储下来 3.万一某次采样的结果不在被认为是合理的范围内,然后就会做出告警操作,尽早的让相关人员得知到此消息 4.展 ...
- 服务监控-zabbix监控指标
1.cpu unitzation 监控cpu的整体状态. 使用Zabbix查看CPU利用率,会有下面几个值: CPU idle time:空闲的cpu时间比[简称id] CPU user time:用 ...
- 服务器监控zabbix
nagios服务器安装:http://www.jb51.net/article/79496.htm默认端口12489 nagios +ndo2db+mysqlhttps://www.cnblogs.c ...
- 服务监控Zabbix和Nagios的继任者
本文转载自:https://blog.csdn.net/moonpure/article/details/78633668 为了调研市场,从而做出更好的监控工具,David Gildeh 曾采访了超过 ...
- 建设DevOps统一运维监控平台,全面的系统监控 Zabbix VS Nagios VS Open-Falcon OR Prometheus
前言 随着Devops.云计算.微服务.容器等理念的逐步落地和大力发展,机器越来越多,应用越来越多,服务越来越微,应用运行基础环境越来多样化,容器.虚拟机.物理机不一而足.面对动辄几百上千个虚拟机.容 ...
- 企业及监控zabbix
Php要求必须是5.4及以上(centos 7默认是 5.4.16可以) #安装依赖库 yum -y install gcc curl curl-devel net-snmp net-snmp-dev ...
随机推荐
- WPF中StackPanel的使用方法
StackPanel 1.StackPanel:释义为是最简单的控制面板,它把其中的UI元素按横向或纵向堆积排列. 2.常用属性:width:获取或设置元素的宽度.Orientation:用于控制面板 ...
- IOS学习之路十七(通过delegate进行页面传值)
加入有A B两个页面,要实现从A跳到B的时候把值传过去,现在用delegate协议来实现 在A中定义一个协议,定义一个实现该协议的属性变量 在B中定义一个值(要获得的值类型)和set方法. 要传值B ...
- jquery禁用右键单击、F5刷新
1.禁用右键单击功能 $(document).ready(function() { $(document).bind("contextmenu",function(e) { ale ...
- jQuery easyui刷新当前tabs
更新特定的选项卡面板 可使用update方法,param参数包含2个属性: tab: 将被更新的选项卡. options: 选项卡相关配置项. Example: //当前tab var current ...
- node.js系列笔记之node.js初识《一》
node.js系列笔记之node.js初识<一> 一:环境说明 1.1 Linux系统CentOS 5.8 1.2 nodejs v0.10.15 1.3 nodejs源码下载地址 htt ...
- ASP.NET Web API的消息处理管道: Self Host下的消息处理管道[上篇]
ASP.NET Web API的消息处理管道: Self Host下的消息处理管道[上篇] ASP.NET Web API服务端框架核心是一个独立于具体寄宿环境的消息处理管道,它不关心请求消息来源于何 ...
- boost 1.49在vs 2005下编译的方法
首先下载boost库,网上自己搜索. 然后解压到一个目录:如D:\boost_1_49_0.然打开vs2005的命令提示符,进行D:\boost_1_49_0目录: 1.运行bootstrap.bat ...
- 一步步学习Python-django开发-建立django数据库
上篇文章建立了一个空的网站.现在我们要准备正式我们的网站开发咯.那么开发的第一步是啥呢?当然是要确定做什么网站了.每个人的开发习惯可能不尽相同,有点可能是从前端开始设计,有的可能是从数据库开始设计(不 ...
- Centos6.3不能使用yum install安装gcc编辑器解决办法
mv /var/lib/rpm/__db* /tmp rpm --rebuilddb yum clean all
- SESSION会话技术
以下对session会话技术详解: 要了解点http协议理解更佳--->http请求头和http相应头 在session_start的时候,浏览器会向服务器发出请求 在请求的同时,如果是第一次a ...