Spring Boot 2.x监控数据可视化(Actuator + Prometheus + Grafana手把手)
TIPS
本文基于Spring Boot 2.1.4,理论支持Spring Boot 2.x所有版本
众所周知,Spring Boot有个子项目Spring Boot Actuator,它为应用提供了强大的监控能力。从Spring Boot 2.0开始,Actuator将底层改为Micrometer,提供了更强、更灵活的监控能力。Micrometer是一个监控门面,可以类比成监控界的 Slf4j 。
借助Micrometer,应用能够对接各种监控系统,例如:
- AppOptics
- Atlas
- Datadog
- Dynatrace
- Elastic
- Ganglia
- Graphite
- Humio
- Influx
- JMX
- KairosDB
- New Relic
- Prometheus
- SignalFx
- Simple (in-memory)
- StatsD
- Wavefront
下面演示如何对接 Prometheus ,并使用 Grafana 实现数据的可视化。
TIPS
童鞋们对Prometheus或Grafana不熟悉也没关系,本文是手把手文章,按步骤操作即可。
编码
编写代码
加依赖
<dependency> <groupId>org.springframework.boot</groupId> <artifactId>spring-boot-starter-actuator</artifactId></dependency><dependency> <groupId>io.micrometer</groupId> <artifactId>micrometer-registry-prometheus</artifactId></dependency>
这里,我们为应用引入了
micrometer-registry-prometheus,事实上,你想对接上文列表中的哪款监控系统,就写啥。例如想对接Influx,则需添加依赖micrometer-registry-influx。写配置
server: port: 8080spring: application: name: prometheus-testmanagement: endpoints: web: exposure: include: 'prometheus' metrics: tags: application: ${spring.application.name}
如配置所示,指定应用名为
prometheus-test,并将Actuator的/actuator/prometheus端点暴露出来;management.metrics.tags.application=prometheus-test作用是为指标设置一个名为application="prometheus-test"的Tag,Tag是Prometheus提供的一种能力,从而实现更加灵活的筛选。
测试
启动应用
访问
http://localhost:8080/actuator/prometheus可获得类似如下的结果:# HELP jvm_memory_used_bytes The amount of used memory# TYPE jvm_memory_used_bytes gaugejvm_memory_used_bytes{application="prometheus-test",area="heap",id="PS Old Gen",} 2.1193976E7jvm_memory_used_bytes{application="prometheus-test",area="nonheap",id="Metaspace",} 3.8791688E7jvm_memory_used_bytes{application="prometheus-test",area="heap",id="PS Survivor Space",} 0.0jvm_memory_used_bytes{application="prometheus-test",area="nonheap",id="Compressed Class Space",} 5303976.0jvm_memory_used_bytes{application="prometheus-test",area="heap",id="PS Eden Space",} 8.2574816E7jvm_memory_used_bytes{application="prometheus-test",area="nonheap",id="Code Cache",} 8693824.0# HELP tomcat_global_received_bytes_total # TYPE tomcat_global_received_bytes_total countertomcat_global_received_bytes_total{application="prometheus-test",name="http-nio-8080",} 0.0# HELP jvm_threads_daemon_threads The current number of live daemon threads# TYPE jvm_threads_daemon_threads gaugejvm_threads_daemon_threads{application="prometheus-test",} 20.0# HELP tomcat_sessions_alive_max_seconds # TYPE tomcat_sessions_alive_max_seconds gaugetomcat_sessions_alive_max_seconds{application="prometheus-test",} 0.0# HELP jvm_buffer_memory_used_bytes An estimate of the memory that the Java virtual machine is using for this buffer pool# TYPE jvm_buffer_memory_used_bytes gaugejvm_buffer_memory_used_bytes{application="prometheus-test",id="mapped",} 0.0jvm_buffer_memory_used_bytes{application="prometheus-test",id="direct",} 90112.0# HELP jvm_threads_states_threads The current number of threads having NEW state# TYPE jvm_threads_states_threads gaugejvm_threads_states_threads{application="prometheus-test",state="runnable",} 9.0jvm_threads_states_threads{application="prometheus-test",state="new",} 0.0jvm_threads_states_threads{application="prometheus-test",state="terminated",} 0.0jvm_threads_states_threads{application="prometheus-test",state="blocked",} 0.0jvm_threads_states_threads{application="prometheus-test",state="waiting",} 12.0jvm_threads_states_threads{application="prometheus-test",state="timed-waiting",} 3.0# HELP process_cpu_usage The "recent cpu usage" for the Java Virtual Machine process# TYPE process_cpu_usage gaugeprocess_cpu_usage{application="prometheus-test",} 0.0030590633504868434# HELP logback_events_total Number of error level events that made it to the logs# TYPE logback_events_total counterlogback_events_total{application="prometheus-test",level="info",} 7.0logback_events_total{application="prometheus-test",level="warn",} 0.0logback_events_total{application="prometheus-test",level="trace",} 0.0logback_events_total{application="prometheus-test",level="debug",} 0.0logback_events_total{application="prometheus-test",level="error",} 0.0# HELP tomcat_global_sent_bytes_total # TYPE tomcat_global_sent_bytes_total countertomcat_global_sent_bytes_total{application="prometheus-test",name="http-nio-8080",} 195356.0# HELP process_files_max_files The maximum file descriptor count# TYPE process_files_max_files gaugeprocess_files_max_files{application="prometheus-test",} 10240.0# HELP tomcat_threads_busy_threads # TYPE tomcat_threads_busy_threads gaugetomcat_threads_busy_threads{application="prometheus-test",name="http-nio-8080",} 1.0# HELP process_files_open_files The open file descriptor count# TYPE process_files_open_files gaugeprocess_files_open_files{application="prometheus-test",} 101.0# HELP tomcat_sessions_active_current_sessions # TYPE tomcat_sessions_active_current_sessions gaugetomcat_sessions_active_current_sessions{application="prometheus-test",} 0.0# HELP jvm_classes_unloaded_classes_total The total number of classes unloaded since the Java virtual machine has started execution# TYPE jvm_classes_unloaded_classes_total counterjvm_classes_unloaded_classes_total{application="prometheus-test",} 2.0# HELP jvm_memory_committed_bytes The amount of memory in bytes that is committed for the Java virtual machine to use# TYPE jvm_memory_committed_bytes gaugejvm_memory_committed_bytes{application="prometheus-test",area="heap",id="PS Old Gen",} 1.5466496E8jvm_memory_committed_bytes{application="prometheus-test",area="nonheap",id="Metaspace",} 4.1418752E7jvm_memory_committed_bytes{application="prometheus-test",area="heap",id="PS Survivor Space",} 1.6252928E7jvm_memory_committed_bytes{application="prometheus-test",area="nonheap",id="Compressed Class Space",} 5767168.0jvm_memory_committed_bytes{application="prometheus-test",area="heap",id="PS Eden Space",} 1.73539328E8jvm_memory_committed_bytes{application="prometheus-test",area="nonheap",id="Code Cache",} 8716288.0# HELP http_server_requests_seconds # TYPE http_server_requests_seconds summaryhttp_server_requests_seconds_count{application="prometheus-test",exception="None",method="GET",outcome="SUCCESS",status="200",uri="/actuator/prometheus",} 16.0http_server_requests_seconds_sum{application="prometheus-test",exception="None",method="GET",outcome="SUCCESS",status="200",uri="/actuator/prometheus",} 0.326299973http_server_requests_seconds_count{application="prometheus-test",exception="None",method="GET",outcome="SUCCESS",status="200",uri="/**/favicon.ico",} 3.0http_server_requests_seconds_sum{application="prometheus-test",exception="None",method="GET",outcome="SUCCESS",status="200",uri="/**/favicon.ico",} 0.028434427# HELP http_server_requests_seconds_max # TYPE http_server_requests_seconds_max gaugehttp_server_requests_seconds_max{application="prometheus-test",exception="None",method="GET",outcome="SUCCESS",status="200",uri="/actuator/prometheus",} 0.120627904http_server_requests_seconds_max{application="prometheus-test",exception="None",method="GET",outcome="SUCCESS",status="200",uri="/**/favicon.ico",} 0.015596512# HELP tomcat_global_error_total # TYPE tomcat_global_error_total countertomcat_global_error_total{application="prometheus-test",name="http-nio-8080",} 0.0# HELP jvm_gc_max_data_size_bytes Max size of old generation memory pool# TYPE jvm_gc_max_data_size_bytes gaugejvm_gc_max_data_size_bytes{application="prometheus-test",} 2.863661056E9# HELP jvm_gc_live_data_size_bytes Size of old generation memory pool after a full GC# TYPE jvm_gc_live_data_size_bytes gaugejvm_gc_live_data_size_bytes{application="prometheus-test",} 2.1193976E7# HELP system_load_average_1m The sum of the number of runnable entities queued to available processors and the number of runnable entities running on the available processors averaged over a period of time# TYPE system_load_average_1m gaugesystem_load_average_1m{application="prometheus-test",} 3.9423828125# HELP process_uptime_seconds The uptime of the Java virtual machine# TYPE process_uptime_seconds gaugeprocess_uptime_seconds{application="prometheus-test",} 173.424# HELP tomcat_sessions_expired_sessions_total # TYPE tomcat_sessions_expired_sessions_total countertomcat_sessions_expired_sessions_total{application="prometheus-test",} 0.0# HELP jvm_gc_pause_seconds Time spent in GC pause# TYPE jvm_gc_pause_seconds summaryjvm_gc_pause_seconds_count{action="end of minor GC",application="prometheus-test",cause="Metadata GC Threshold",} 1.0jvm_gc_pause_seconds_sum{action="end of minor GC",application="prometheus-test",cause="Metadata GC Threshold",} 0.012jvm_gc_pause_seconds_count{action="end of major GC",application="prometheus-test",cause="Metadata GC Threshold",} 1.0jvm_gc_pause_seconds_sum{action="end of major GC",application="prometheus-test",cause="Metadata GC Threshold",} 0.045# HELP jvm_gc_pause_seconds_max Time spent in GC pause# TYPE jvm_gc_pause_seconds_max gaugejvm_gc_pause_seconds_max{action="end of minor GC",application="prometheus-test",cause="Metadata GC Threshold",} 0.012jvm_gc_pause_seconds_max{action="end of major GC",application="prometheus-test",cause="Metadata GC Threshold",} 0.045# HELP jvm_gc_memory_promoted_bytes_total Count of positive increases in the size of the old generation memory pool before GC to after GC# TYPE jvm_gc_memory_promoted_bytes_total counterjvm_gc_memory_promoted_bytes_total{application="prometheus-test",} 1.06878E7# HELP jvm_gc_memory_allocated_bytes_total Incremented for an increase in the size of the young generation memory pool after one GC to before the next# TYPE jvm_gc_memory_allocated_bytes_total counterjvm_gc_memory_allocated_bytes_total{application="prometheus-test",} 7.8713648E7# HELP tomcat_global_request_seconds # TYPE tomcat_global_request_seconds summarytomcat_global_request_seconds_count{application="prometheus-test",name="http-nio-8080",} 19.0tomcat_global_request_seconds_sum{application="prometheus-test",name="http-nio-8080",} 0.432# HELP jvm_threads_live_threads The current number of live threads including both daemon and non-daemon threads# TYPE jvm_threads_live_threads gaugejvm_threads_live_threads{application="prometheus-test",} 24.0# HELP jvm_buffer_count_buffers An estimate of the number of buffers in the pool# TYPE jvm_buffer_count_buffers gaugejvm_buffer_count_buffers{application="prometheus-test",id="mapped",} 0.0jvm_buffer_count_buffers{application="prometheus-test",id="direct",} 11.0# HELP process_start_time_seconds Start time of the process since unix epoch.# TYPE process_start_time_seconds gaugeprocess_start_time_seconds{application="prometheus-test",} 1.556017153576E9# HELP tomcat_threads_config_max_threads # TYPE tomcat_threads_config_max_threads gaugetomcat_threads_config_max_threads{application="prometheus-test",name="http-nio-8080",} 200.0# HELP system_cpu_count The number of processors available to the Java virtual machine# TYPE system_cpu_count gaugesystem_cpu_count{application="prometheus-test",} 8.0# HELP tomcat_threads_current_threads # TYPE tomcat_threads_current_threads gaugetomcat_threads_current_threads{application="prometheus-test",name="http-nio-8080",} 10.0# HELP jvm_memory_max_bytes The maximum amount of memory in bytes that can be used for memory management# TYPE jvm_memory_max_bytes gaugejvm_memory_max_bytes{application="prometheus-test",area="heap",id="PS Old Gen",} 2.863661056E9jvm_memory_max_bytes{application="prometheus-test",area="nonheap",id="Metaspace",} -1.0jvm_memory_max_bytes{application="prometheus-test",area="heap",id="PS Survivor Space",} 1.6252928E7jvm_memory_max_bytes{application="prometheus-test",area="nonheap",id="Compressed Class Space",} 1.073741824E9jvm_memory_max_bytes{application="prometheus-test",area="heap",id="PS Eden Space",} 1.395654656E9jvm_memory_max_bytes{application="prometheus-test",area="nonheap",id="Code Cache",} 2.5165824E8# HELP jvm_threads_peak_threads The peak live thread count since the Java virtual machine started or peak was reset# TYPE jvm_threads_peak_threads gaugejvm_threads_peak_threads{application="prometheus-test",} 29.0# HELP jvm_classes_loaded_classes The number of classes that are currently loaded in the Java virtual machine# TYPE jvm_classes_loaded_classes gaugejvm_classes_loaded_classes{application="prometheus-test",} 7936.0# HELP tomcat_sessions_active_max_sessions # TYPE tomcat_sessions_active_max_sessions gaugetomcat_sessions_active_max_sessions{application="prometheus-test",} 0.0# HELP tomcat_global_request_max_seconds # TYPE tomcat_global_request_max_seconds gaugetomcat_global_request_max_seconds{application="prometheus-test",name="http-nio-8080",} 0.161# HELP tomcat_sessions_created_sessions_total # TYPE tomcat_sessions_created_sessions_total countertomcat_sessions_created_sessions_total{application="prometheus-test",} 0.0# HELP tomcat_sessions_rejected_sessions_total # TYPE tomcat_sessions_rejected_sessions_total countertomcat_sessions_rejected_sessions_total{application="prometheus-test",} 0.0# HELP jvm_buffer_total_capacity_bytes An estimate of the total capacity of the buffers in this pool# TYPE jvm_buffer_total_capacity_bytes gaugejvm_buffer_total_capacity_bytes{application="prometheus-test",id="mapped",} 0.0jvm_buffer_total_capacity_bytes{application="prometheus-test",id="direct",} 90112.0# HELP system_cpu_usage The "recent cpu usage" for the whole system# TYPE system_cpu_usage gaugesystem_cpu_usage{application="prometheus-test",} 0.2523364485981308
该端点返回的数据结构是Prometheus需要使用的。对照注释,相信大家能看懂每一项的含义。例如:
# HELP jvm_memory_used_bytes The amount of used memory# TYPE jvm_memory_used_bytes gaugejvm_memory_used_bytes{application="prometheus-test",area="heap",id="PS Old Gen",} 2.1193976E7
表示:
prometheus-test应用堆内存中的PS Old Gen区域占用的空间是2.1193976E7字节。
对接Prometheus
Prometheus是一款开源的监控 + 时序数据库 + 报警软件,由SoundCloud公司开发的。目前在CNCF基金会托管,并已成功孵化。
官方网站
安装Prometheus
TIPS
简单期间,本文使用Docker方式安装,其他方式安装请详见 Prometheus安装说明 。
准备配置文件,命名为
prometheus.ymlscrape_configs:# 任意写,建议英文,不要包含特殊字符- job_name: 'spring' # 多久采集一次数据 scrape_interval: 15s # 采集时的超时时间 scrape_timeout: 10s # 采集的路径是啥 metrics_path: '/actuator/prometheus' # 采集服务的地址,设置成上面Spring Boot应用所在服务器的具体地址。 static_configs: - targets: ['30.1.229.89:8080']
这样配置后,Prometheus服务器就会自动每隔15秒请求
http://30.1.229.89:8080/actuator/prometheus。更多配置项详见 Prometheus Configuration官方文档在
prometheus.yml文件所在目录执行如下命令,即可启动Prometheusdocker run -d -p 9090:9090 \ -v $(pwd)/prometheus.yml:/etc/prometheus/prometheus.yml \ prom/prometheus --config.file=/etc/prometheus/prometheus.yml
测试
访问
http://localhost:9090,可看到类似如下的界面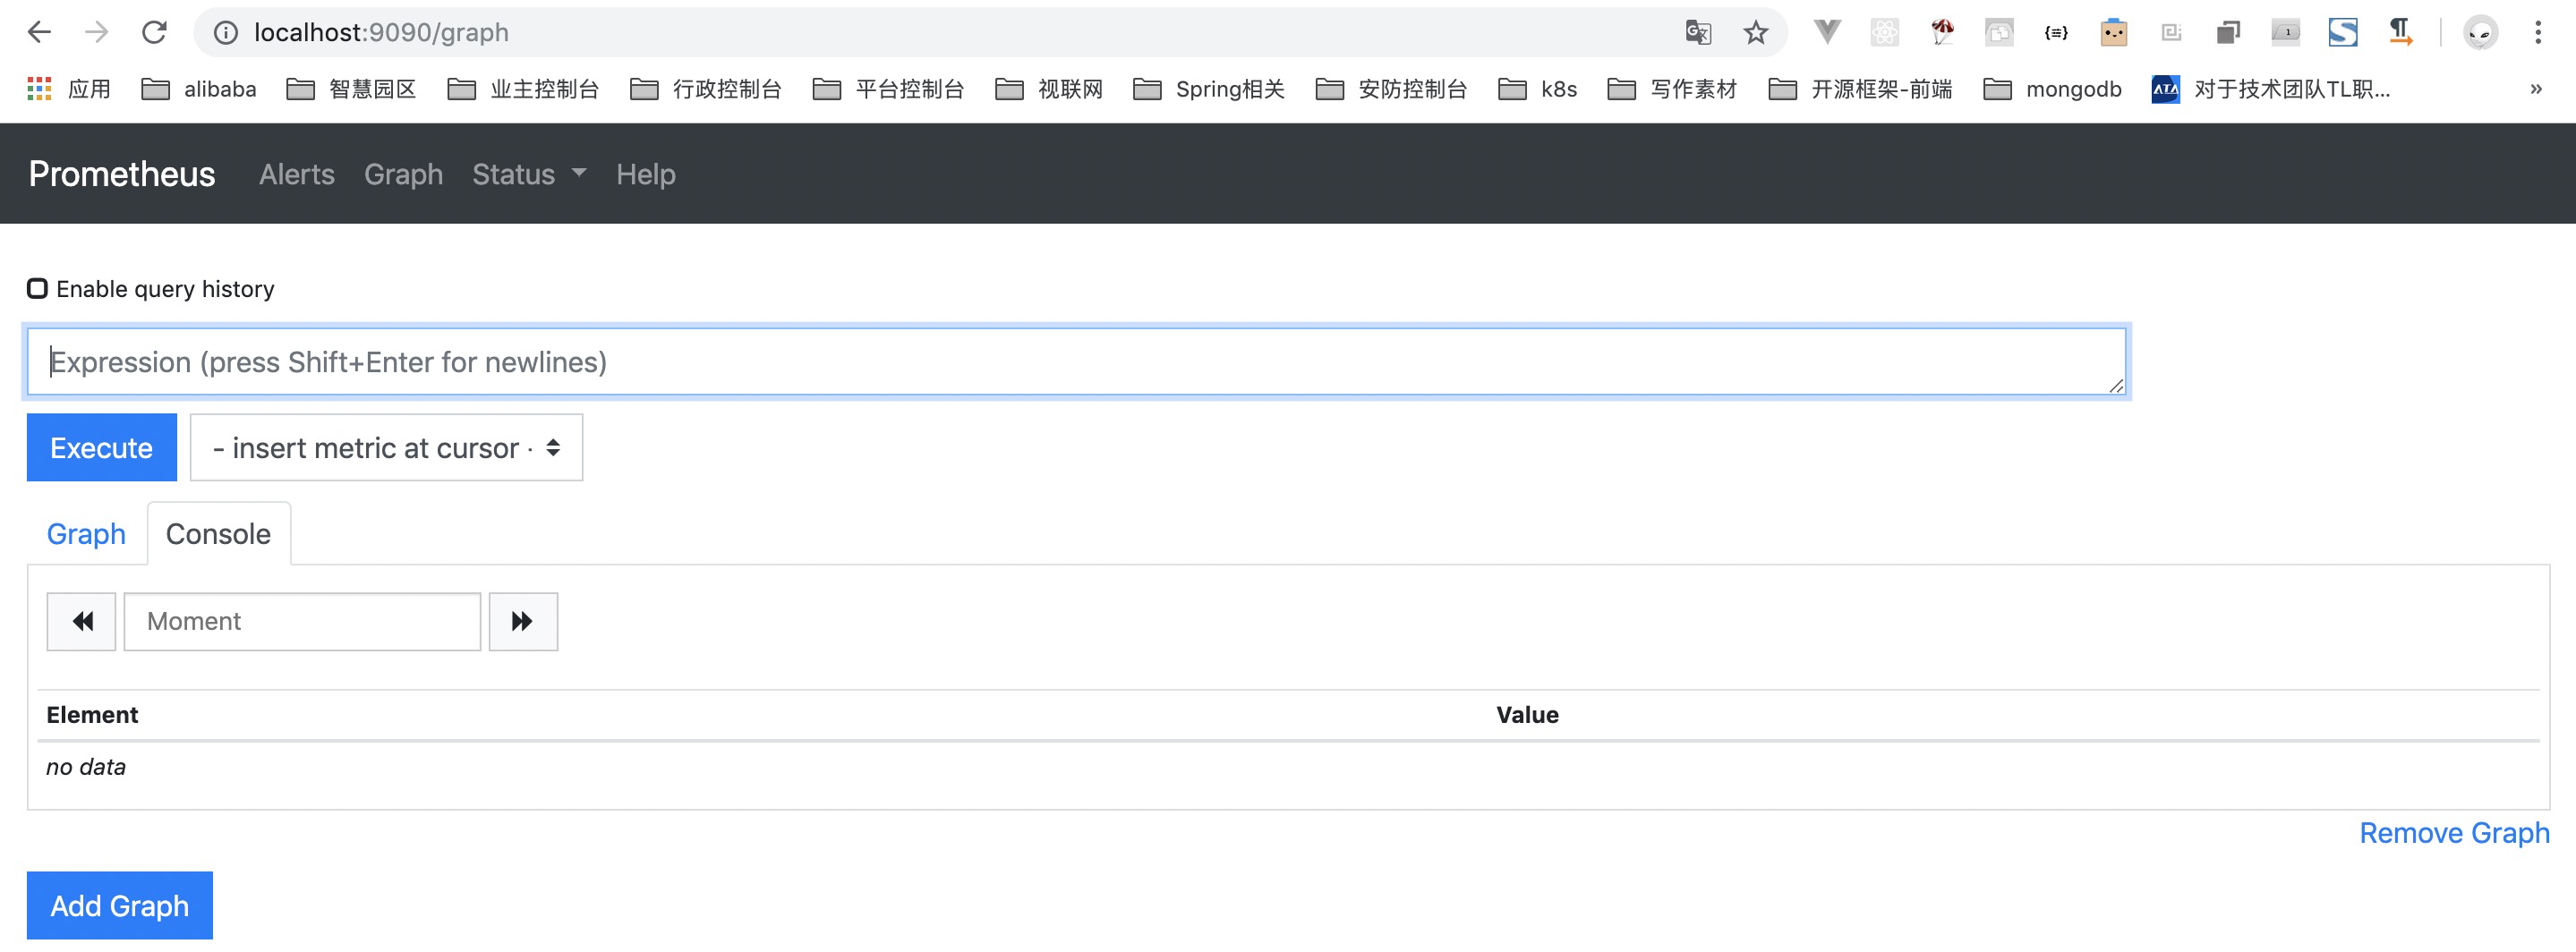
点击
Insert metric at cursor,即可选择监控指标;点击Graph,即可让指标以图表方式展示;点击Execute按钮,即可看到类似下图的结果: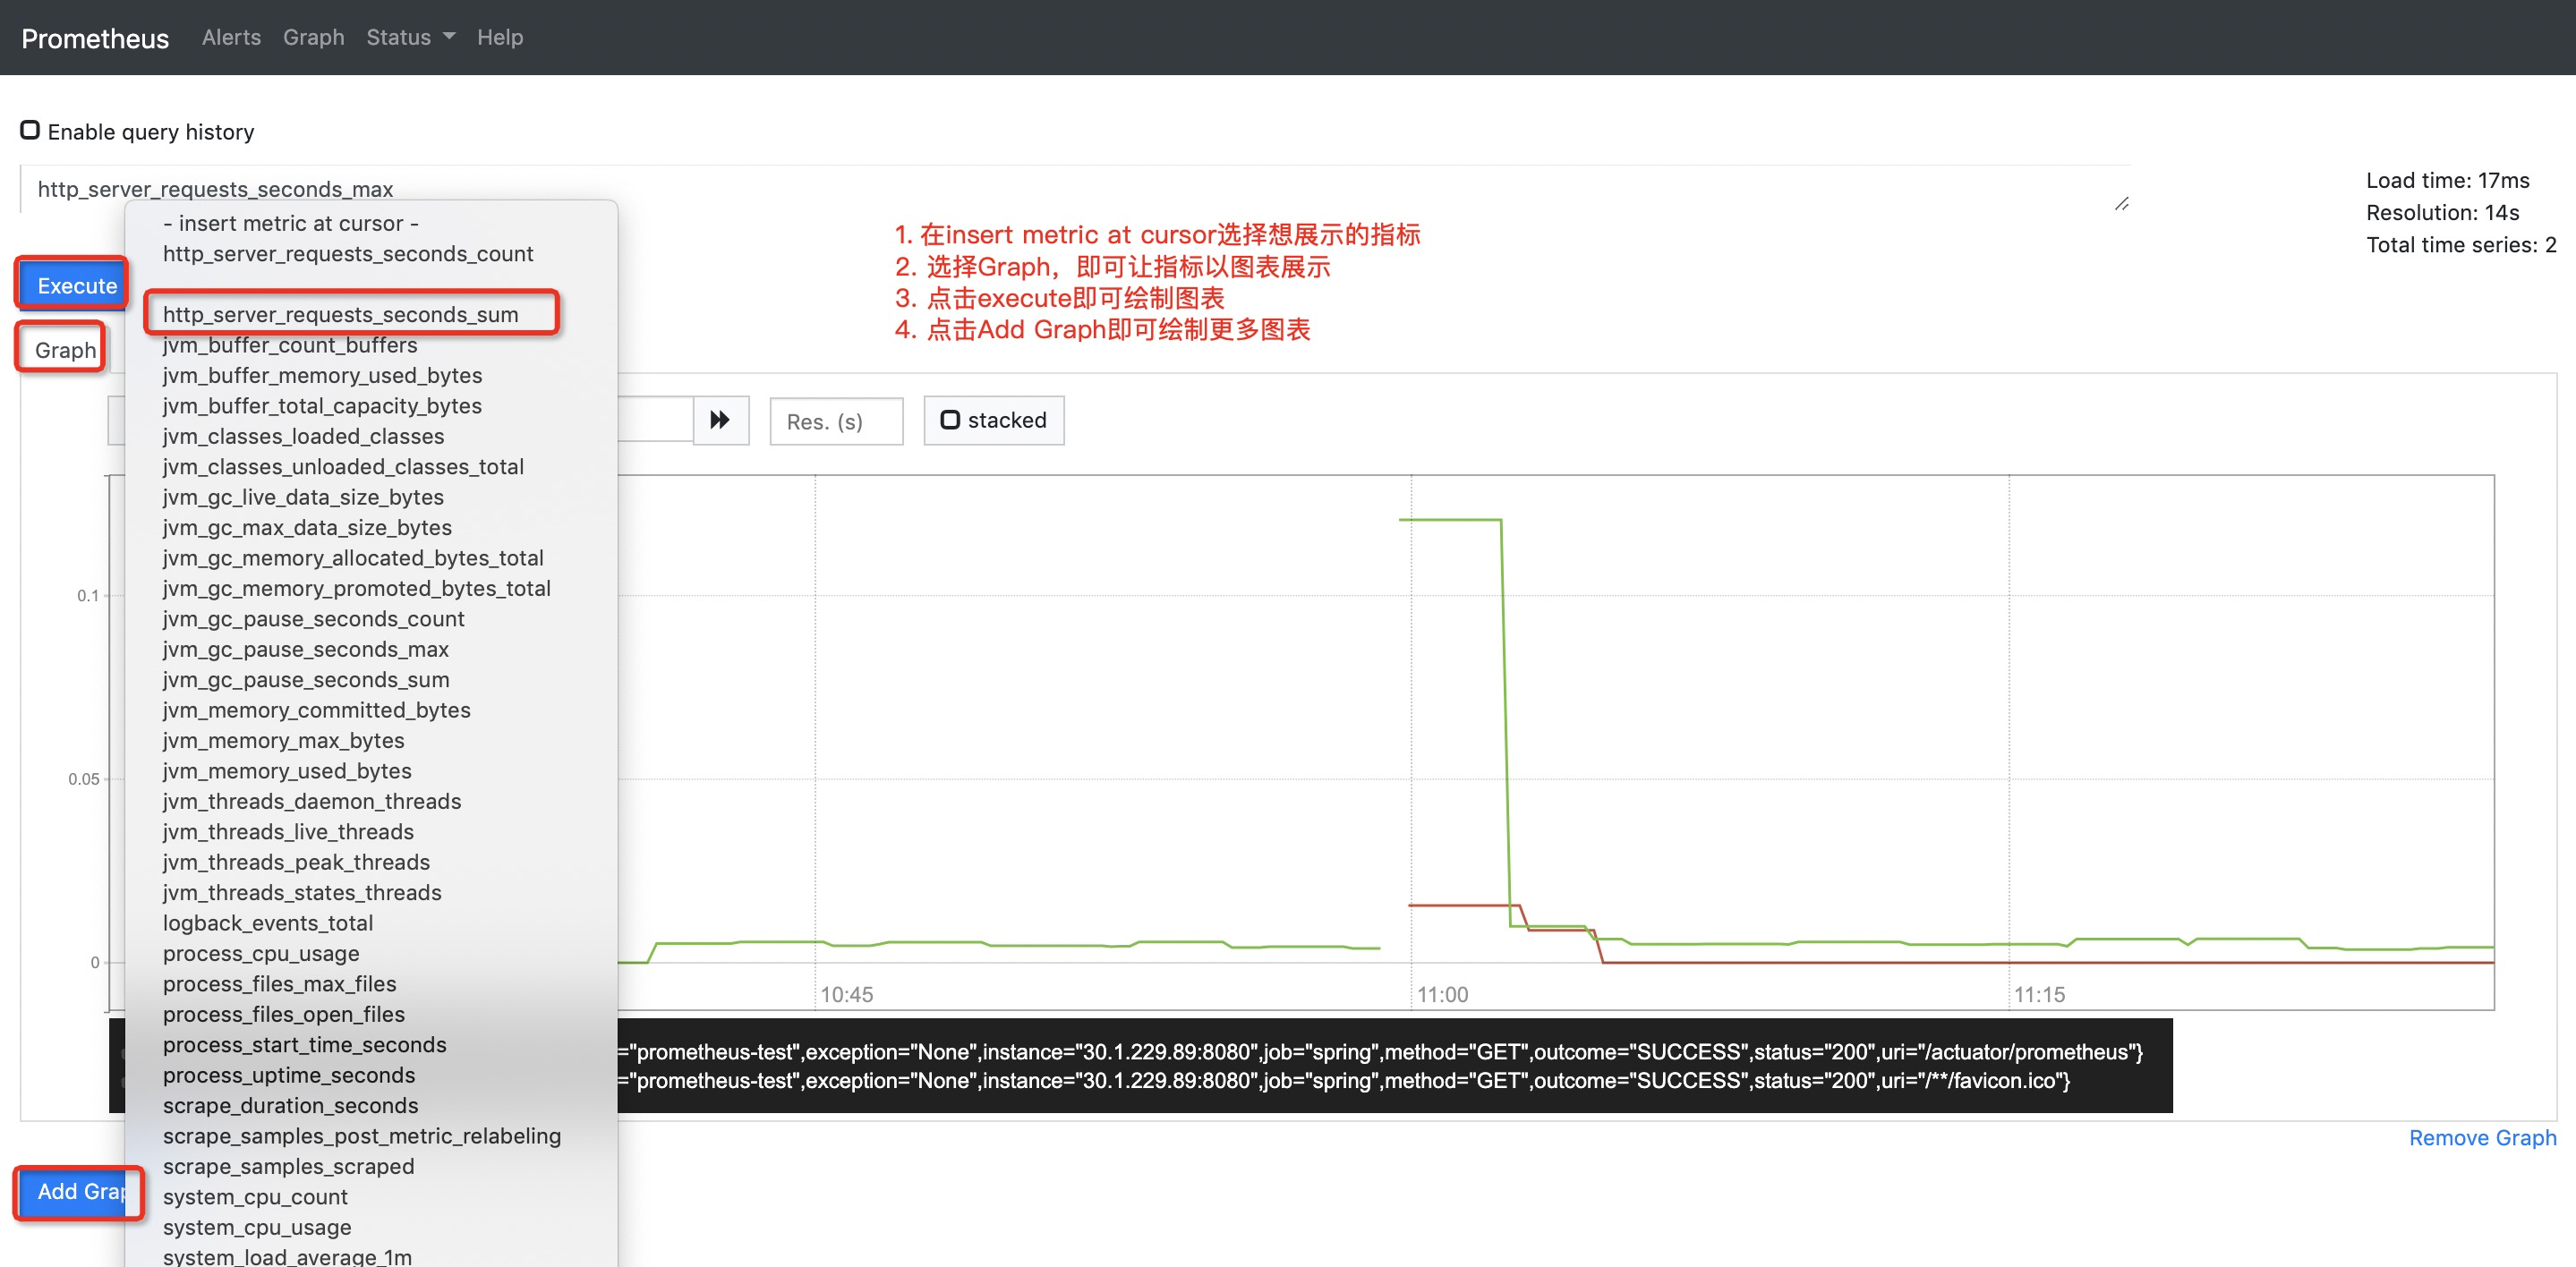
Grafana可视化
至此,已经用Prometheus实现了监控数据的可视化,然而使用体验并不好。下面来用Grafana实现更友好、更贴近生产的监控可视化。
Grafana是一个开源的跨平台度量分析和可视化 + 告警工具。
官方网站
安装Grafana
TIPS
简单期间,本文使用Docker方式安装,其他方式安装请详见 Grafana安装说明 。
启动
docker run -d -p 3000:3000 grafana/grafana
配置
登录:访问
http://localhost:3000/login,初始账号/密码为:admin/admin,登录后,即可看到类似如下的界面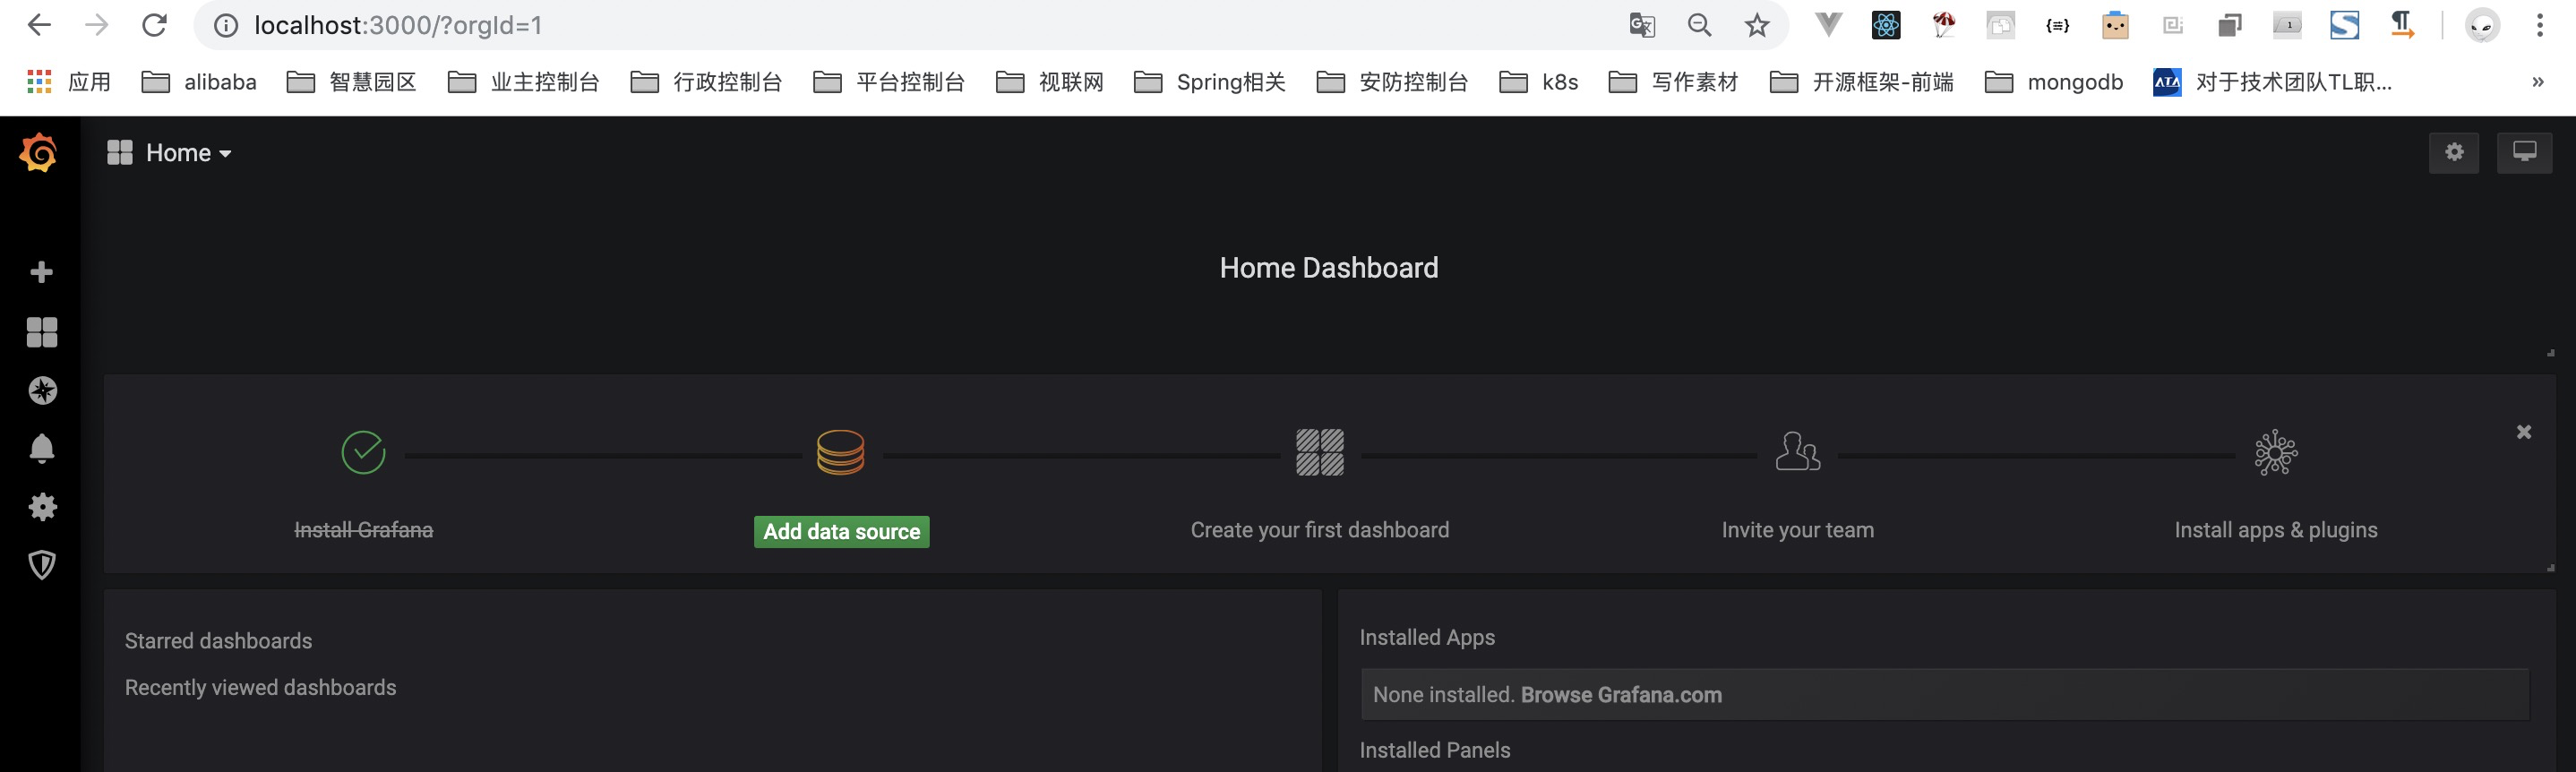
点击
Add data source,即可看到类似如下的界面:
点击Prometheus,即可看到类似如下界面:
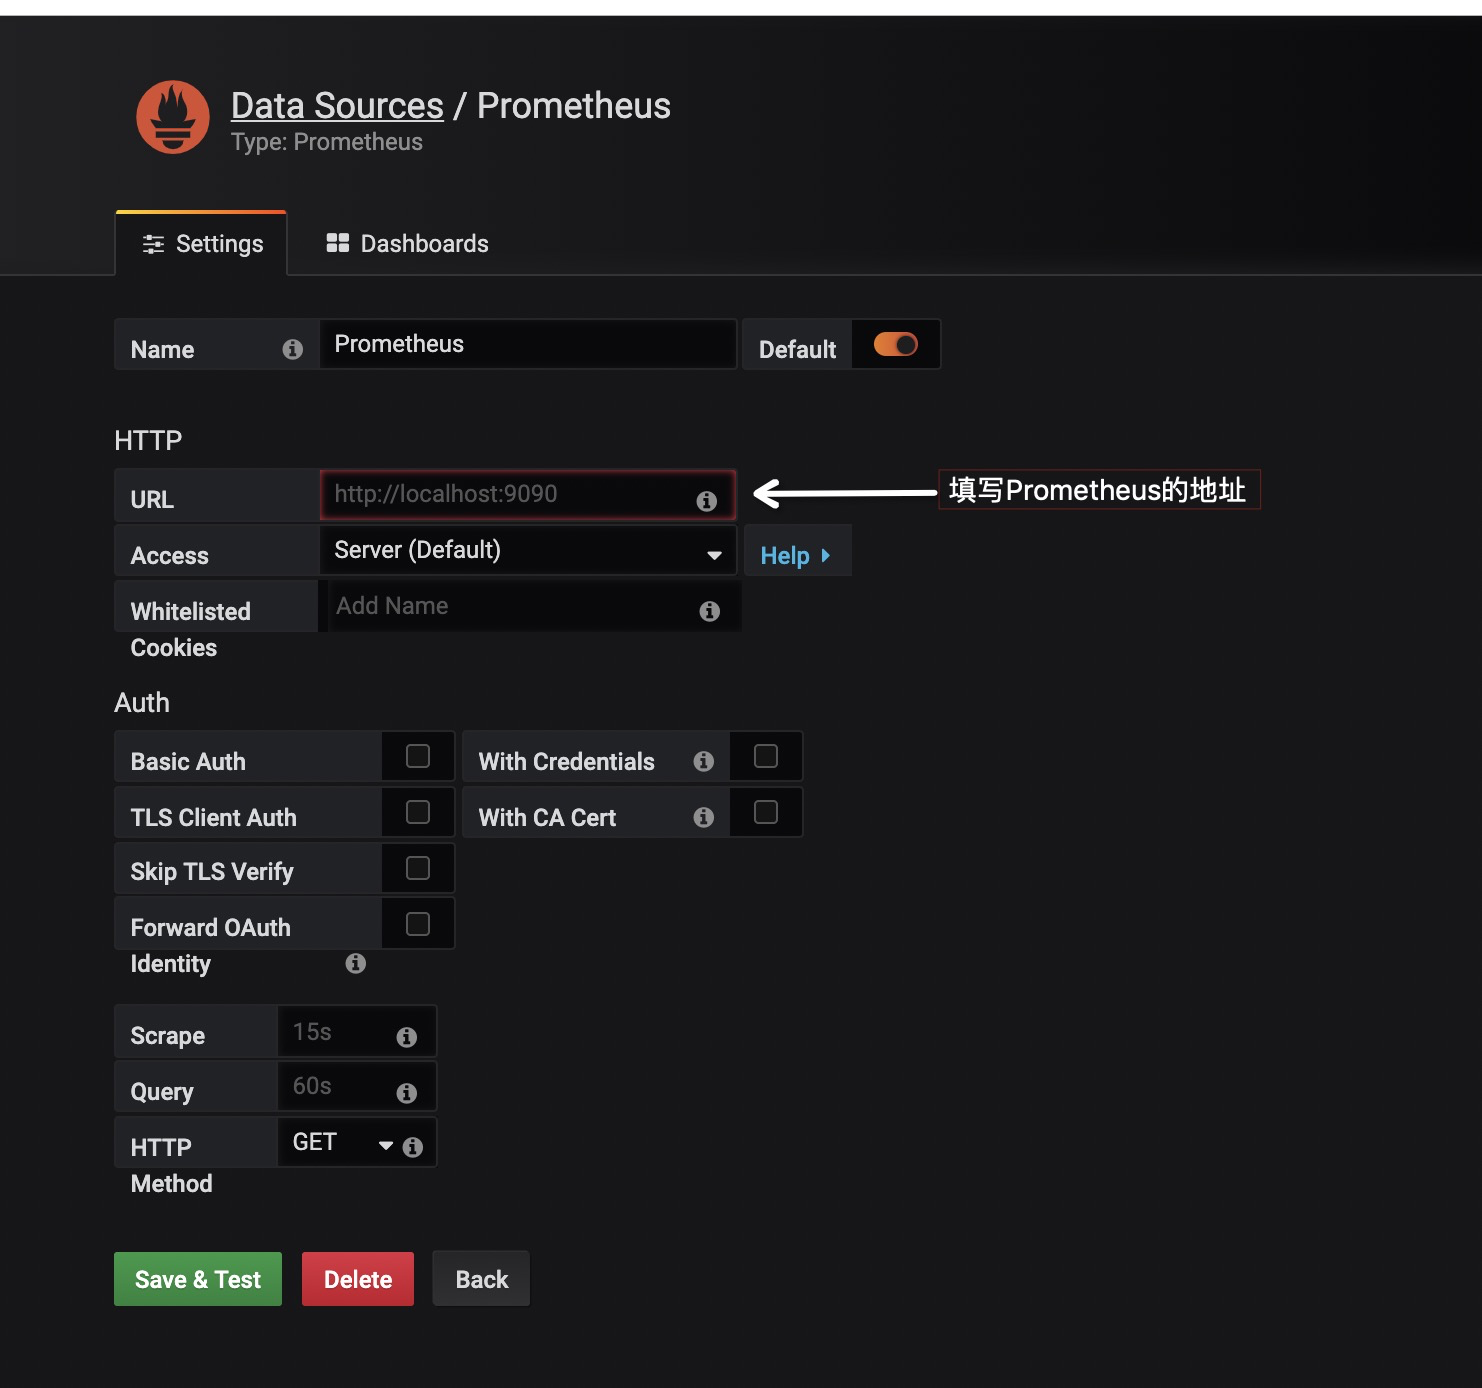
填写Prometheus的首页地址,并点击
Save & Test
创建监控Dashboard
点击导航栏上的
+按钮,并点击Dashboard,将会看到类似如下的界面: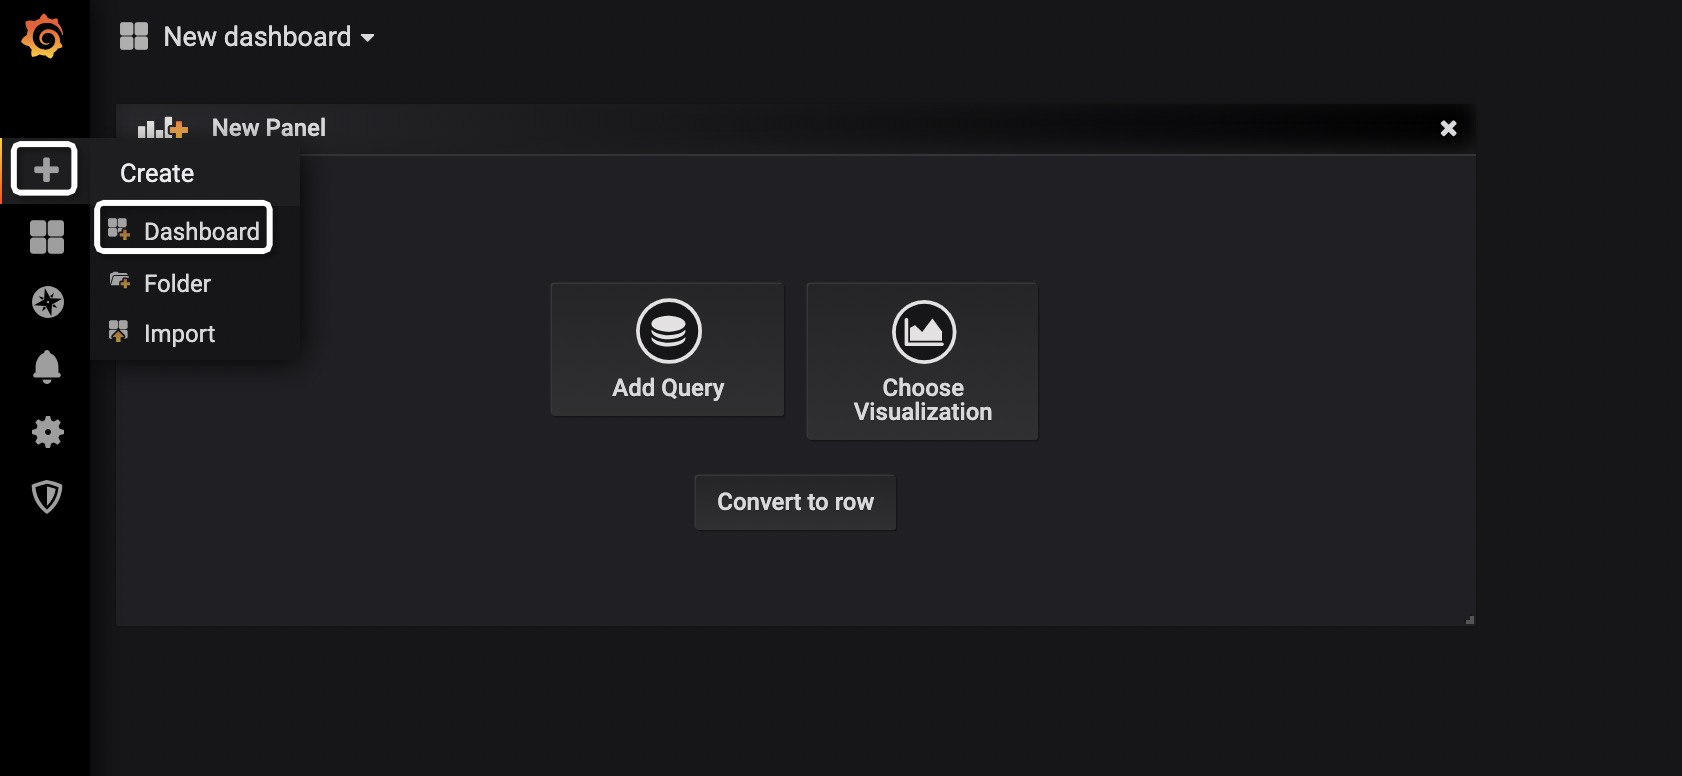
点击
Add Query,即可看到类似如下的界面: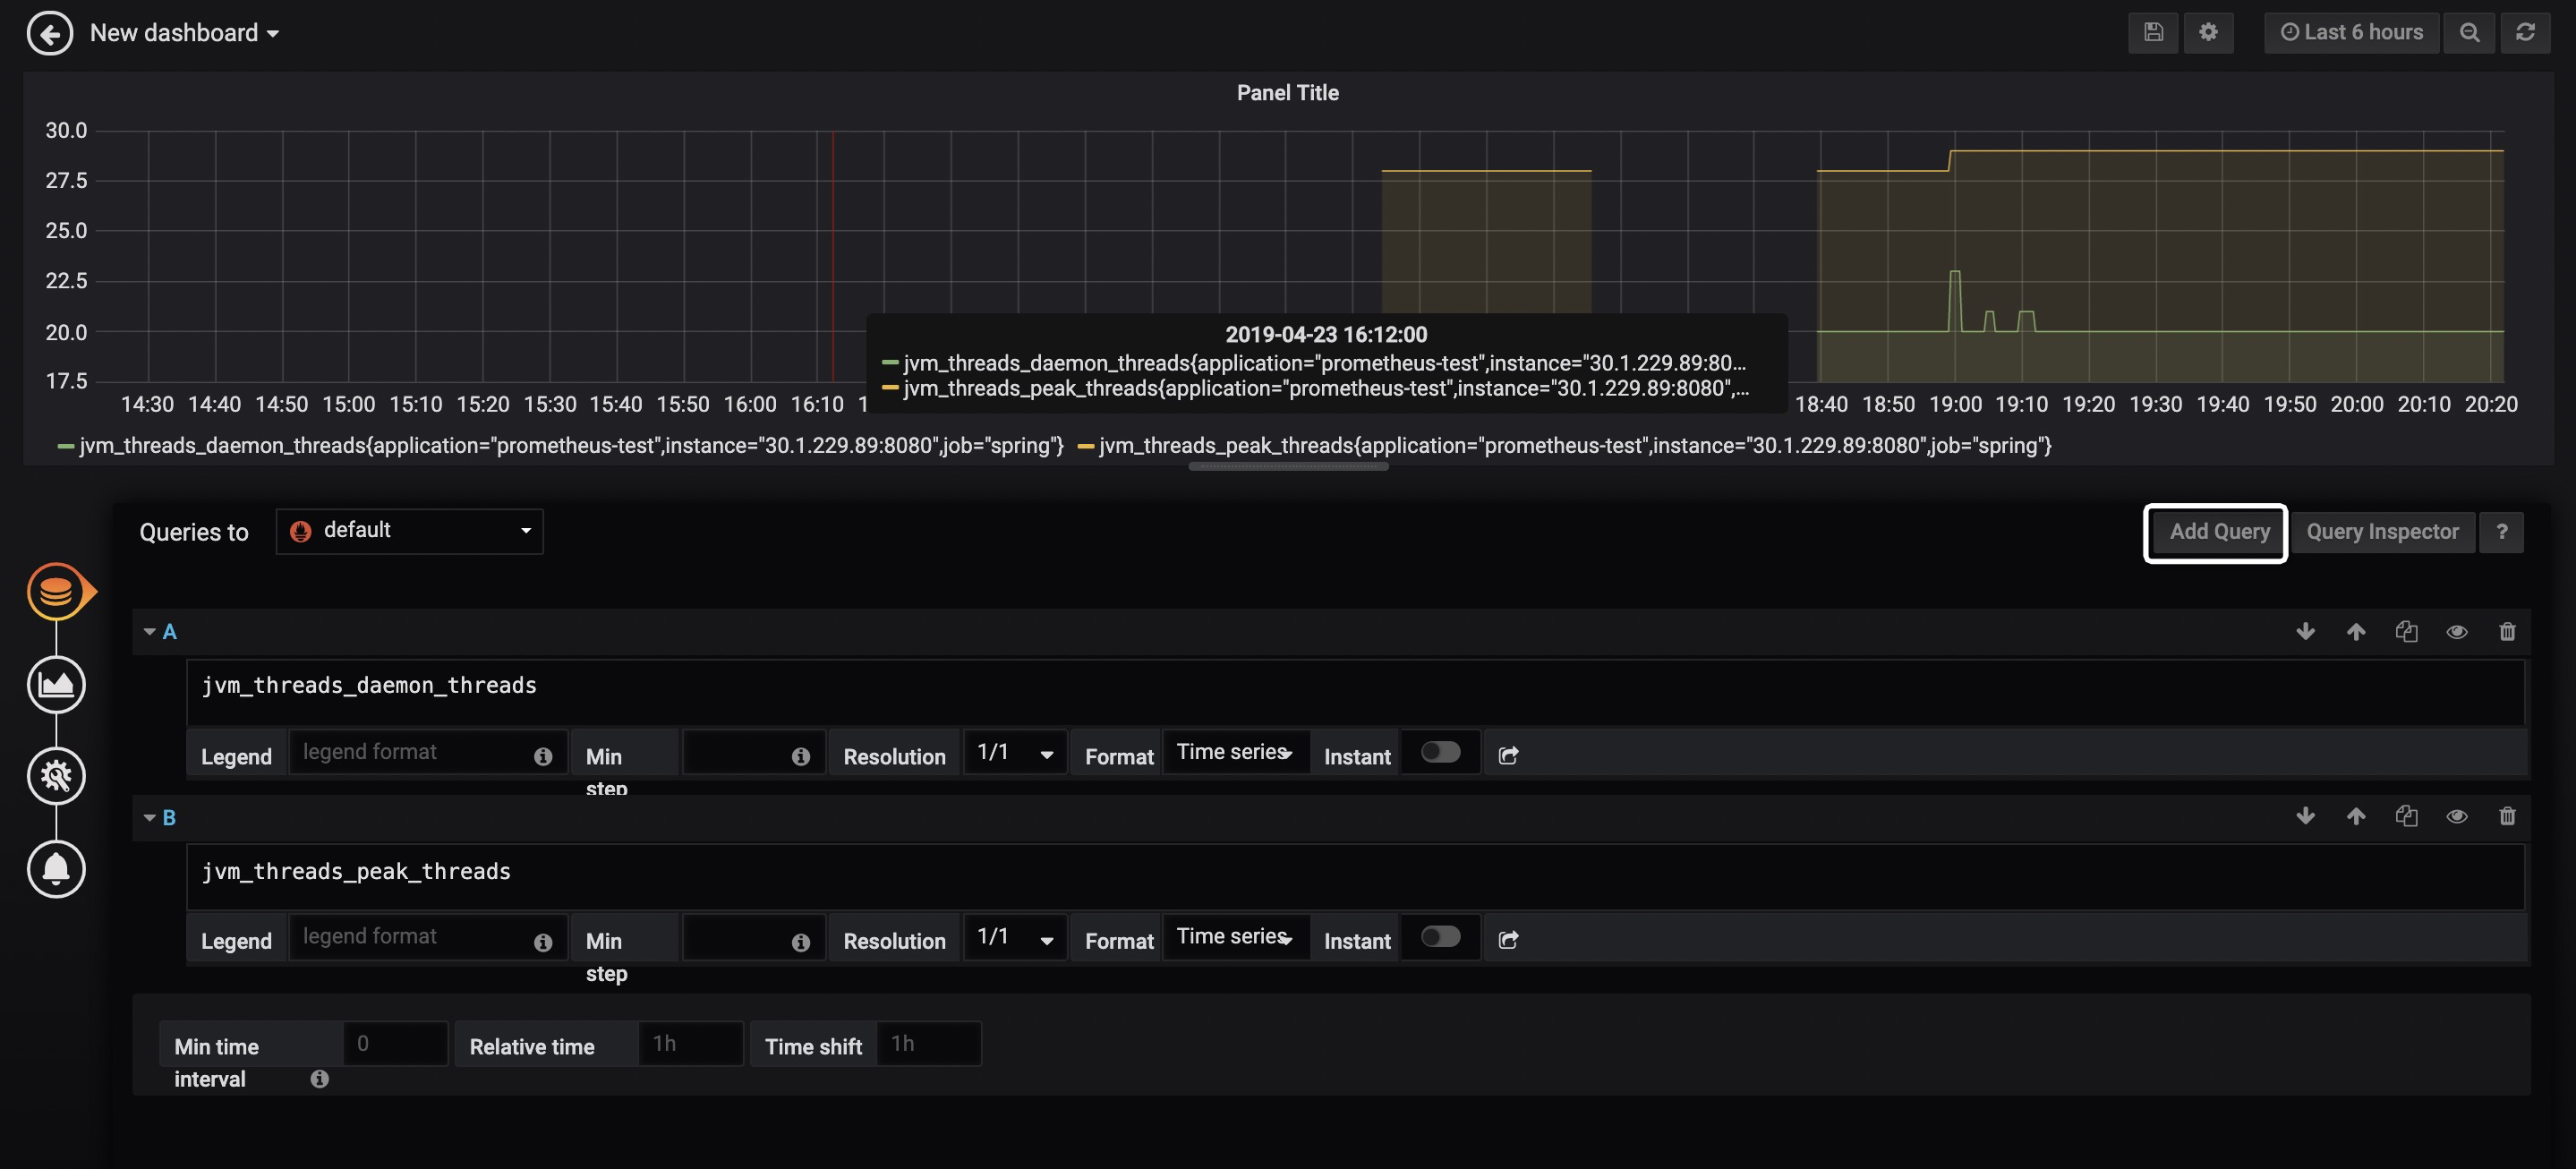
在白框标记的位置输入指标,指标的取值详见Spring Boot应用的
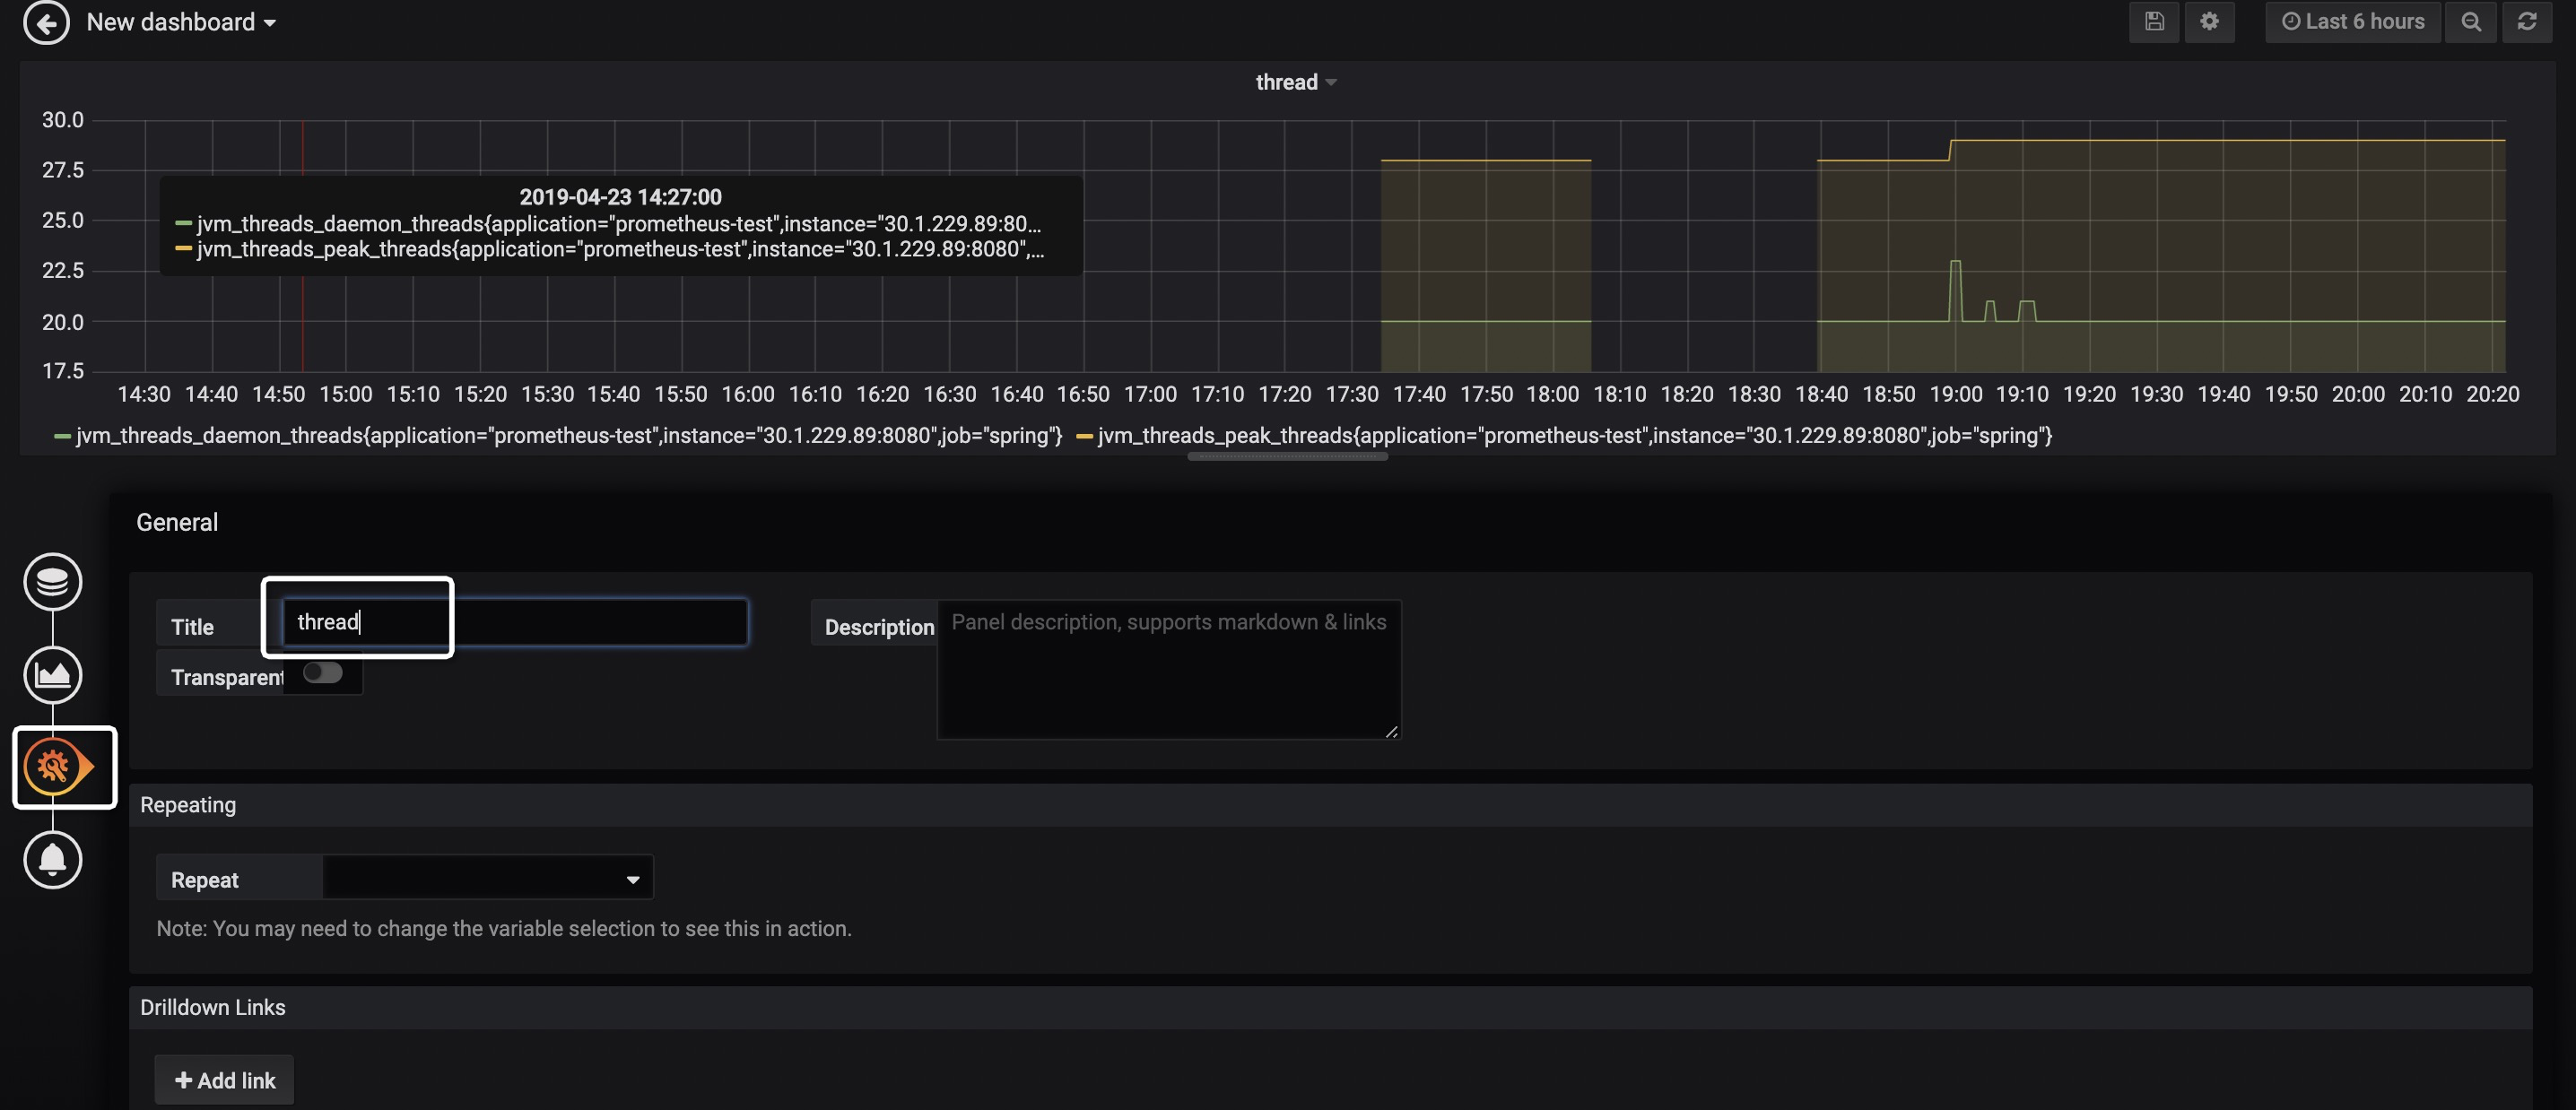
/actuator/prometheus端点,例如jvm_memory_used_bytes、jvm_threads_states_threads、jvm_threads_live_threads等,Grafana会给你较好的提示,并且支持较为复杂的计算,例如聚合、求和、平均等。如果想要绘制多个线条,可点击Add Query按钮,如上图所示,笔者为图表绘制了两条线,分别代表daemon以及peak线程。点击下图的按钮,并填入Title,即可设置图表标题。
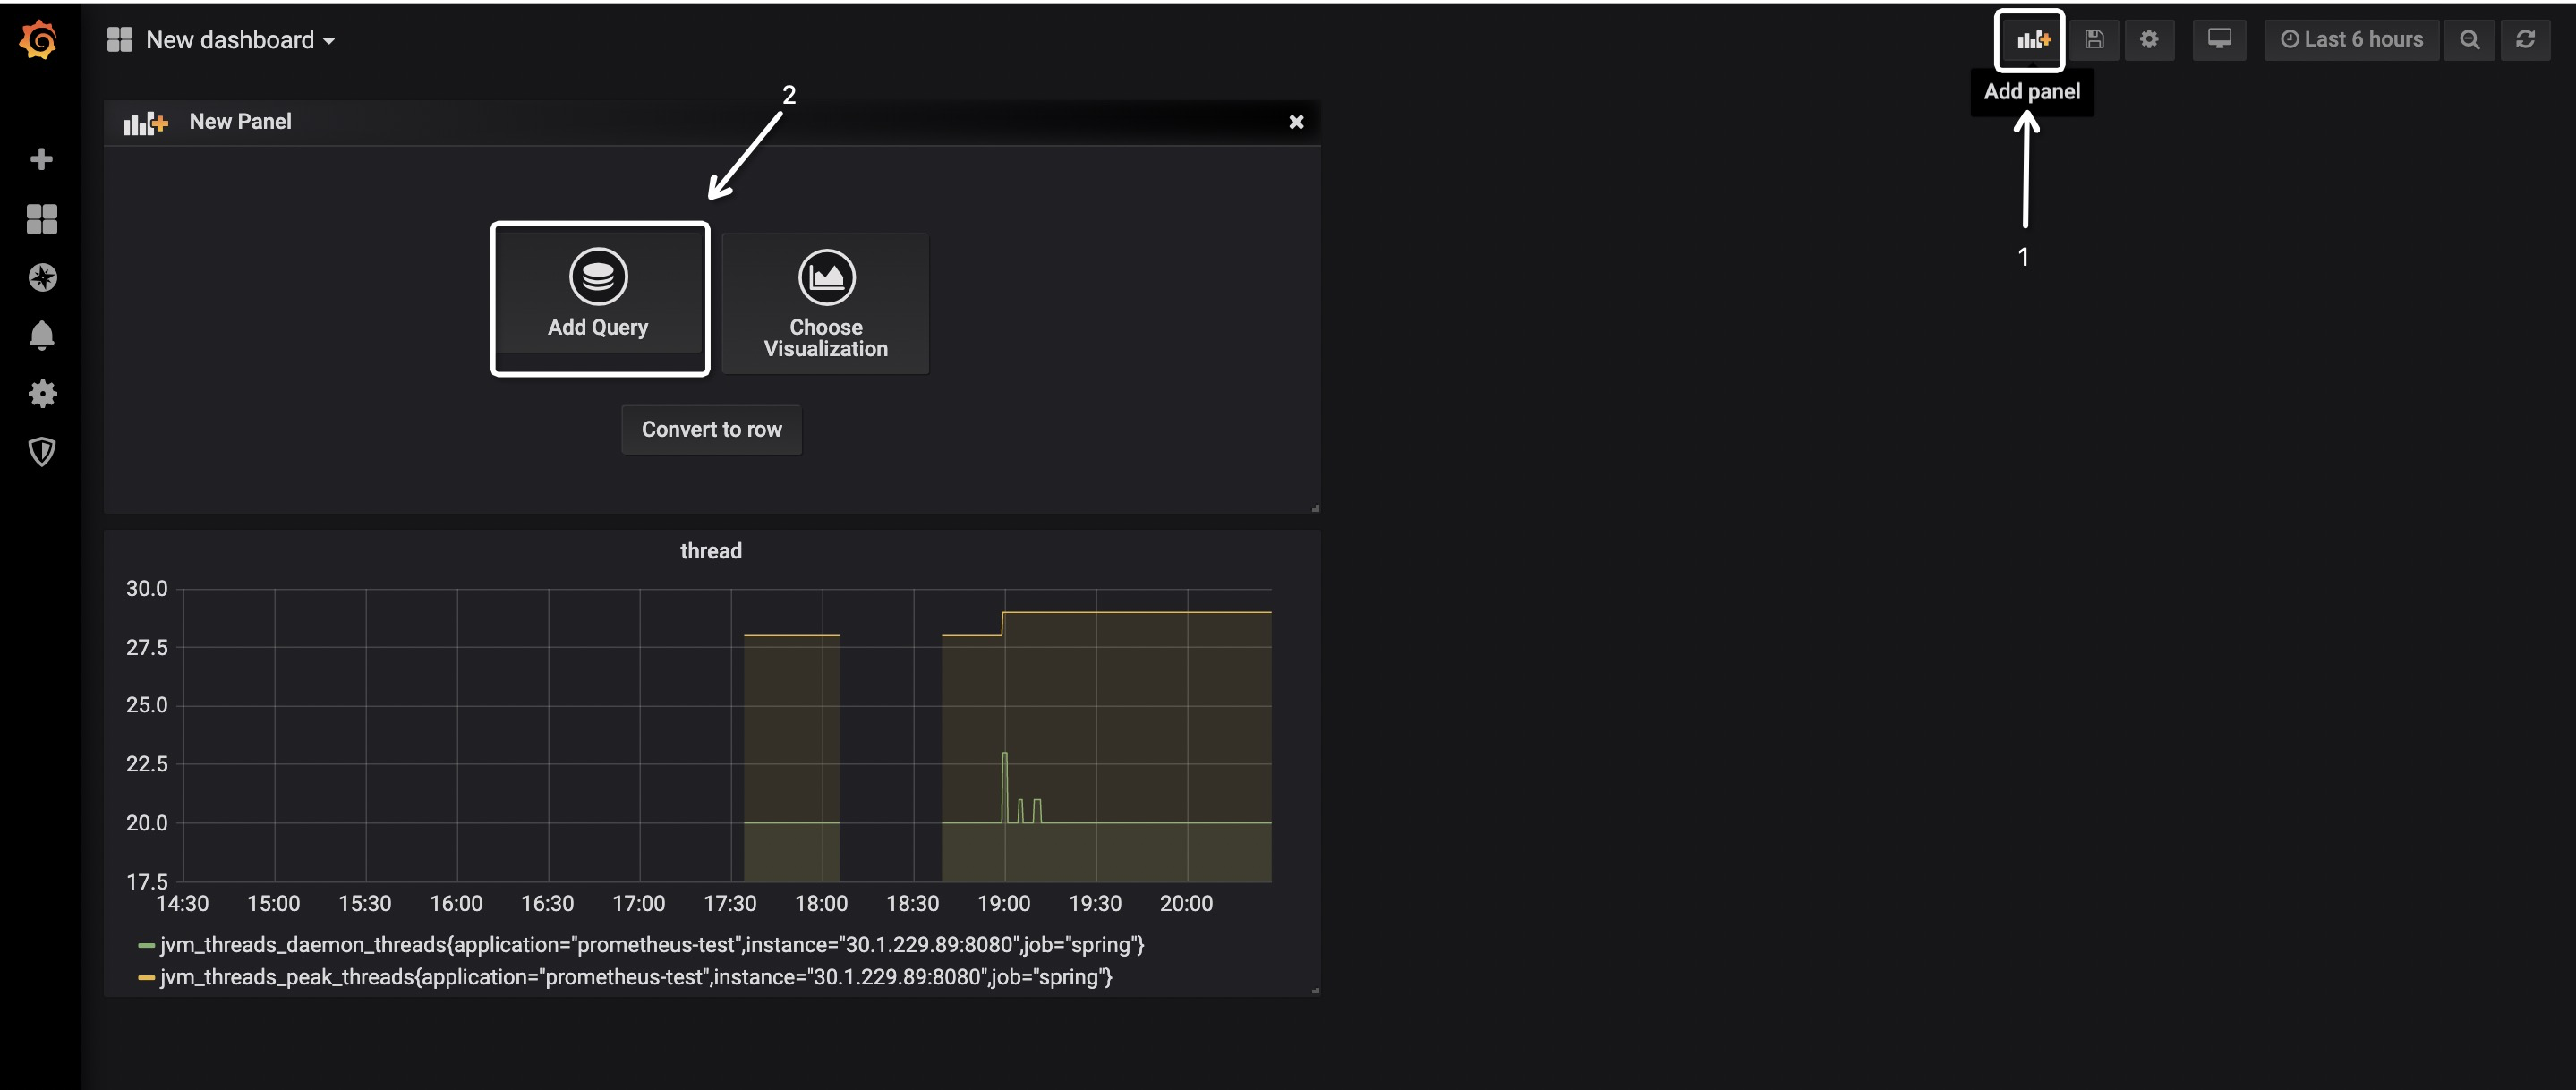
按下图步骤操作,即可为Dashboard添加新的图表。
Dashboard市场
至此,已可用Grafana实现较为丰富的图表展示——可将关心的监控指标放置到Dashboard上,并且非常灵活!然而,这个配置的操作虽然不难,但还是挺费时间的……
那么是否有配置好的又强大、又通用、拿来即用的Dashboard呢?答案是肯定的!前往 Grafana Lab - Dashboards ,输入关键词即可搜索指定Dashboard。
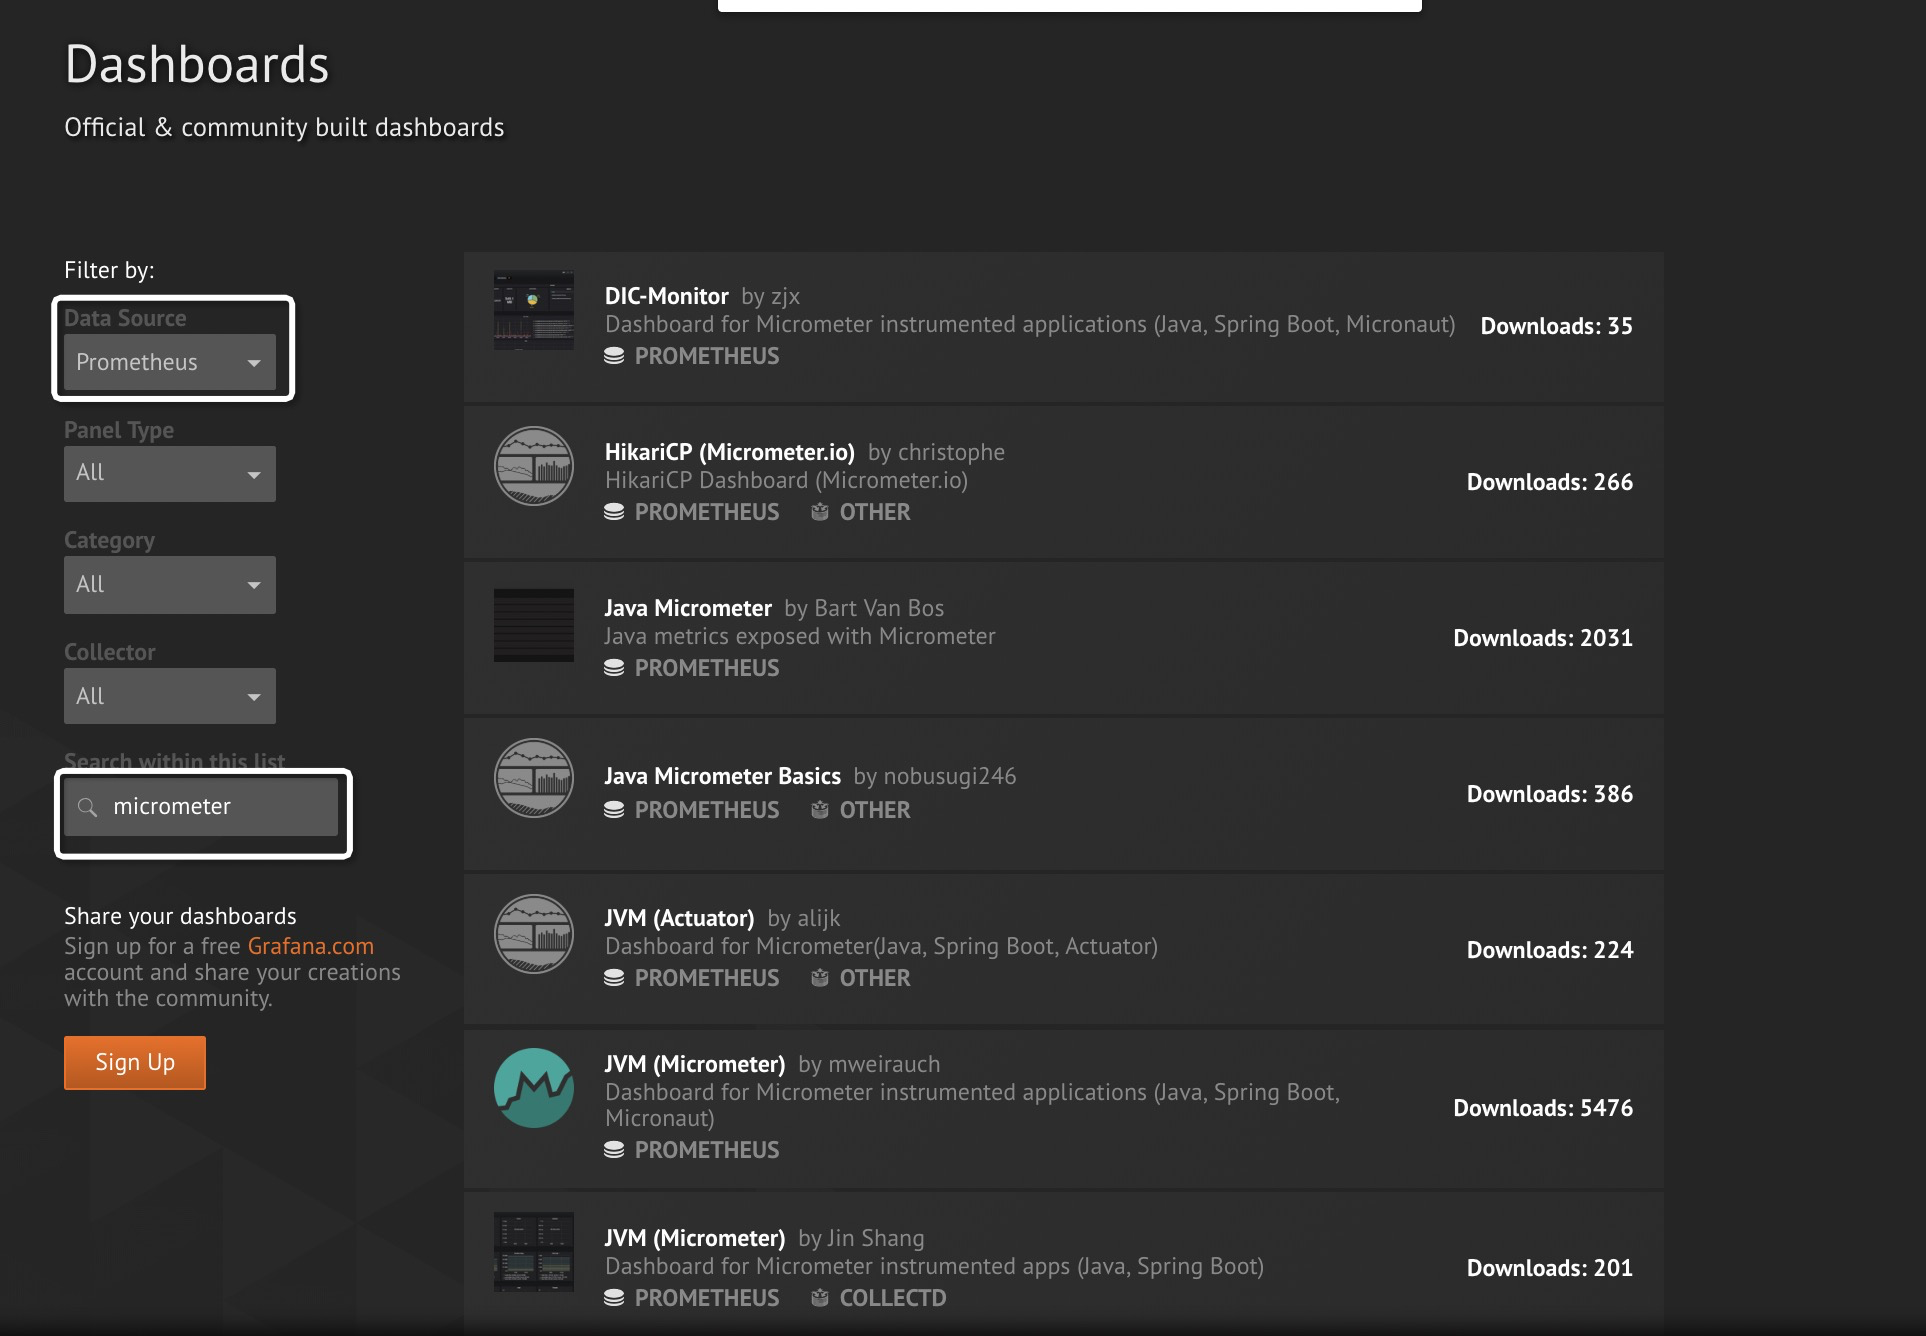
如上图所示,可以找到若干款以 Prometheus 作为数据源,支持Micrometer的Dashboard!下面,来演示如何使用 JVM(Micrometer) 这个Dashboard。
其他Dashboard使用方式大同小异,建议使用前先点击了解下详情,一般Dashboard中都会有说明。
点击
JVM(Micrometer)进入Dashboard详情介绍页,如下图所示: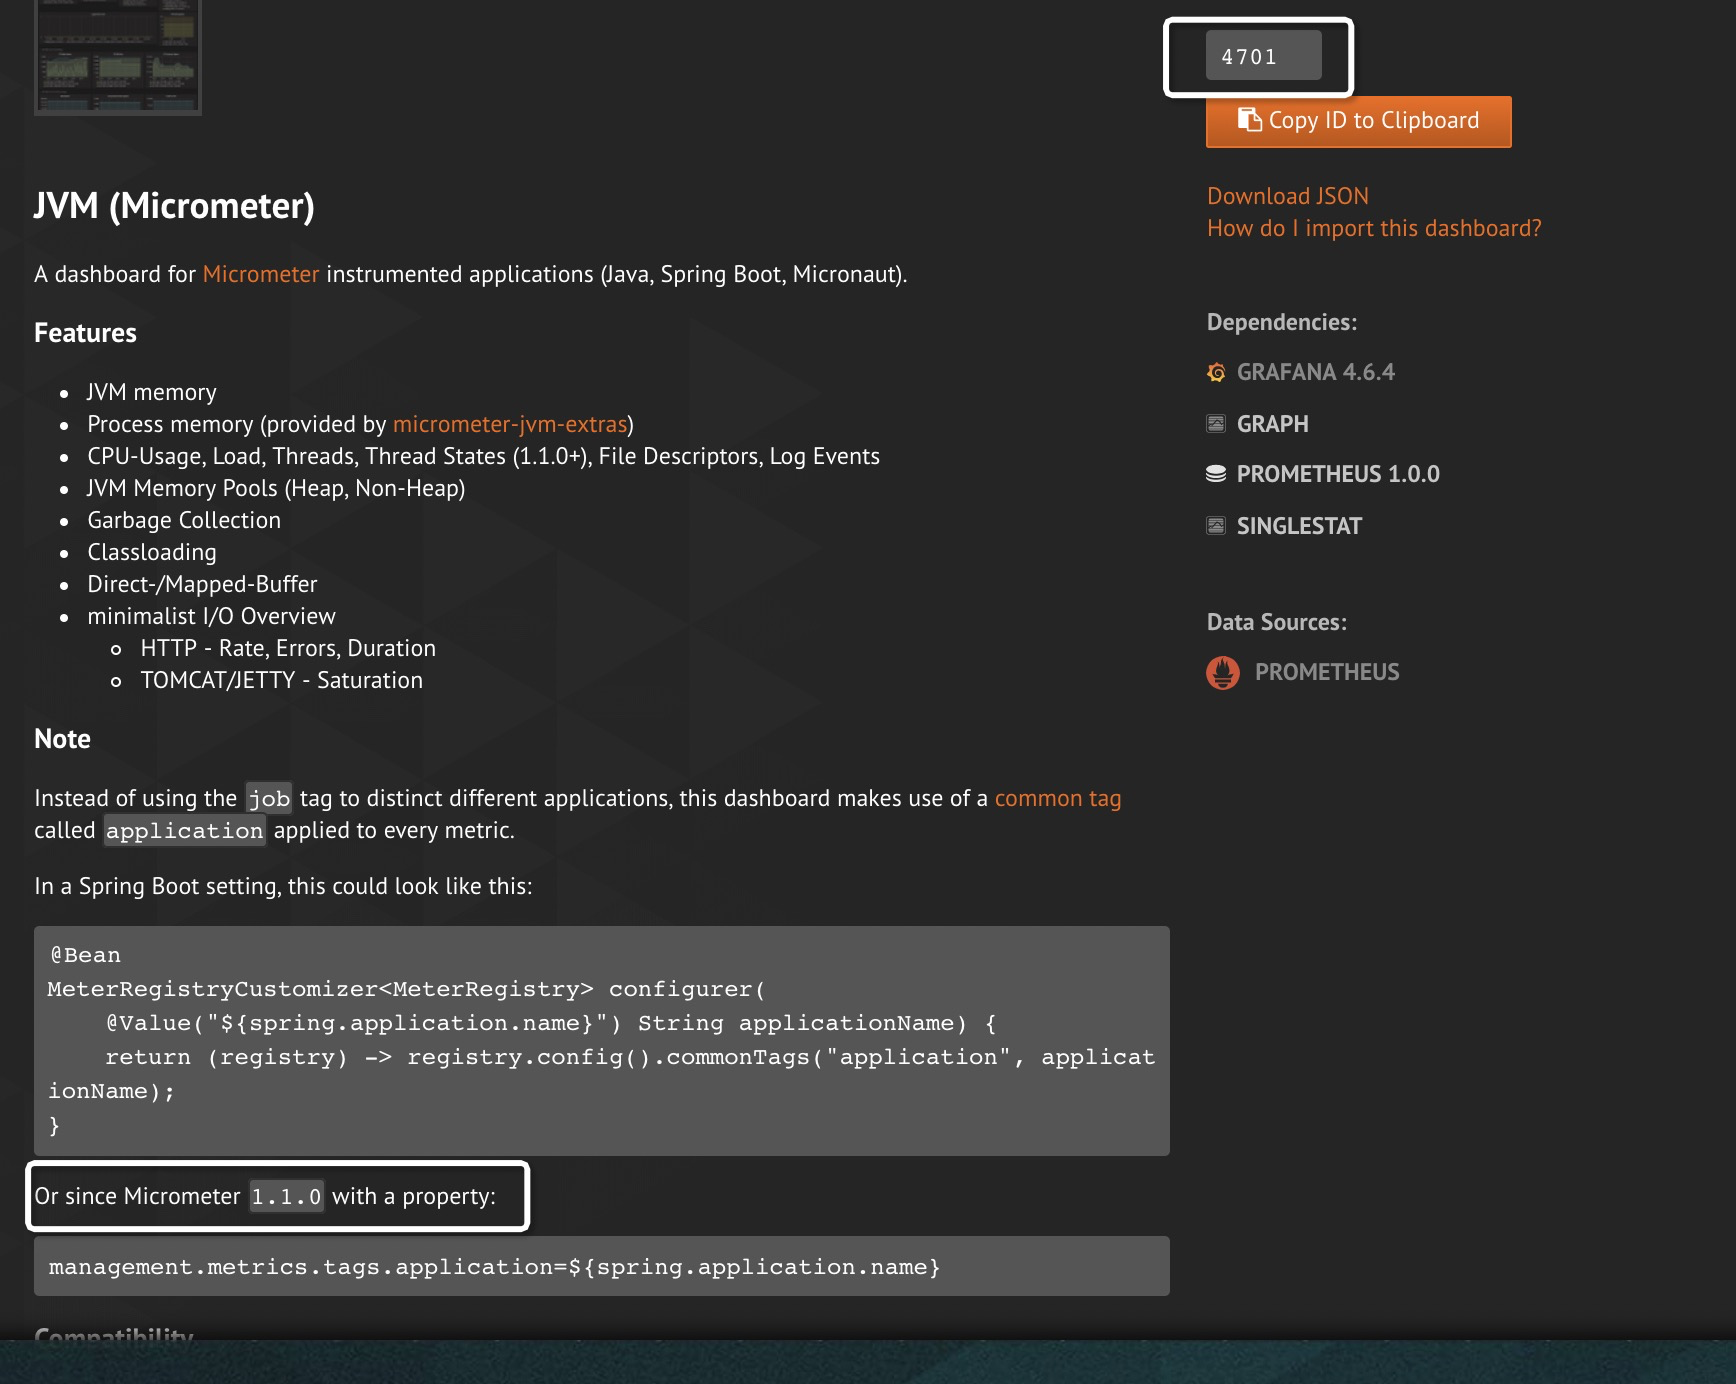
如图已详细描述了该Dashboard的特性、配置。其中的
management.metrics.tags.application,前面已经配置过了;本例也不打算演示Process memory特性,所以micrometer-jvm-extras怎么用也不打算引入了(这是该Dashboard作者为Micrometer提供的增强包,有兴趣的童鞋可自行点击过去研究)。细心的童鞋会发现,该页的右上角有个
4701这是一个非常重要的数字!访问
http://localhost:3000,按下图步骤操作: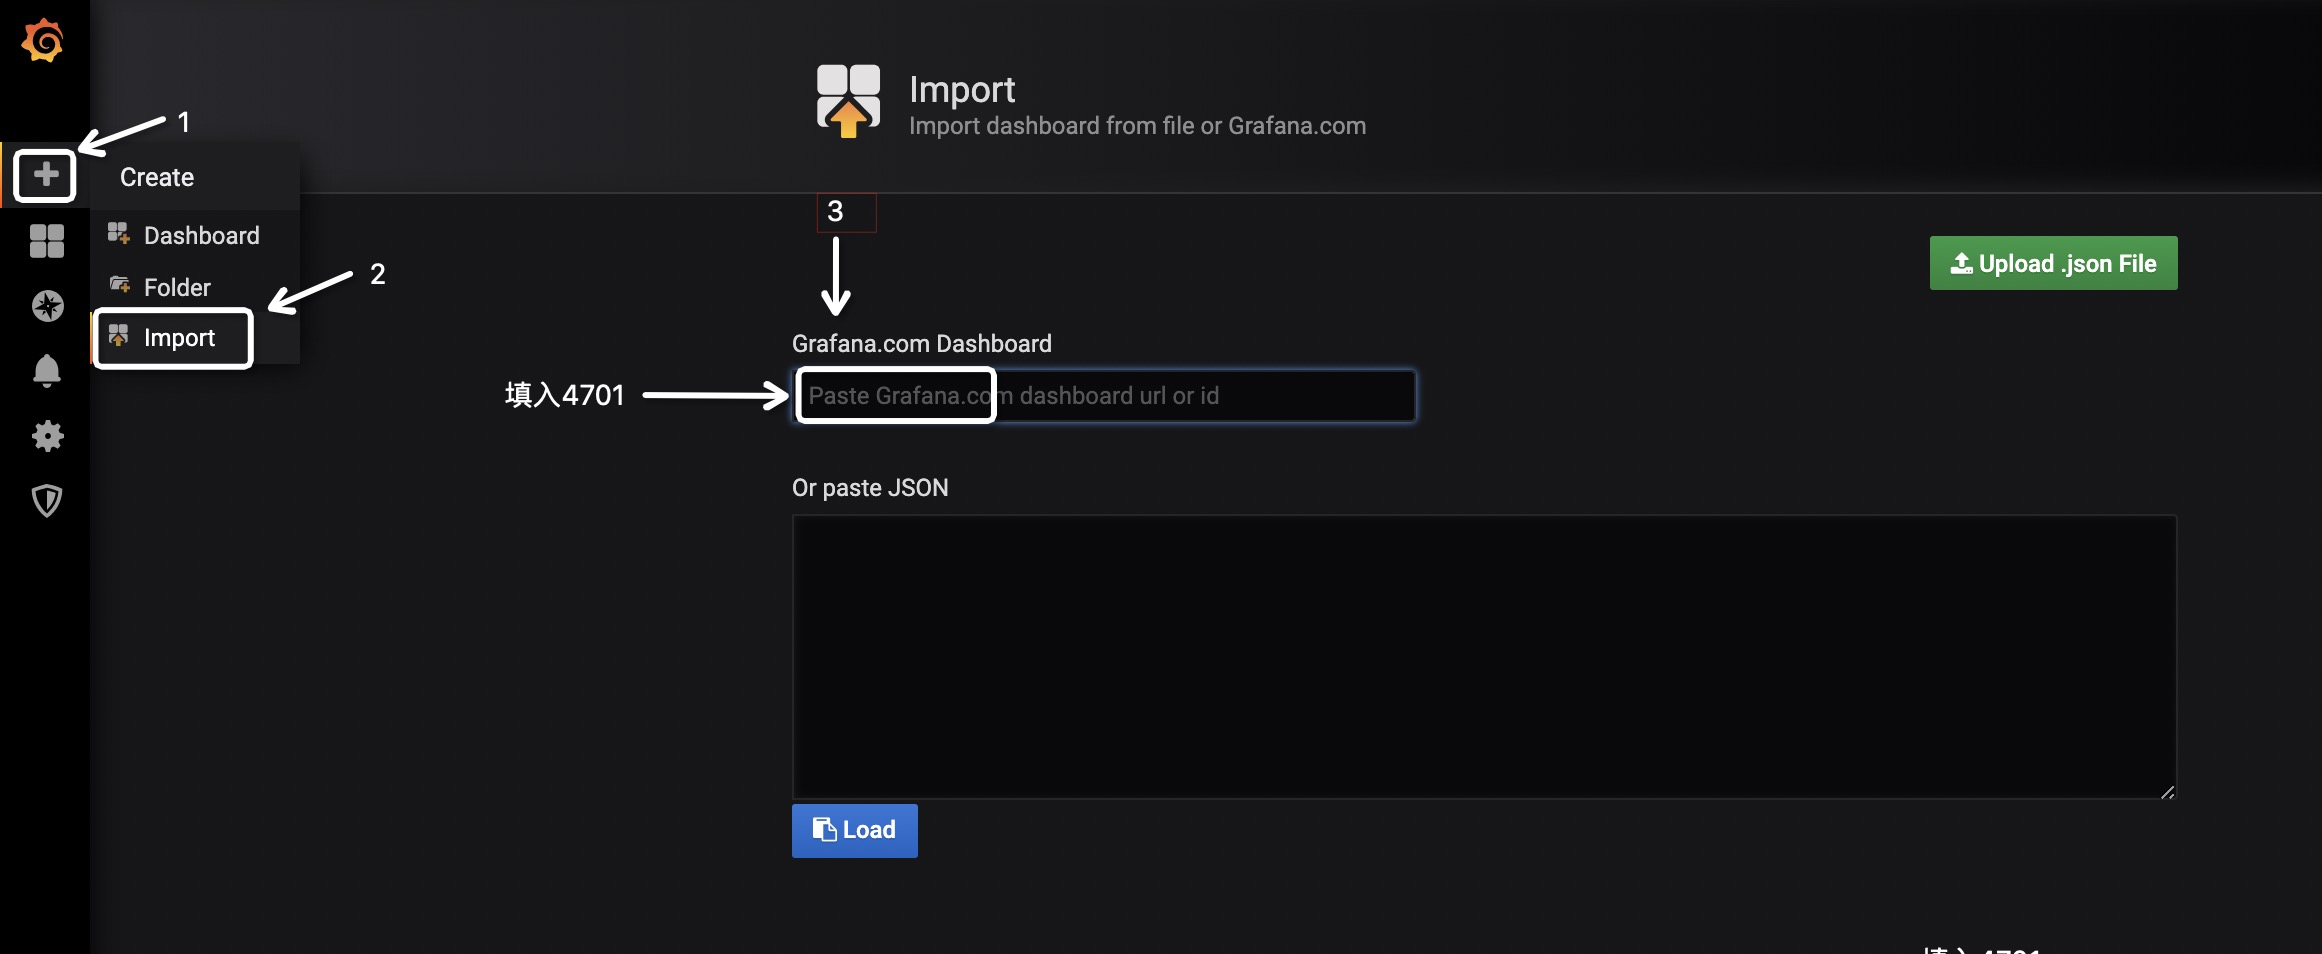
输入后即可看到类似如下的界面,选择数据源,并点击Import。
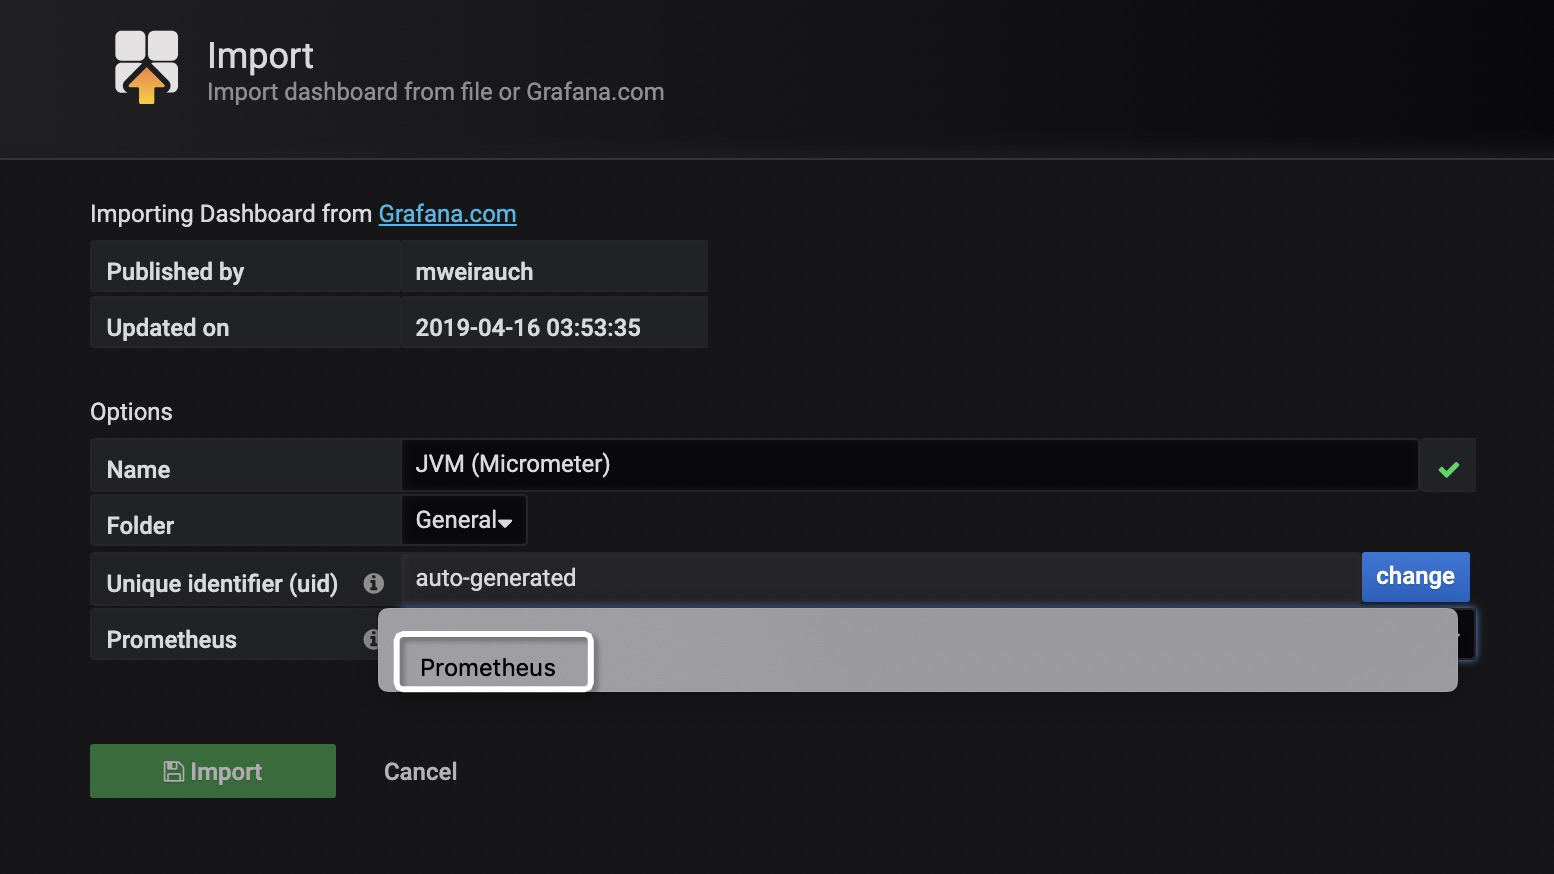
此时,即可看到类似如下的界面,如图所示,我们常关心的指标该Dashboard均已支持!
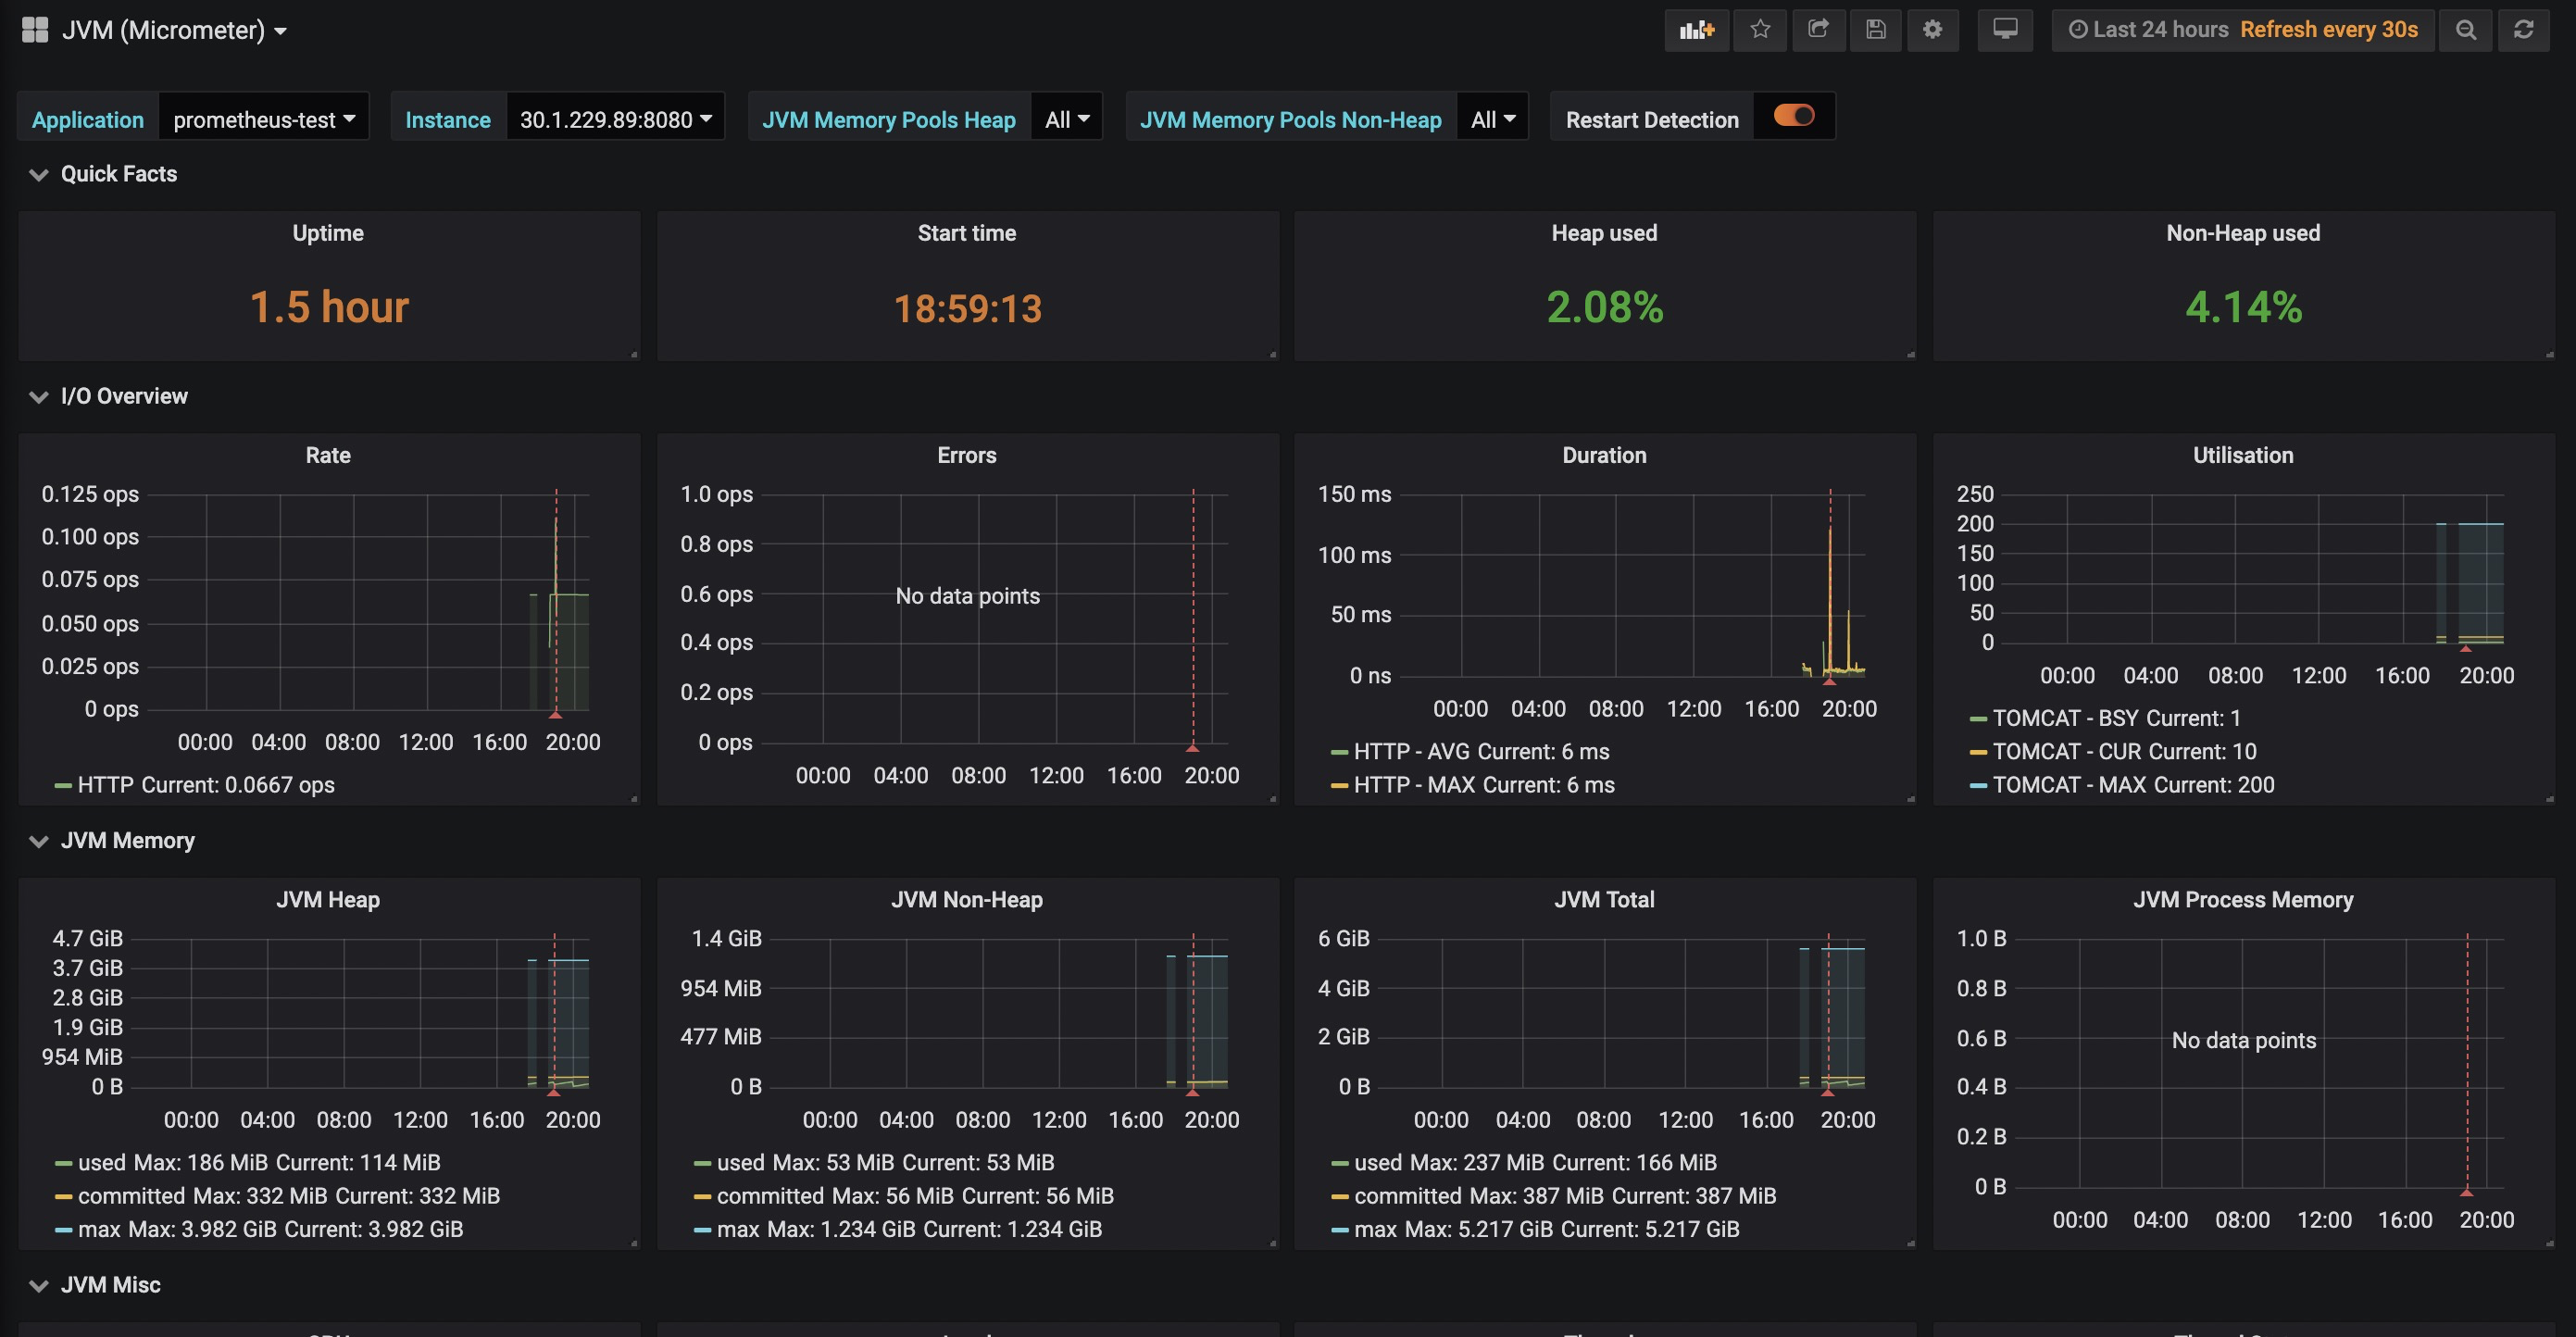
比较好用的Dashboard
- JVM (Micrometer)
- JVM (Actuator)
- Spring Boot Statistics ,注:该Dashboard可能有Bug,笔者未能直接测试成功,做了一些改动后才能正常显示。
以上三款是笔者亲测较为全面、好用的Dashboard,仅供参考。
告警
Grafana支持的告警渠道非常丰富,例如邮件、钉钉、Slack、Webhook等,非常实用!比较简单,各位看官自行研究下吧。
配套代码
其中 prometheus+grafana 目录已提供Docker一键部署Prometheus + Grafana的Shell。
Spring Boot 2.x监控数据可视化(Actuator + Prometheus + Grafana手把手)的更多相关文章
- (转)Spring Boot(二十):使用 spring-boot-admin 对 Spring Boot 服务进行监控
http://www.ityouknow.com/springboot/2018/02/11/spring-boot-admin.html 上一篇文章<Spring Boot(十九):使用 Sp ...
- Spring Boot Admin2.X监控的服务context-path问题
在使用Spring Boot Admin进行监控时,如果被监控的服务没有加context-path的话是不会有任何问题的,一旦服务加了context-path的配置,监控就会失败. 下图是正常情况的显 ...
- Spring Cloud Alibaba学习笔记(24) - Spring Boot Actuator 监控数据可视化:Spring Boot Admin
我们都知道,Spring Boot Actuator 提供监控数据是Json数据,在某种程度来说并不利于分析查看,那么如何将其进行可视化呢?我们有很多种选择,但是目前在这个领域,最流行的是Spring ...
- Spring Cloud第十三篇 | Spring Boot Admin服务监控
本文是Spring Cloud专栏的第十三篇文章,了解前十二篇文章内容有助于更好的理解本文: Spring Cloud第一篇 | Spring Cloud前言及其常用组件介绍概览 Spring Clo ...
- Spring Boot 默认的指标数据从哪来的?
了解有关 Spring Boot 默认指标及其来源的更多信息. 您是否注意到 Spring Boot 和 Micrometer 为您的应用生成的所有默认指标?如果没有 - 您可以将 actuator ...
- Spring Boot配置druid监控页功能
1.导入坐标 <?xml version="1.0" encoding="UTF-8"?> <project xmlns="http ...
- spring boot/cloud 应用监控
应用的监控功能,对于分布式系统非常重要.如果把分布式系统比作整个社会系统.那么各个服务对应社会中具体服务机构,比如银行.学校.超市等,那么监控就类似于警察局和医院,所以其重要性显而易见.这里说的,监控 ...
- Spring Boot 启动加载数据 CommandLineRunner
实际应用中,我们会有在项目服务启动的时候就去加载一些数据或做一些事情这样的需求. 为了解决这样的问题,Spring Boot 为我们提供了一个方法,通过实现接口 CommandLineRunner 来 ...
- 十三、 Spring Boot 启动加载数据 CommandLineRunner
实际应用中,我们会有在项目服务启动的时候就去加载一些数据或做一些事情这样的需求. 为了解决这样的问题,spring Boot 为我们提供了一个方法,通过实现接口 CommandLineRunner 来 ...
随机推荐
- Ubuntu部署Tomcat Web服务
在Ubuntu平台中安装TomCat 本文将为大家介绍TomCat在Ubuntu平台中如何进行部署使用,带你快速入门使用TomCat TomCat简介 Tomcat是Apache 软件基金会(Apac ...
- 清除SQL Server Management Studio的最近服务器列表
C:\Users\dell\AppData\Roaming\Microsoft\SQL Server Management Studio\12.0\SqlStudio.bin
- C#中的等值判断1
目录 简介 值类型和引用类型的相等比较 和相等比较相关的函数 string 和 System.Uri 的等值比较 泛型接口 IEquatable<T> 自定义比较方法 举例 总结 简介 最 ...
- 在集成环境中修改配置文件php.ini不生效的解决办法
配置完成之后一定要重启服务,如果重启服务还是不生效. 就去看一下phpinfo(),找到Loaded Configuration File选项,这个才是真正读取的配置文件
- 关于Qt画点及计算机专业基础课程介绍
在计算机图形图像学中,开始都是先画点,我曾经在汇编上tc2.0上画点,后来是MFC,VB,Qt,Python,我觉得对于计算机专业的选择QT的原因是它是个C系的功能强大庞大的库,可以少写很多代码,但是 ...
- 爬虫破解知乎登入(不使用Selenium模块)
一.分析 知乎完成登入的步骤 首先获得cookies(如果不获得后面验证码无法获得) 获得验证码 提交登入相关内容 前两步简单稍微细心寻找规律即可 其中最难的是第三步应该他前端进行了js加密 这里没什 ...
- Redis学习三(进阶功能).
一.排序 redis 支持对 list,set 和 zset 元素的排序,排序的时间复杂度是 O(N+M*log(M)).(N 是集合大小,M 为返回元素的数量) sort key [BY patte ...
- 帝国cms网站管理系统之安全设置最优化分享
首先我们来认识一下帝国CMS安全认证特性:帝国登录四重安全验证:第一重:密码双重MD5加密,密码不可破解,假如数据库被下载,也无法获取真实密码.第二重:后台目录自定义,假如对方知道密码也找不到登录后台 ...
- 从前端到全栈:JavaScript逆袭之路
JavaScript如何做到上天入地无所不能?JavaScript真的能一统江湖吗? 背景 近年来,前端技术日新月异,前端已经不仅仅是网页,更多的开始由狭义向广义发展. 先后涌现出了具备后端能力的no ...
- [JZOJ5781]【NOIP提高A组模拟2018.8.8】秘密通道
Description 有一副n*m的地图,有n*m块地,每块是下列四种中的一种:墙:用#表示,墙有4个面,分别是前面,后面,左面,右面.起点:用C表示,为主角的起点,是一片空地.终点:用F表示,为主 ...