Prometheus 监控 Nginx 流量 (三)
介绍
基于Openresty和Prometheus、Consul、Grafana设计的,实现了针对域名和Endpoint级别的流量统计,使用Consul做服务发现、KV存储,Grafana做性能图展示。
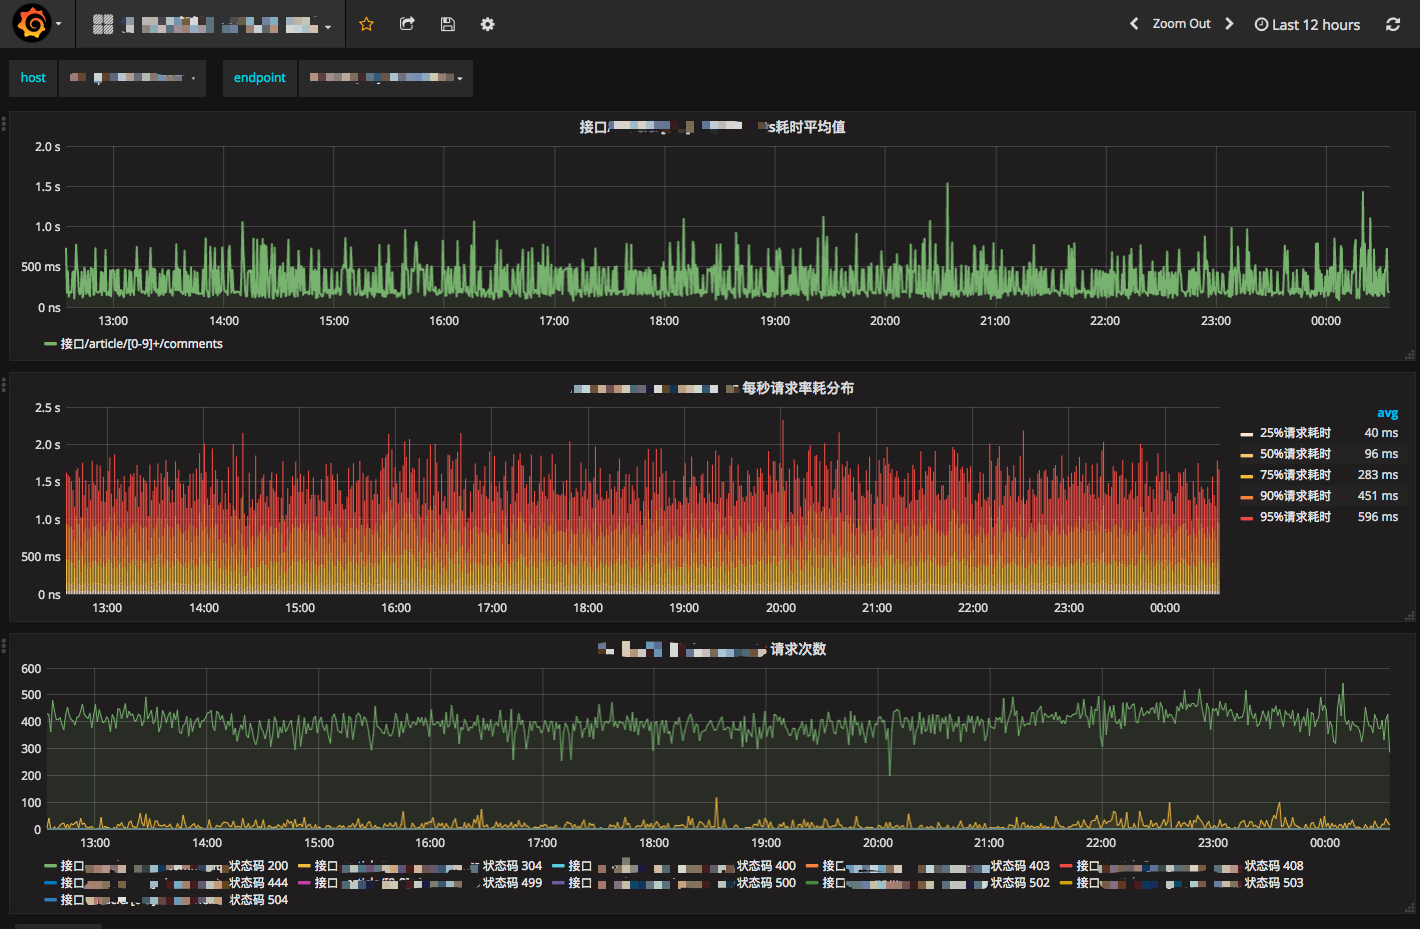
最终展现图
主要实现流程
POST Json 注册服务 -> Consul Service <- Prometheus -> 定时抓取 http指标接口 Nginx
POST KV 提交Endpoint -> Consul KV Service <- Nginx 定时更新需要监控的Endpoint
Grafana 读取 -> Prometheus
优点
- 基本实现自动化集中配置,各种接口使用非常简单
- 通过Prometheus提供了非常丰富的查询维度,例如(域名、Endpoint、状态码、协议类型、method),当然还可以非常简单地添加更多。
- Grafana图表功能强大,非常直观地查看各个服务的状态和发现异常。
安装和使用说明
本项目是基于Openresty开发,所以事先安装好Openresty,这个非常简单。
安装Consul,这是基于golang开发的服务自动发现工具,详细查看官方文档。https://www.consul.io/
安装Prometheus,这是一个时序数据库和监控工具,性能和存储十分可靠,把Prometheus配置发现服务使用Consul。官方文档:https://prometheus.io/docs/operating/configuration/#<consul_sd_config>
安装Grafana。https://grafana.com/
安装 扩展程序
克隆 lua-nginx-prometheus 仓库到Openresty服务器上。
克隆依赖Prometheus nginx-lua-prometheus 仓库到服务器上。
克隆依赖Consul lua-resty-consul 仓库到服务器上。
把lua-nginx-prometheus仓库中的 counter.conf文件复制到Openresty目录下的nginx/conf/conf.d目录内。
编辑 counter.conf 文件
lua_package_path "/Users/zl/Work/Counter/nginx-lua-prometheus/?.lua;;/Users/zl/Work/Counter/lua-resty-consul/lib/resty/?.lua;;/Users/zl/Work/Counter/lib/?.lua;;";
修改lua_package_path参数,把 lua-nginx-prometheus、nginx-lua-prometheus、lua-resty-consul三个目录位置指定,目录下一定是包含 ?.lua。
    consul_host = "<Your consul host ip>"

    consul_port = <Your consul port>
把consul的地址和端口替换上。
server {

    listen 9145;

    allow 127.0.0.1;

    deny all;

    access_log off;

    location /metrics {

        content_by_lua 'prometheus:collect()';

    }

}
添加allow 允许指定ip访问 指标接口。
启动Openresty后,试试 http://<ip>:9145/metrics
配置 Prometheus 服务发现功能
详细参考这个文档
https://prometheus.io/docs/operating/configuration/#<consul_sd_config>
完成后,通过Consul 的 http API进行注册服务。
curl -X PUT -d @test.json http://<ip>:<port>/v1/agent/service/register
{

  "ID": <定义唯一的ID>,

  "Name": "对应prometheus consul_sd_config",

  "Tags": [

    ""

  ],

  "Address": <Openresty地址>,

  "Port": 9145

}
注销服务
curl http://<ip>:<port>/v1/agent/service/deregister/<ID>
配置 Consul KV存储
增加域名和对应的Endpoint
curl --request PUT --data @test.json http://<ip>:<port>/v1/kv/domain/<api.qq.com>/routers
数组
[

"/users/[0-9]+/followers/",

"/users/[0-9]+/",

"/users/[0-9]+/comments/",

"/news"

]
配置Grafana 到 Prometheus上读取数据
详细文档参考 https://prometheus.io/docs/visualization/grafana/
创建图表
常见查询语句
sum(irate(nginx_http_request_duration_seconds_count{host="api.qq.com"}[5m])) by (status)
多台服务器合计每秒请求量,查询单个域名,group by 用状态码
sum(rate(nginx_http_request_duration_seconds_sum{host="api.qq.com",endpoint!="/ws"}[1m])) / sum(rate(nginx_http_request_duration_seconds_count{host="api.qq.com",endpoint!="/ws"}[1m]))
接口平均响应时间, 不包含 websocket接口
histogram 直方图非常有用,可以详细了解一下。
topk(5, sum(rate(nginx_http_request_duration_seconds_sum{host="api.qq.com",endpoint!="/ws"}[1h])) by (endpoint)/sum(rate(nginx_http_request_duration_seconds_count{host="api.qq.com",endpoint!="/ws"}[1h])) by (endpoint))
5个响应时间最大的,不包含 websocket接口
代码已经放到github上了
https://github.com/vovolie/lua-nginx-prometheus
有兴趣的可以看看啊。
Prometheus 监控 Nginx 流量 (三)的更多相关文章
- 05 . Prometheus监控Nginx
List CentOS7.3 prometheus-2.2.1.linux-amd64.tar.gz nginx-module-vts 节点名 IP 软件版本 硬件 网络 说明 Prometheus ...
- Prometheus监控Nginx
转载自:https://www.cnblogs.com/you-men/p/13173245.html CentOS7.3 prometheus-2.2.1.linux-amd64.tar.gz ng ...
- 用prometheus监控Nginx
GitHub上官方地址:https://github.com/knyar/nginx-lua-prometheus 告警规则地址:https://awesome-prometheus-alerts.g ...
- Prometheus(三):Prometheus监控交换机(snmp)
默认已安装Prometheus服务,服务地址:192.168.56.200 一.获取交换机snmp信息 snmp服务IP(交换机IP):172.20.2.83 snmp community:dfete ...
- 基于k8s集群部署prometheus监控ingress nginx
目录 基于k8s集群部署prometheus监控ingress nginx 1.背景和环境概述 2.修改prometheus配置 3.检查是否生效 4.配置grafana图形 基于k8s集群部署pro ...
- Prometheus监控神器-Alertmanager篇(1)
本章节主要涵盖了Alertmanager的工作机制与配置文件的比较详细的知识内容,由浅入深的给大家讲解. 警报一直是整个监控系统中的重要组成部分,Prometheus监控系统中,采集与警报是分离的.警 ...
- Prometheus监控学习笔记之360基于Prometheus的在线服务监控实践
0x00 初衷 最近参与的几个项目,无一例外对监控都有极强的要求,需要对项目中各组件进行详细监控,如服务端API的请求次数.响应时间.到达率.接口错误率.分布式存储中的集群IOPS.节点在线情况.偏移 ...
- Kubernetes容器集群管理环境 - Prometheus监控篇
一.Prometheus介绍之前已经详细介绍了Kubernetes集群部署篇,今天这里重点说下Kubernetes监控方案-Prometheus+Grafana.Prometheus(普罗米修斯)是一 ...
- Kubernetes 系列(五):Prometheus监控框架简介
由于容器化和微服务的大力发展,Kubernetes基本已经统一了容器管理方案,当我们使用Kubernetes来进行容器化管理的时候,全面监控Kubernetes也就成了我们第一个需要探索的问题.我们需 ...
随机推荐
- string.PadLeft & string.PadRight
比如我想让他的长度是20个字符有很多字符串如string a = "123",只有3个字符怎么让他们在打印或显示在textBox上的时候不够的长度用空格补齐呢? string.Pa ...
- i3 窗口管理器使 Linux 更美好
导读 Linux(和一般的开源软件)最美好的一点是自由 —— 可以在不同的替代方案中进行选择以满足我们的需求. 我使用 Linux 已经很长时间了,但我从来没有对可选用的桌面环境完全满意过.直到去年, ...
- java 前台使用枚举方法(二)
最近发现,前台jsp使用枚举,有一个更方便的方法. 首先 枚举类的封装大家看一下:http://blog.csdn.net/hanjun0612/article/details/72845960 然后 ...
- MT【239】离心率最大
已知点$A$为椭圆$\dfrac{x^2}{a^2}+\dfrac{y^2}{b^2}=1(a>b>0)$的左顶点,$O$为坐标原点,过椭圆的右焦点$F$作垂直于$x$轴的直线$l$.若直 ...
- 【转载】LCT
原标题:LCT(Link-Cut Tree)详解(蒟蒻自留地) 出处:https://blog.csdn.net/saramanda/article/details/55253627 如果你还没有接触 ...
- json序列化 & 反序列化
json序列化: json的dumps方法可以将json格式数据序列为python的相关数据类型,比如str,常用于打印,另外,在序列化时,中文汉字被转换为unicode编码,在dumps函数中添加参 ...
- php多进程、IPC和事件驱动
http://www.laruence.com/2008/04/21/101.html http://zhidao.baidu.com/link?url=zXm_12CxqGo-xYvOF4oyBJC ...
- luogu4269 Snow Boots G (并查集)
对于某个靴子,如果0代表某个格能走,1代表不能走,那么只要连续的1的个数的最大值>=靴子的步长,那这个靴子就不能用. 那么只要对靴子和格子都按深度排个序,然后从大到小来扫一遍(靴子越来越浅,能走 ...
- Linux中禁用命令历史记录
关闭history记录功能 set +o history 打开history记录功能 set -o history 清空记录 history -c 记录被清空,重新登录后恢复. rm -f $HOME ...
- AtCoder Grand Contest 010 D - Decrementing
题目描述 有n个整数,其中第i个数为Ai.这些数字的gcd为1.两人轮流操作,每次操作把一个大于1的数减1,并把所有数除以所有数的最大公约数,最后无法操作者输,求是否先手必胜. 如果当前的sum为偶数 ...