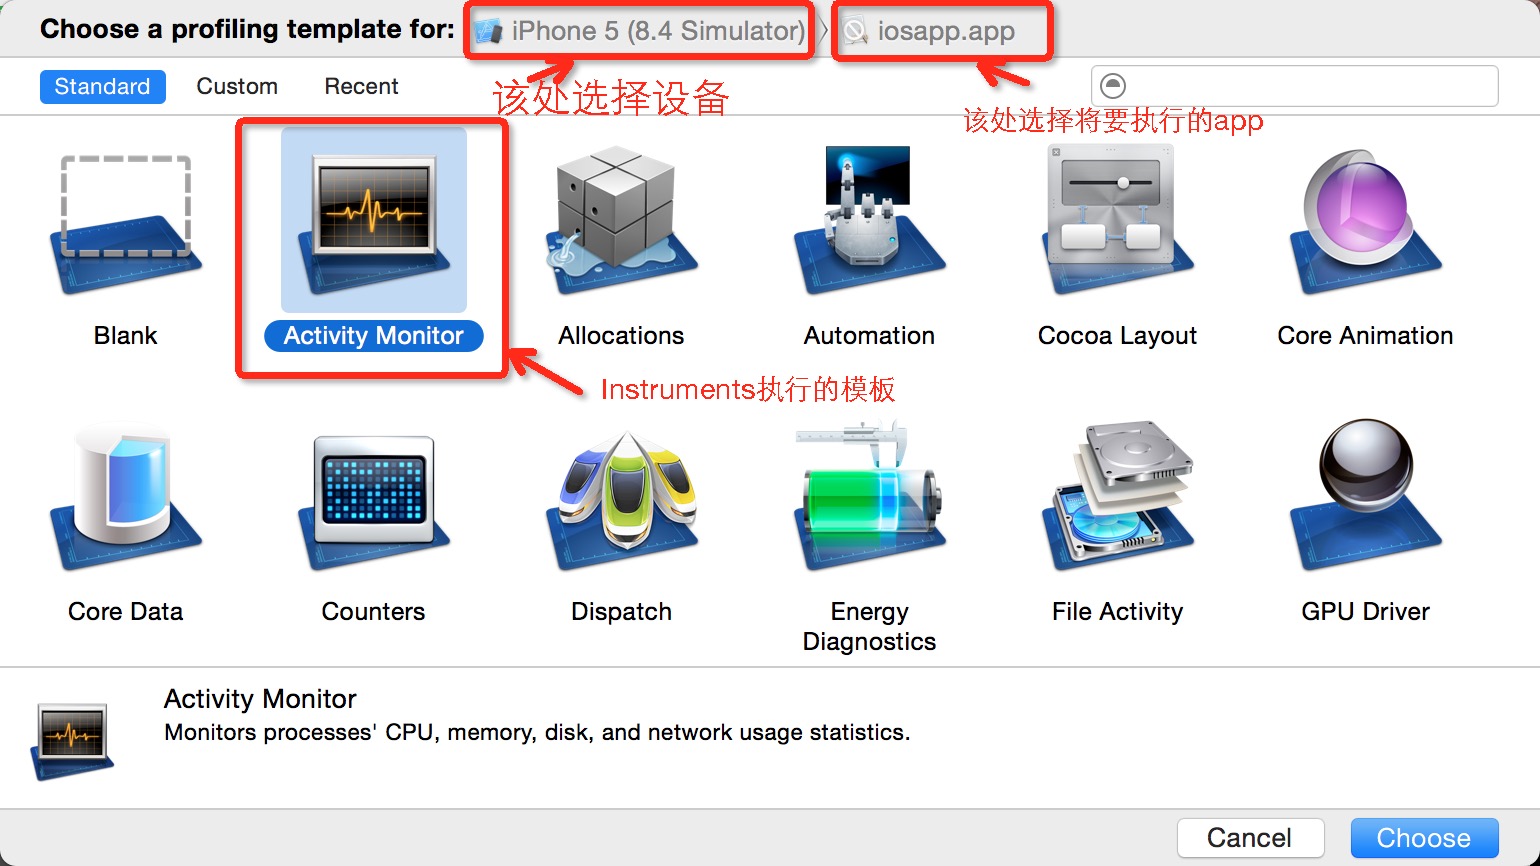
Instruments之Activity Monitor使用入门
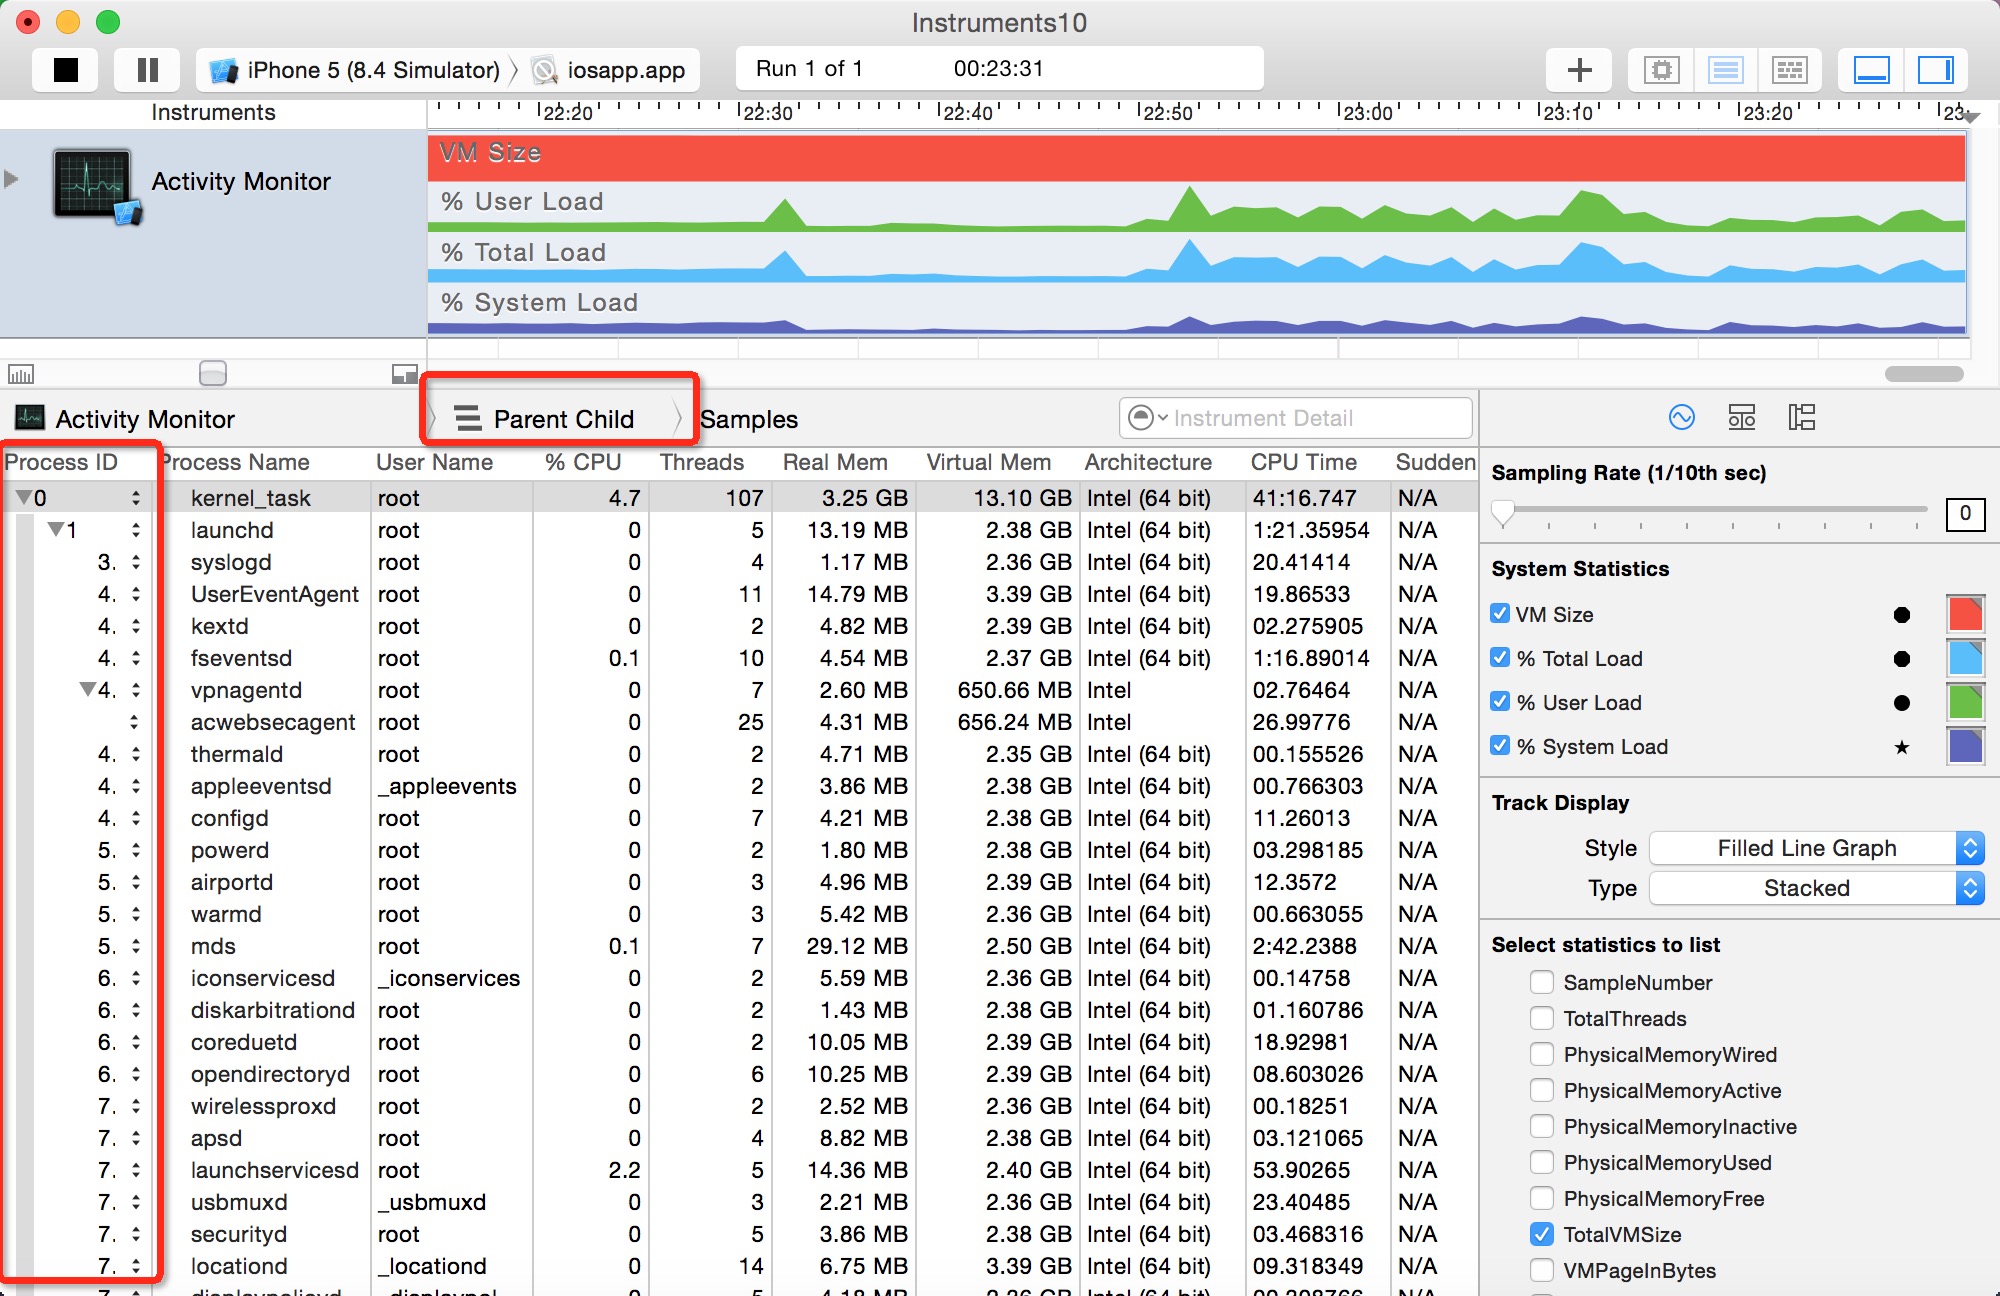
parent child information)-----父进程和子进程的关系,以及各个进程的概要信息

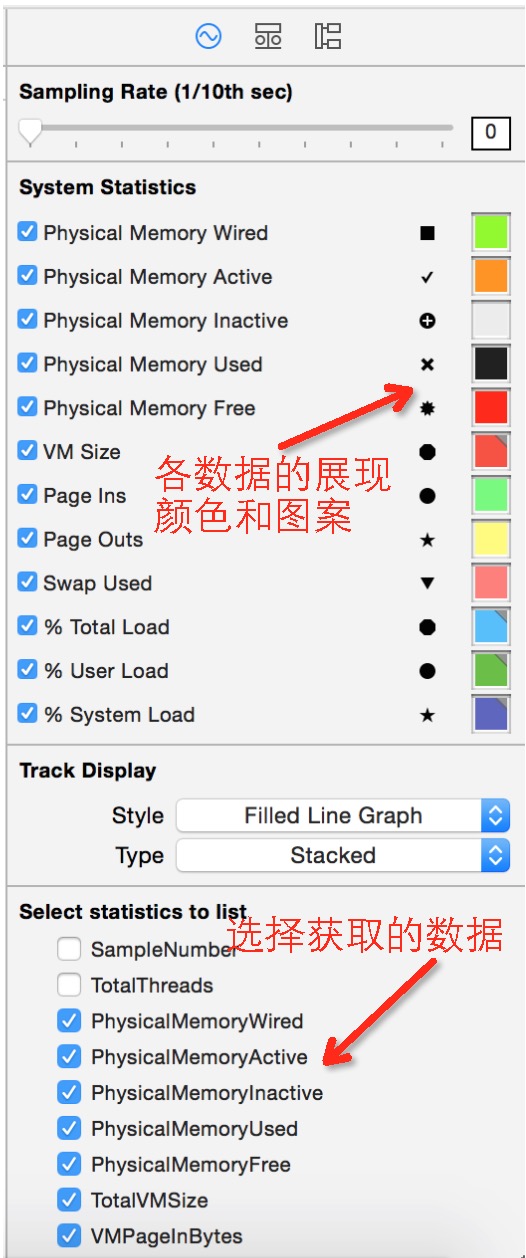
- Physical Memory Wired——操作系统占用的内存
- Physical Memory Active——除操作系统外其它进程占用的内存
- Physical Memory Inactive——最近被释放的内存
- Physical Memory Used——profiling当前进程时使用的总内存
- Physical Memory Free——当前的可用内存
- Total VM Size——虚拟内存的占用量
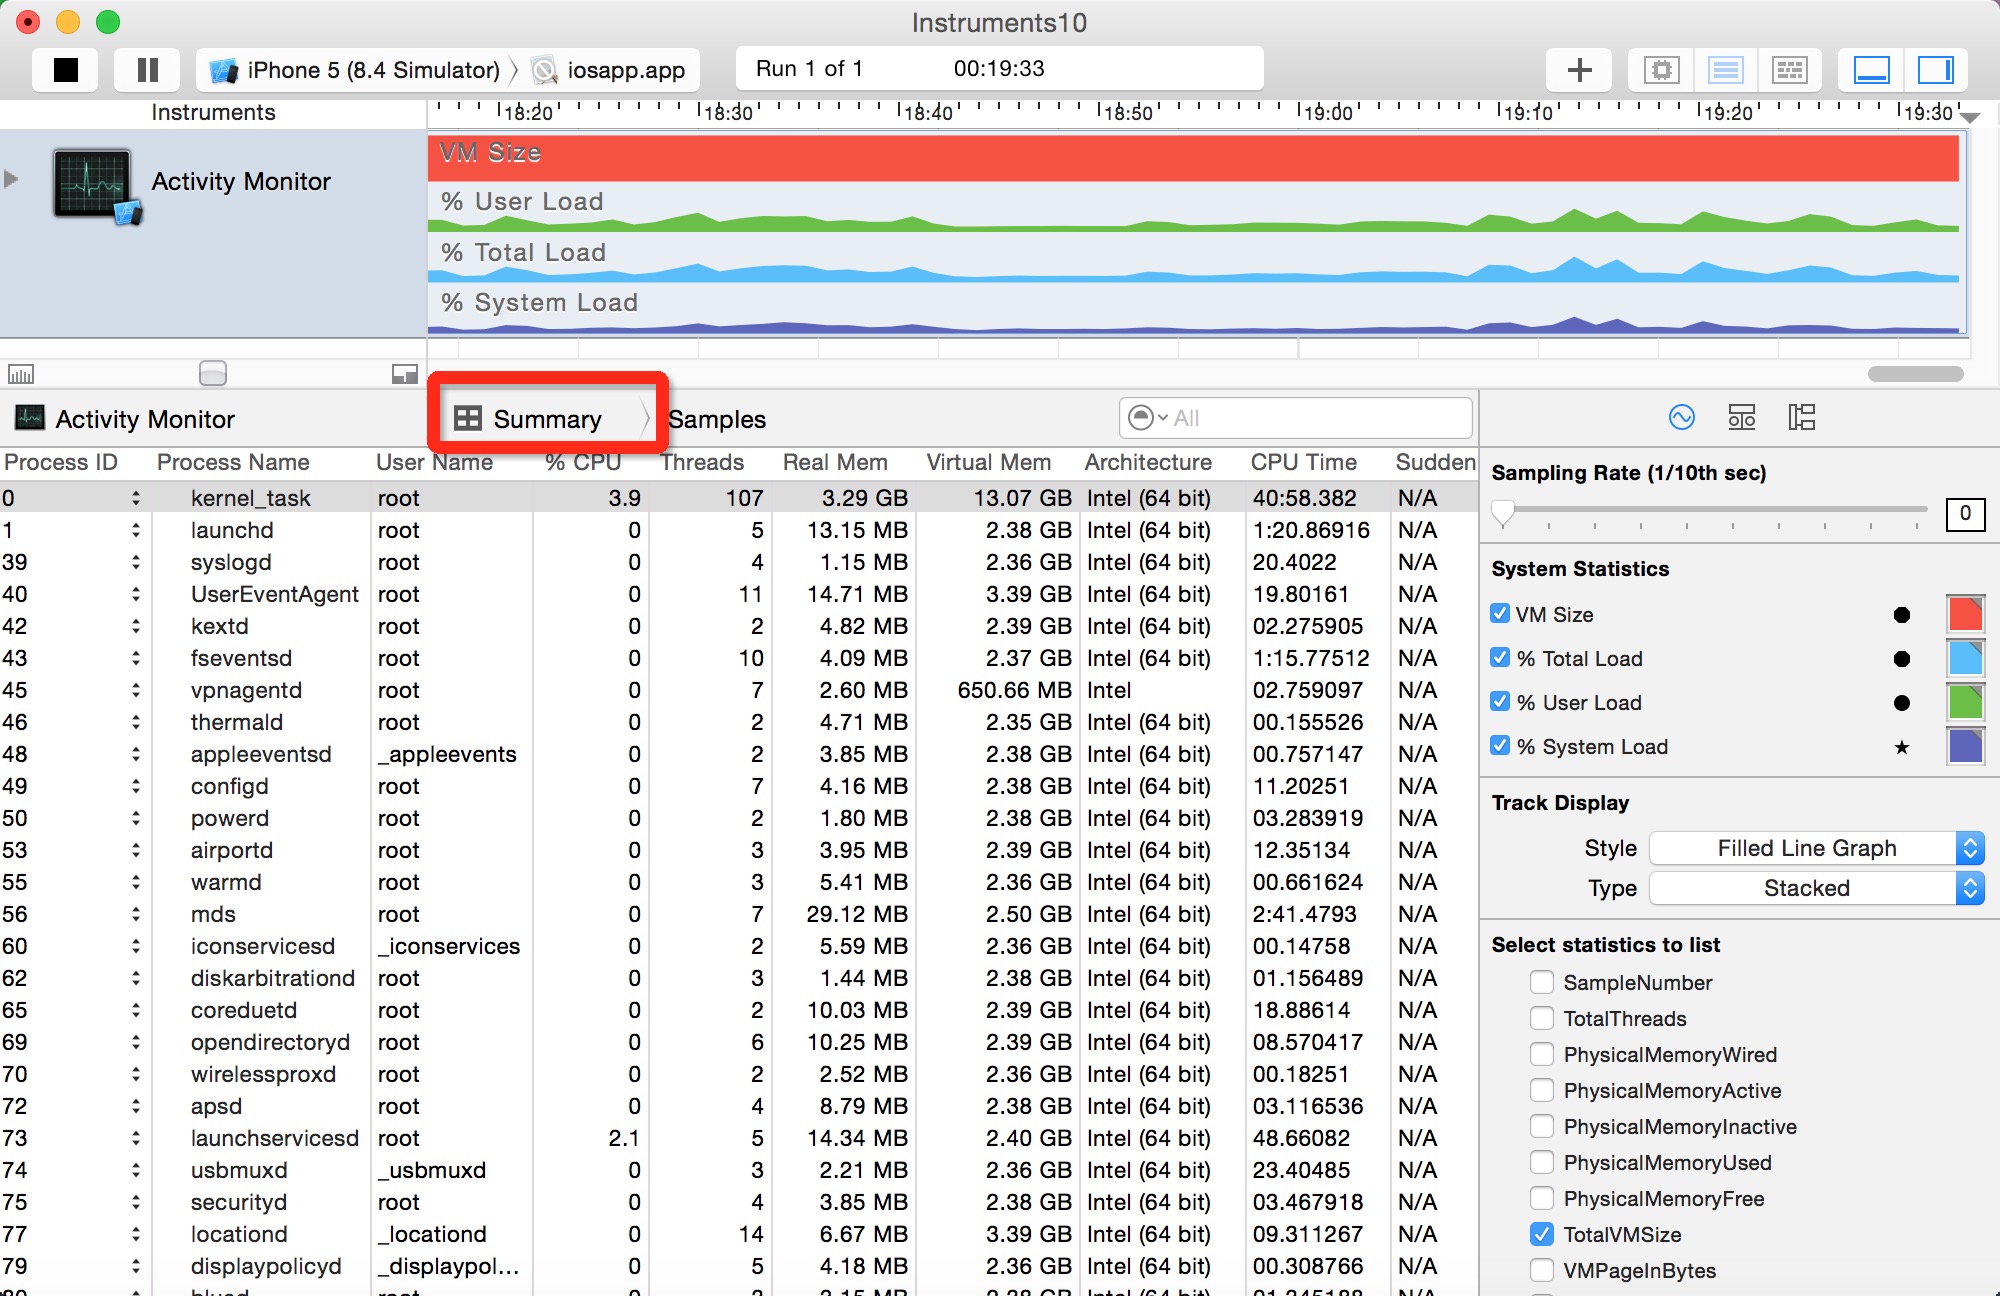
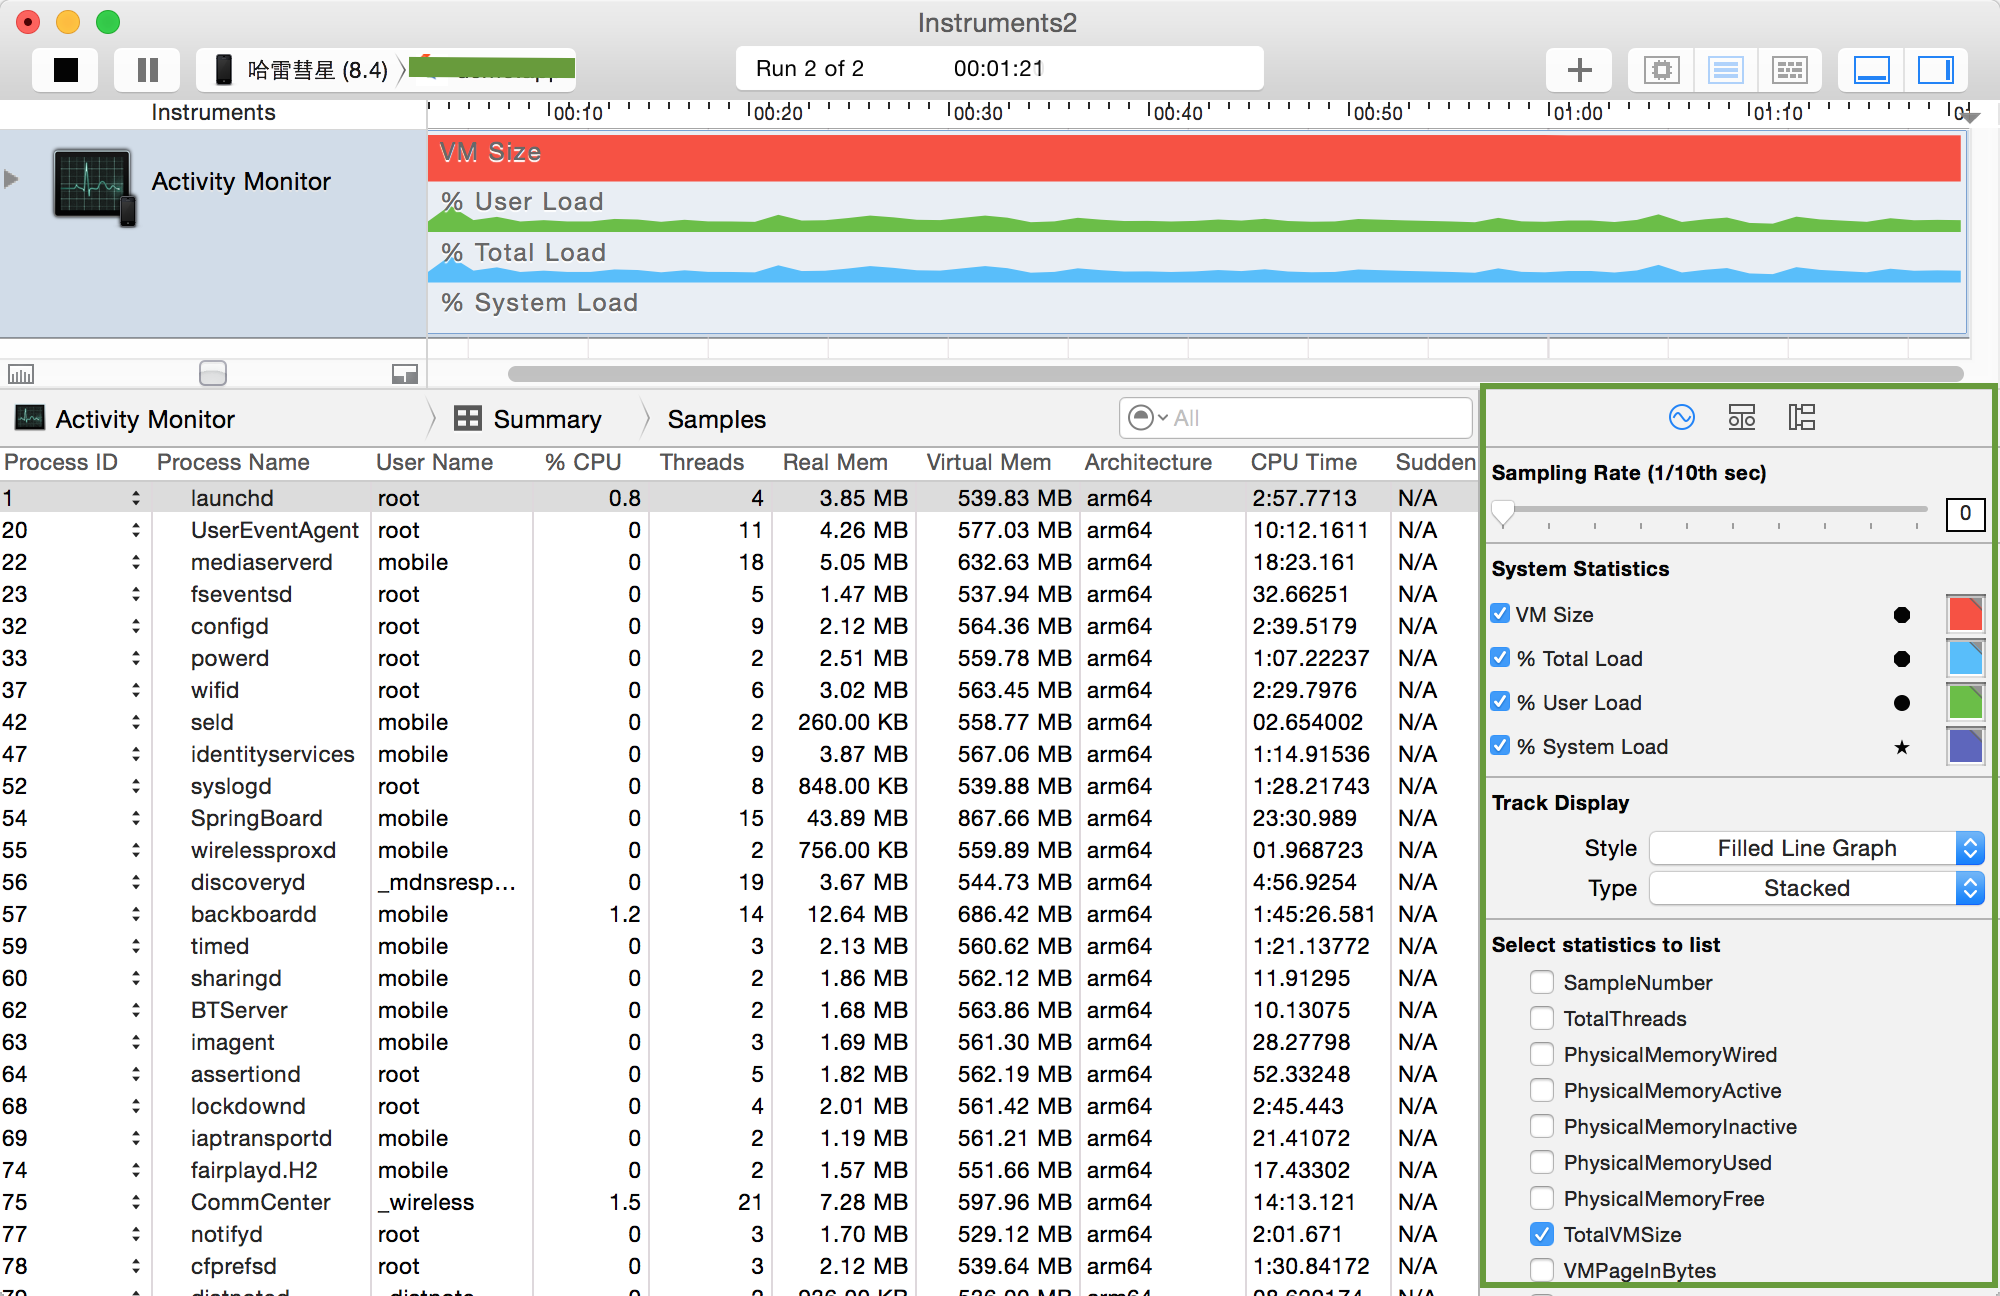
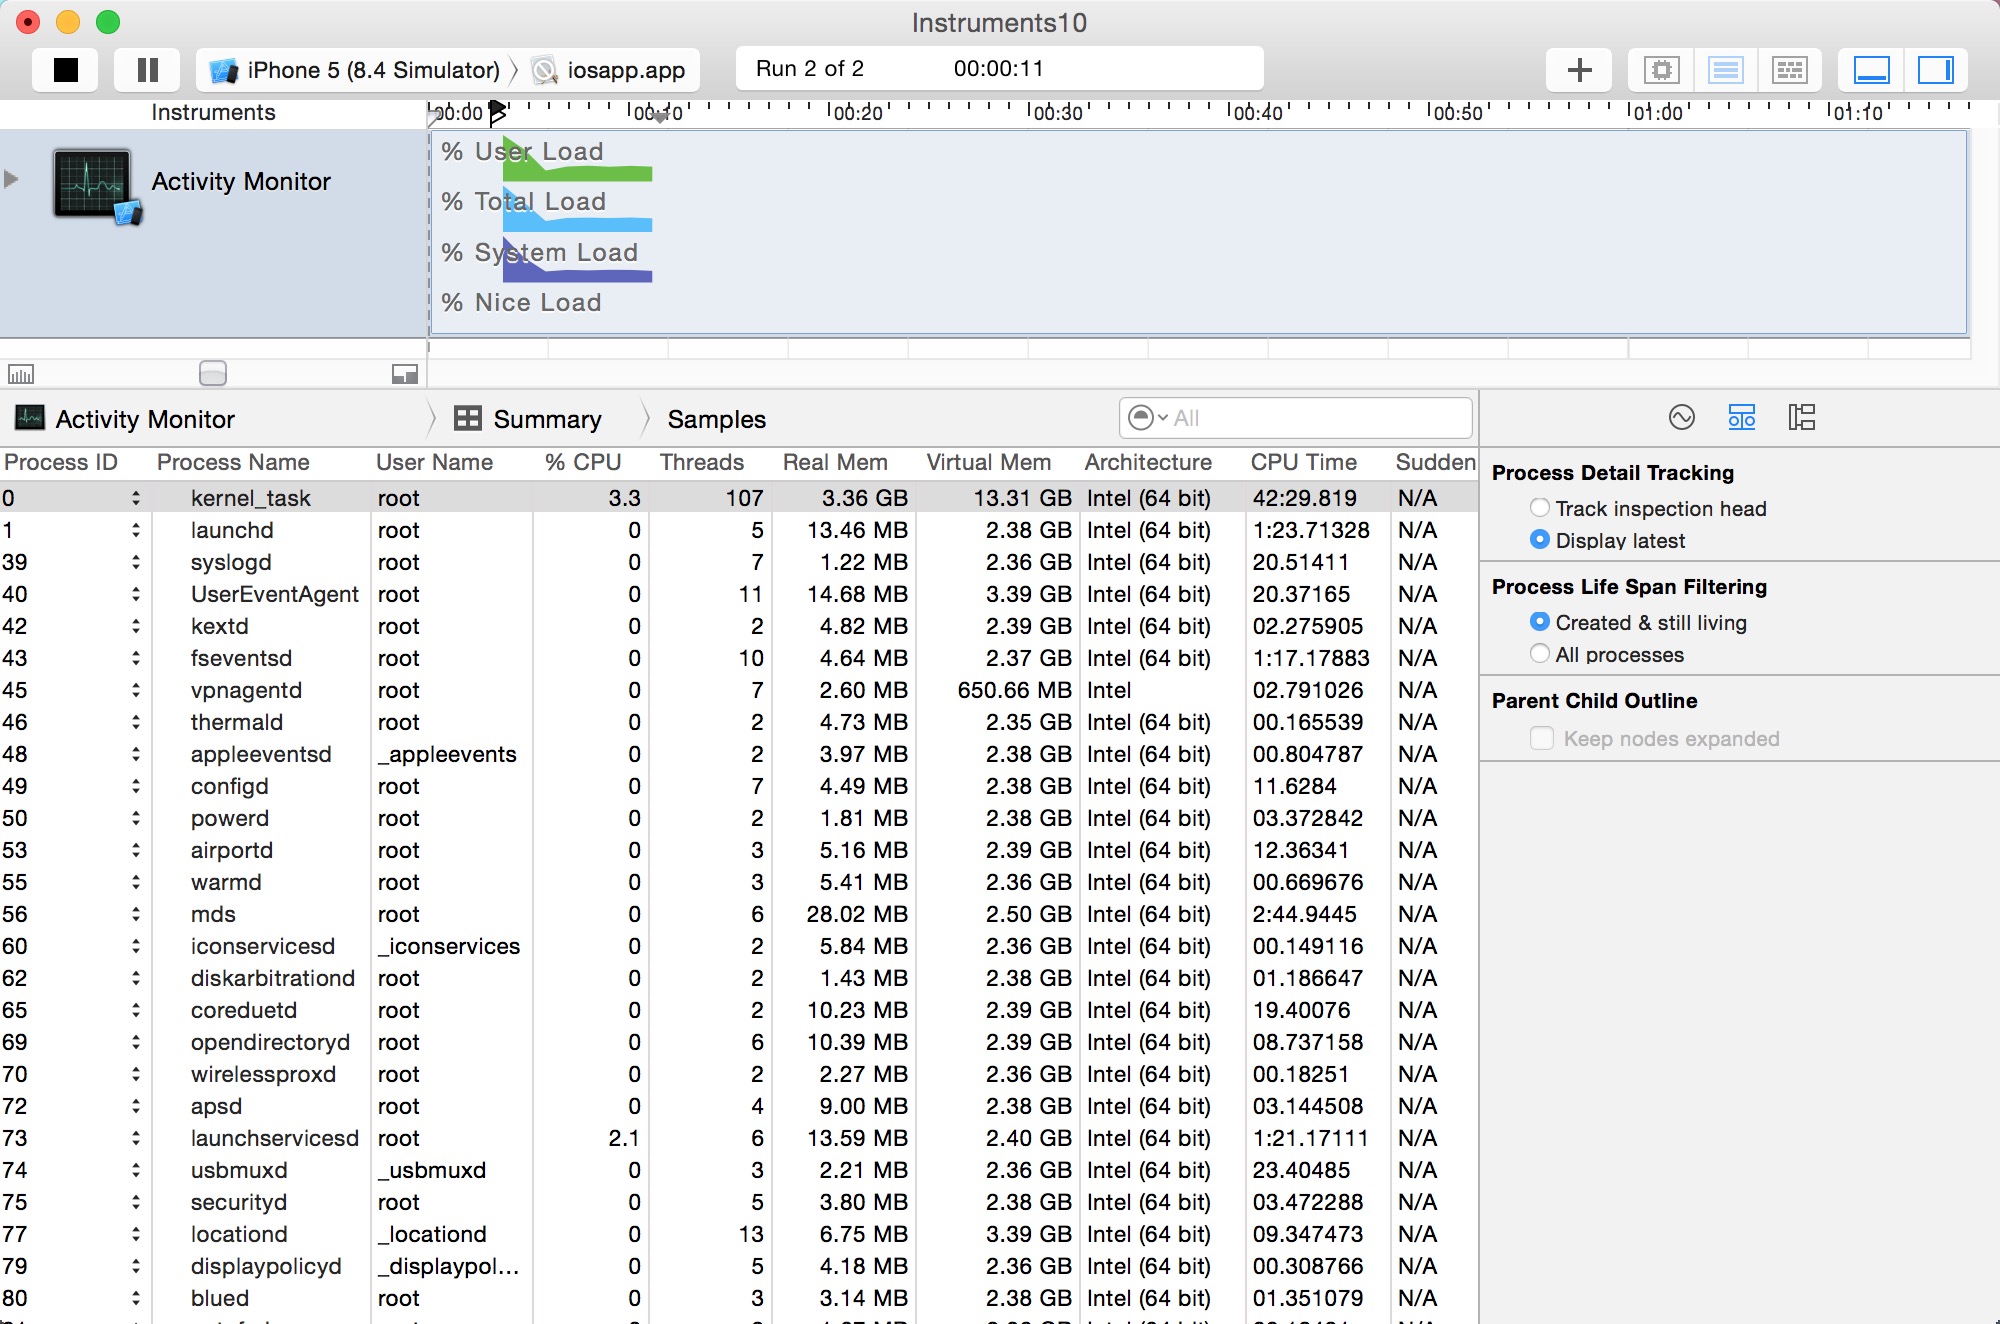
TotalVMSize、CPUTotalLoad、CPUUserLoad、CPUSystemLoad,在使用时可以根据自己的需要选择相关的分析内容进行显示,并且不同的内存使用部分可以使用不同的颜色加以区分,下面就是Activity Monitor在使用过程中的界面截图,在右下角可选择内存相关的分析内容。
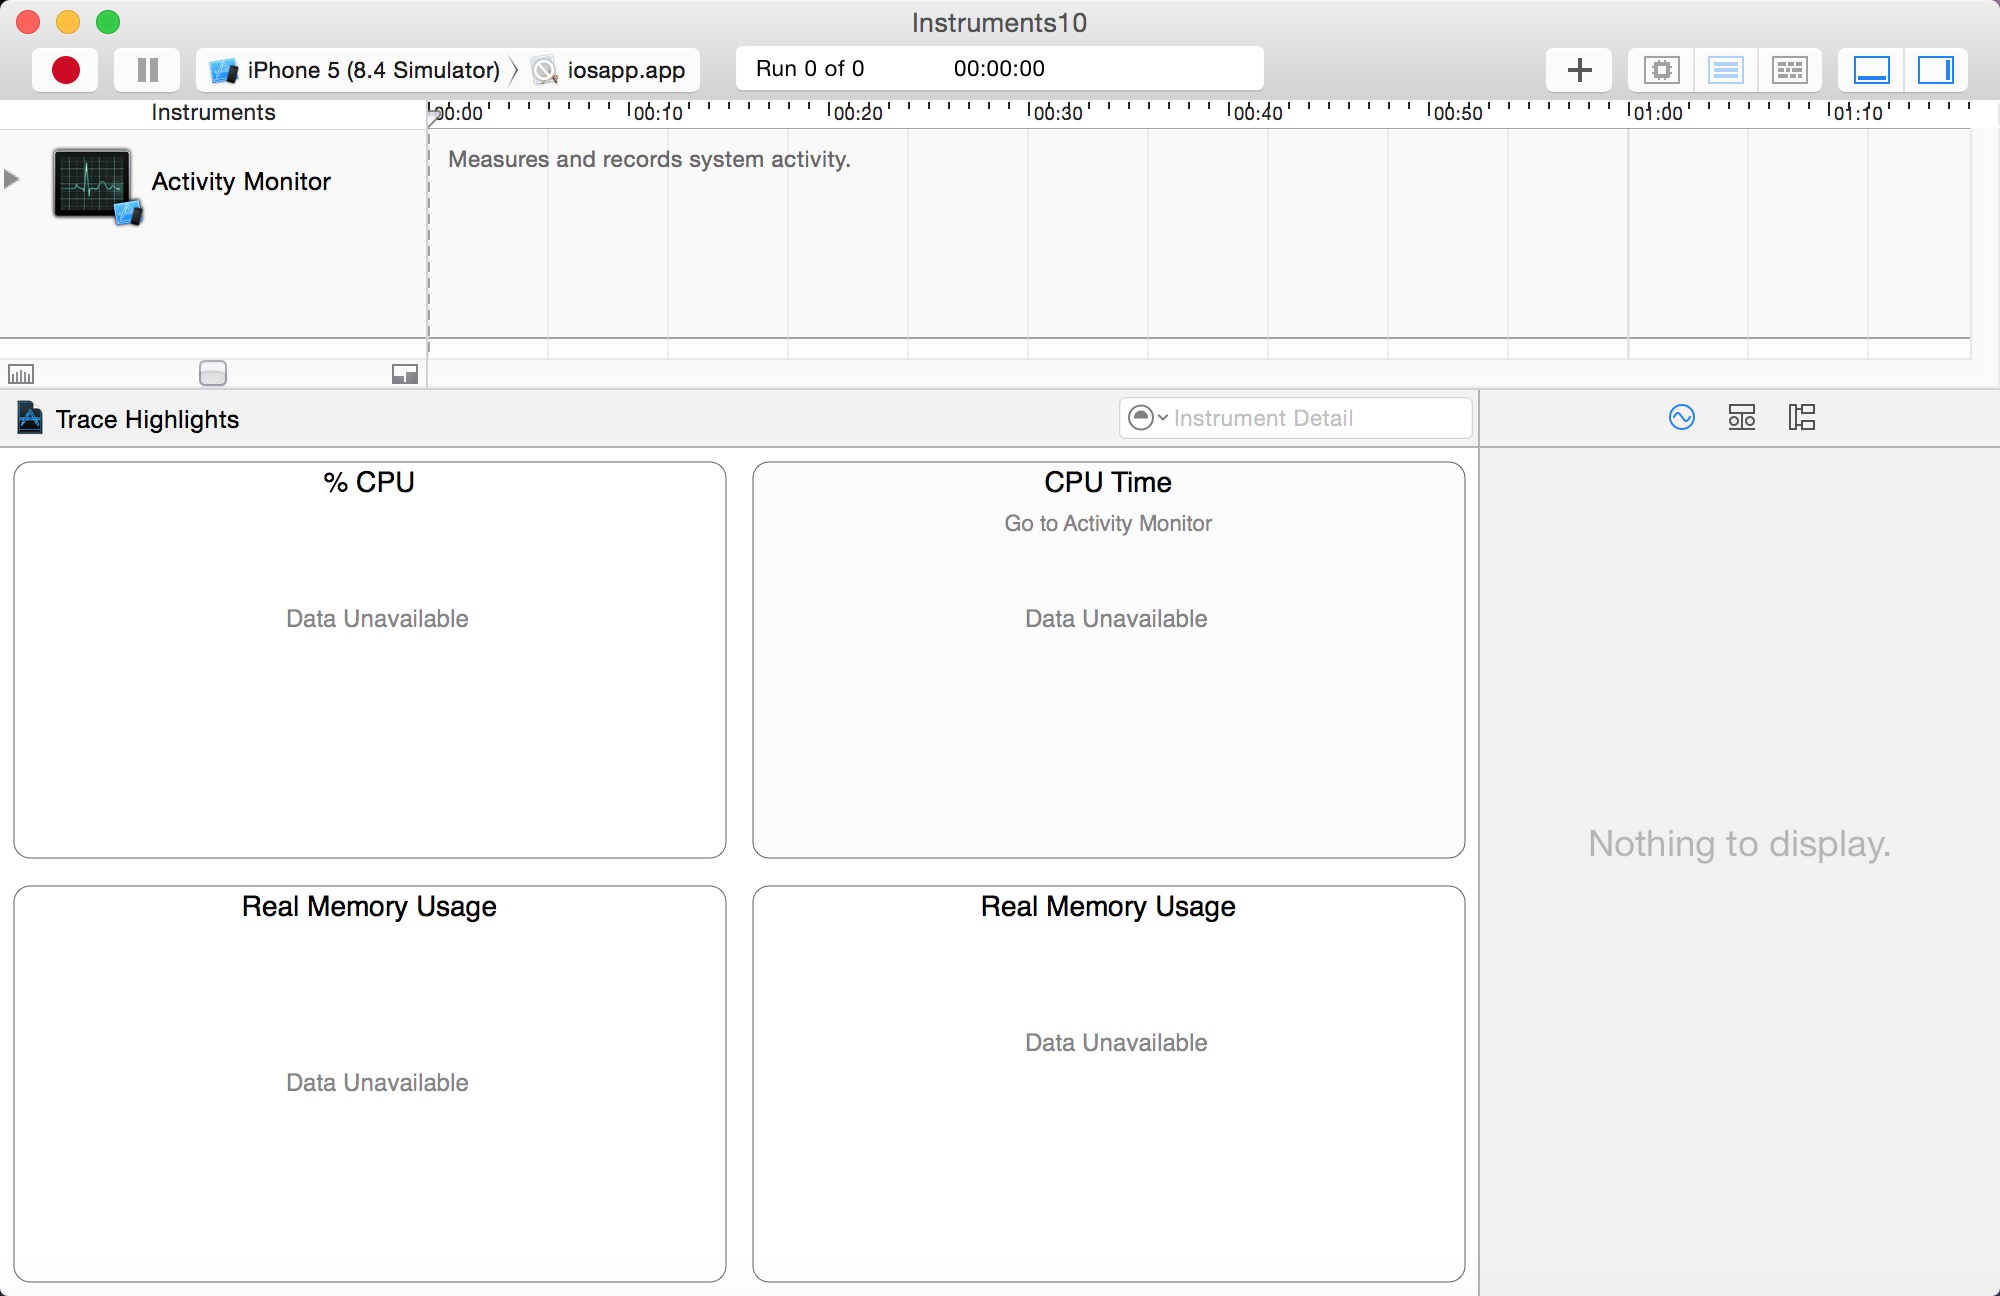
Examining Memory Usage with the Activity Monitor Trace Template
The Activity Monitor trace template monitors overall system activity and statistics, including CPU, memory, disk, and network. It consists of the Activity Monitor instrument only, although you can add additional instruments to a trace document you’ve created with the template, if you desire. You’ll see later that the Activity Monitor is also used to monitor network activity on iOS devices.
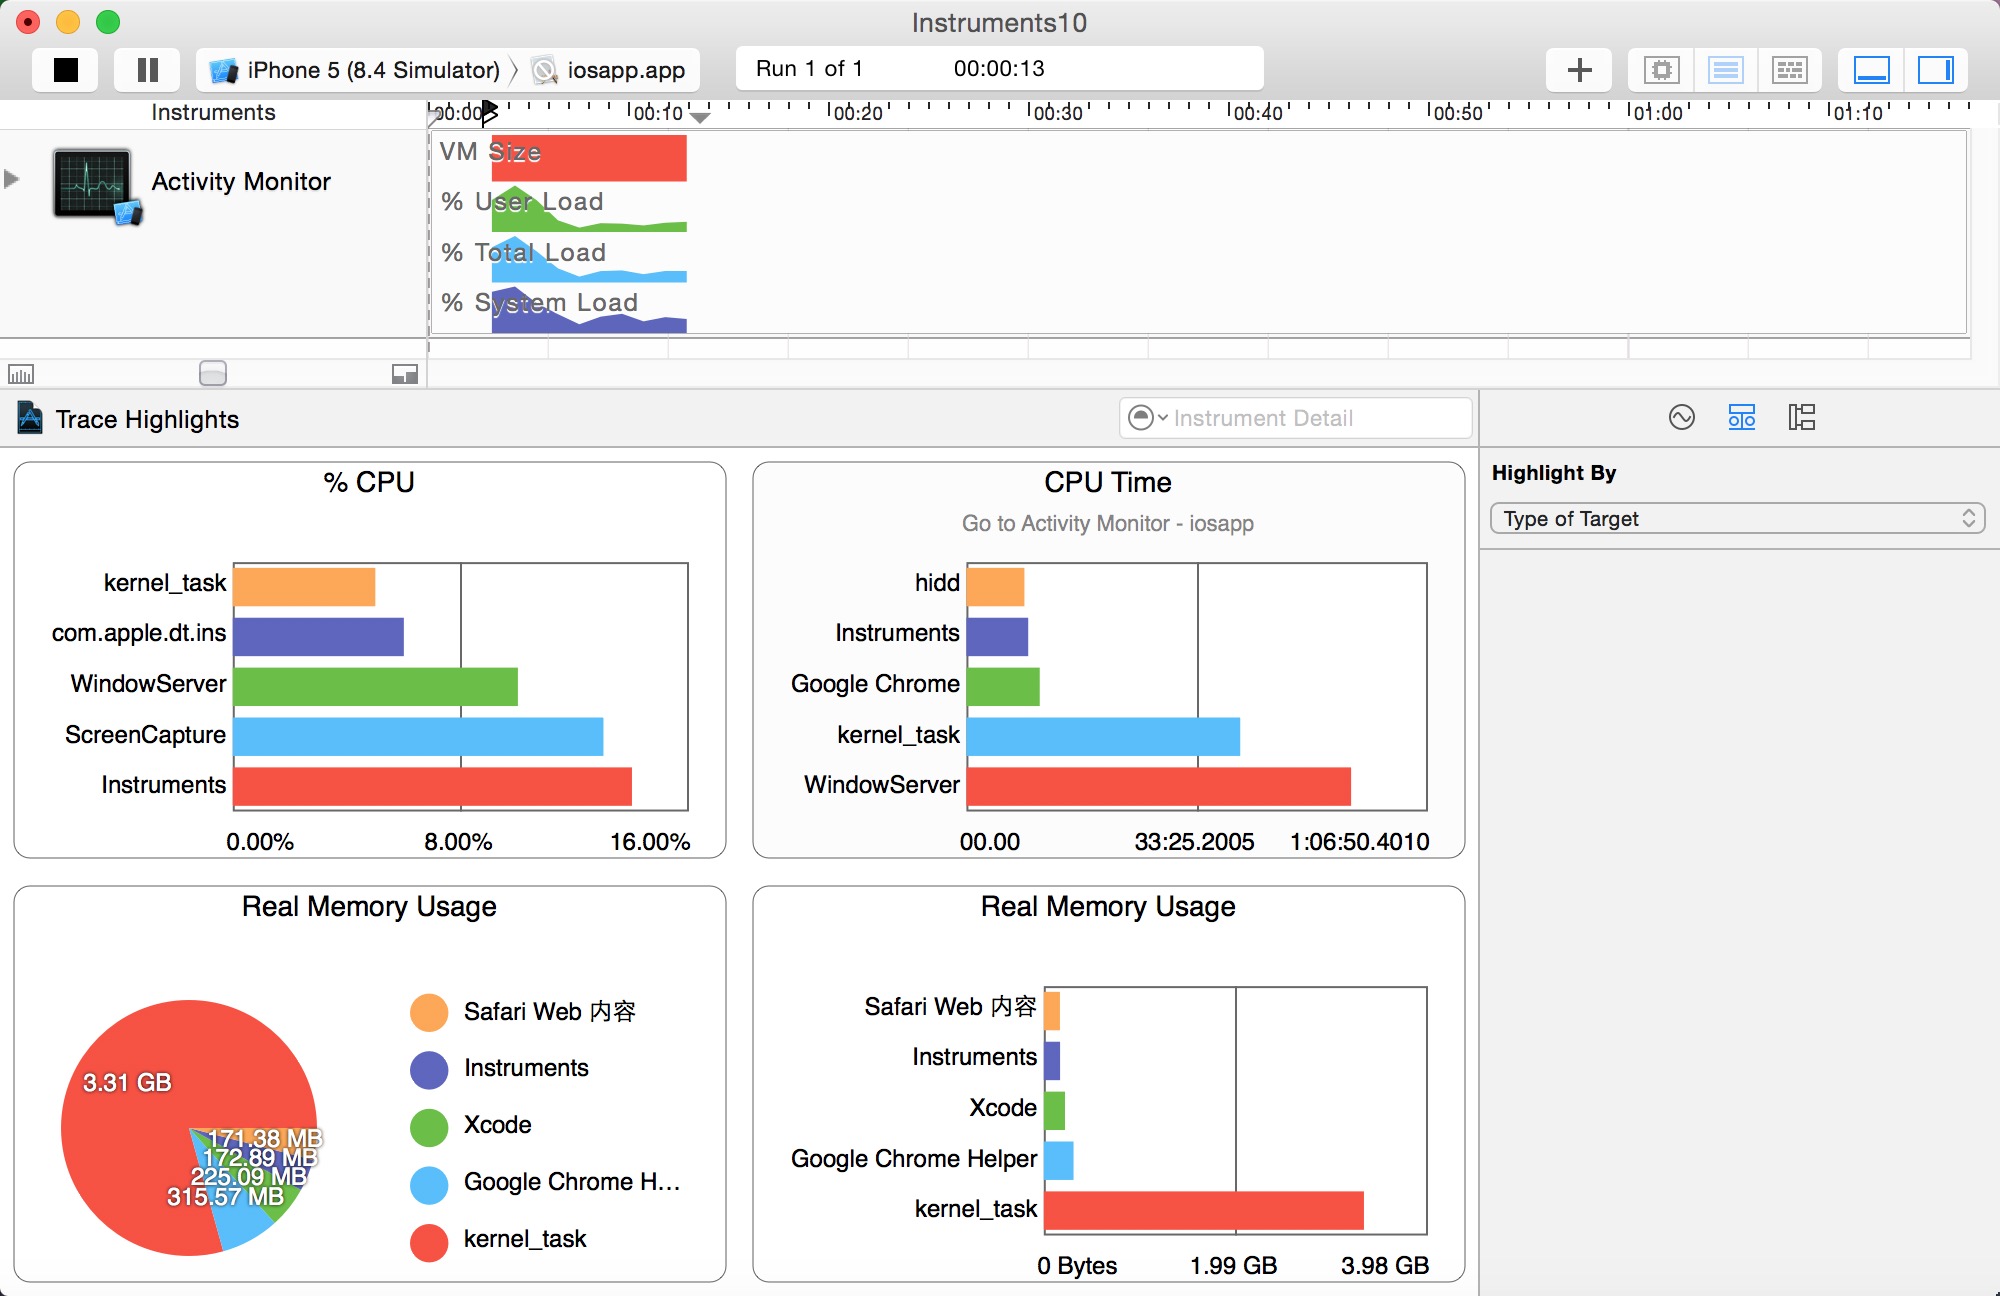
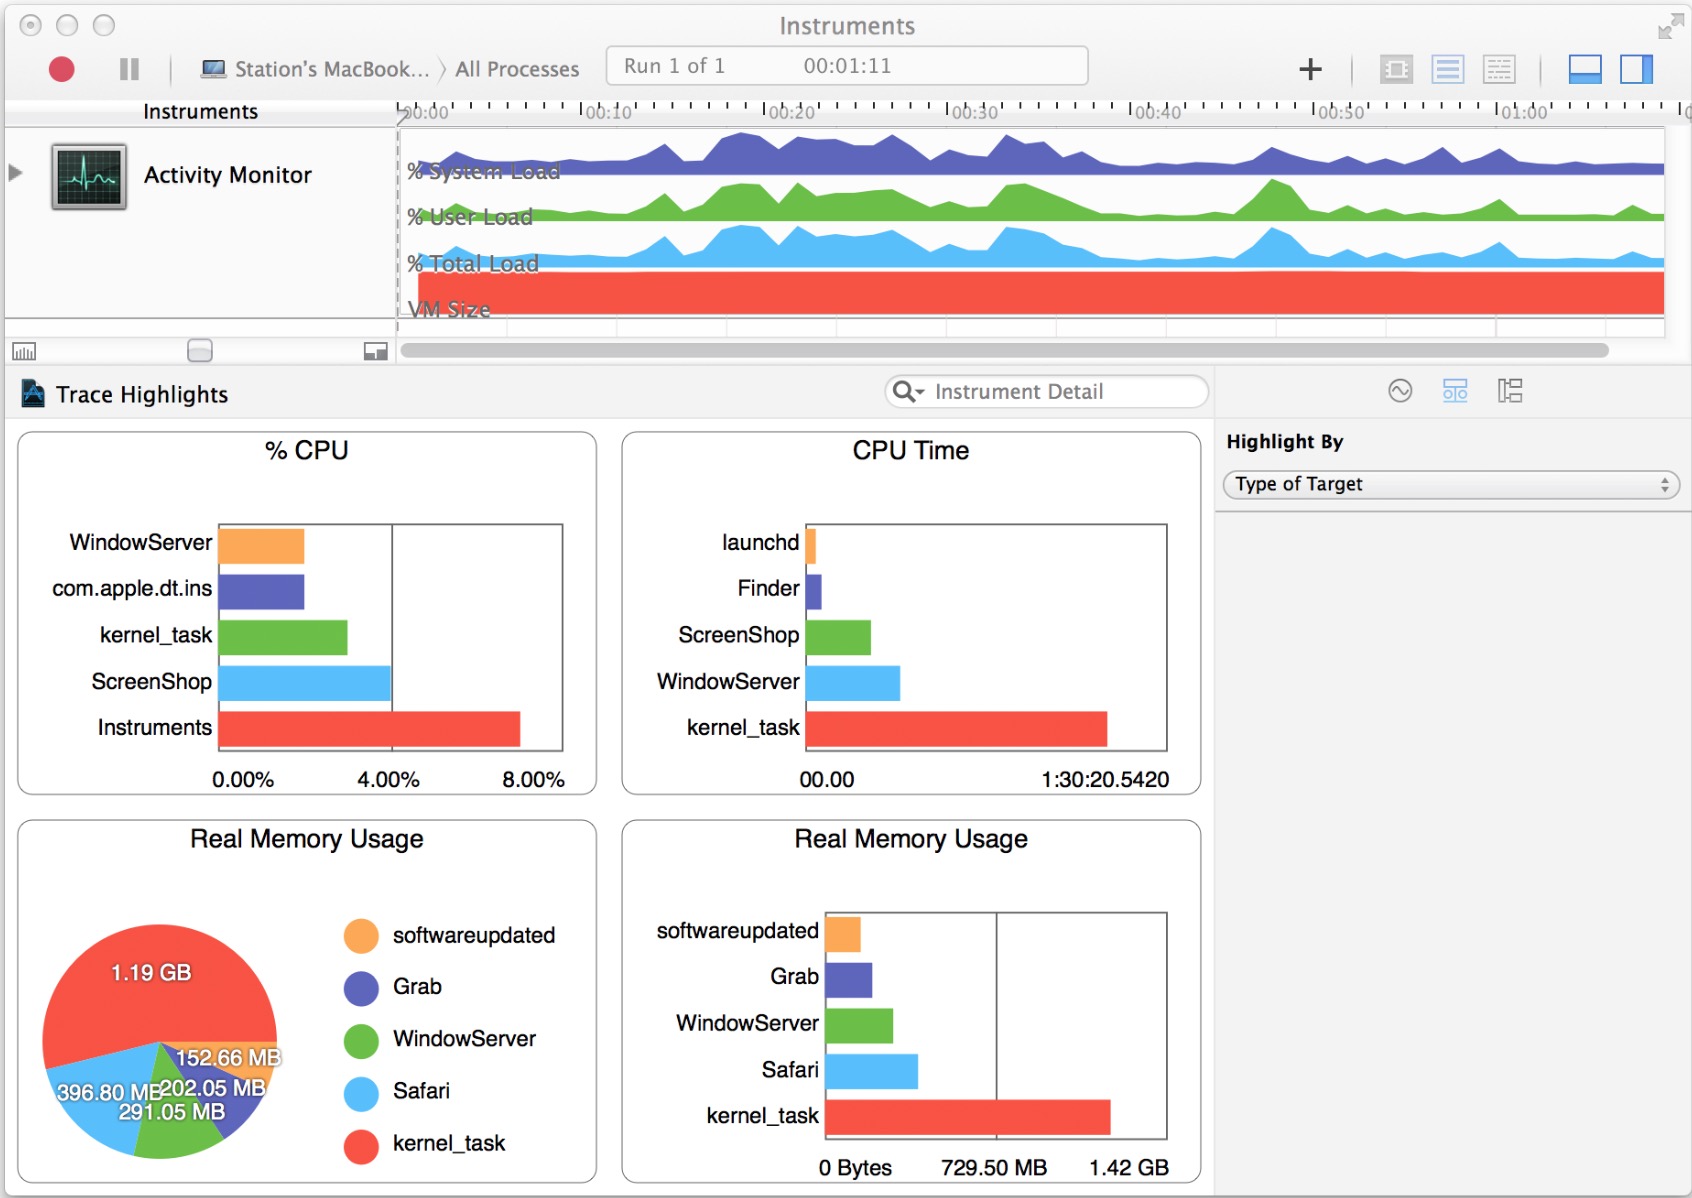
The Activity Monitor instrument captures information about the load on the system measured against the virtual memory size. It can record information from a single process or from all processes running on the system. The Activity Monitor instrument provides you with four convenient charts for a quick, visual representation of the collected information. The two charts that specifically describe memory usage are:
Real Memory Usage (bar graph). Shows the top five real memory users in a bar graph.
Real Memory Usage (pie chart). Shows the top five real memory users with the total memory used displayed.
下图为Activity Monitor instrument with charts
The Record Settings area in the inspector sidebar includes a list of system statistics, which can be configured to appear in the track pane and graphically represent collected data. Select a statistic’s checkbox to see it graphed in the track pane. Click the shape or the color well to change how a statistic appears in the track pane.
There are a number of statistics the Activity Monitor instrument supports, but the following ones are memory-specific:
Physical Memory Wired
Physical Memory Active
Physical Memory Inactive
Physical Memory Used
Physical Memory Free
Total VM Size
VM Page In Bytes
VM Page Out Bytes
VM Swap Used
If one of the statistics above doesn’t appear under System Statistics, locate it under “Select statistics to list” and click its checkbox to include it in the list.
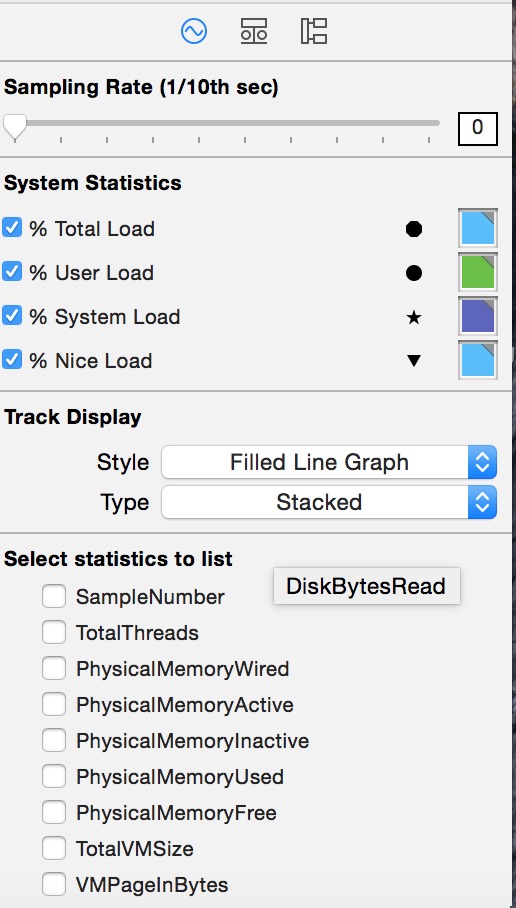
CPUTtotalLoad
CPUUserLoad
CPUSystemLoad
CPUNiceLoad
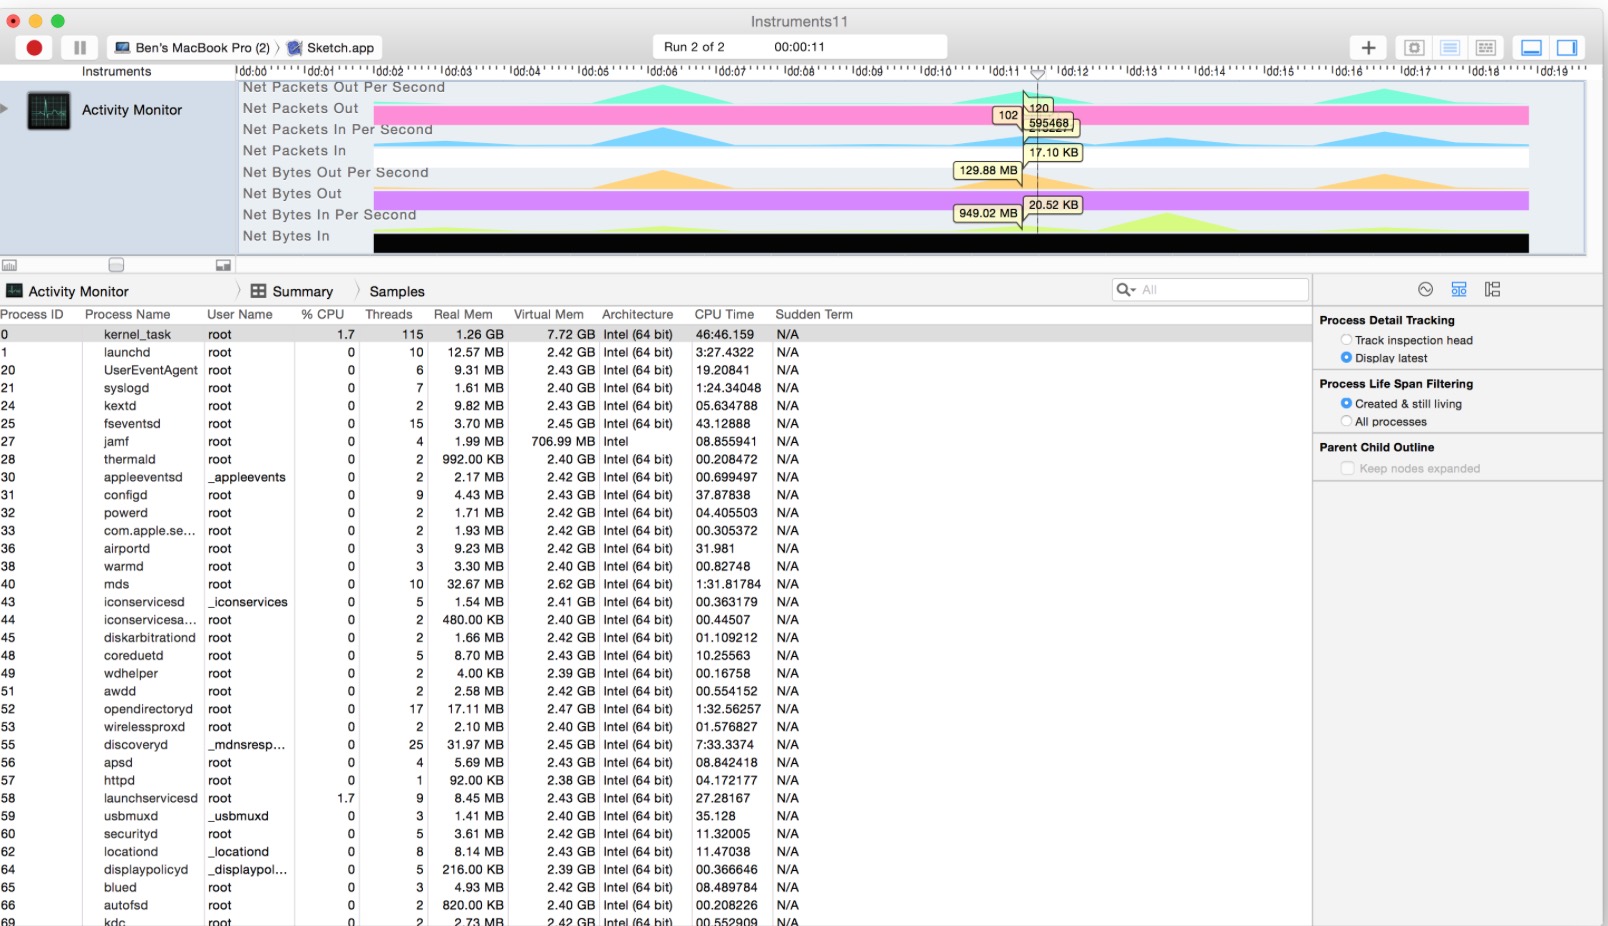
By default, the Activity Monitor template isn’t set up to display network activity. Therefore, you need to enable the desired network-related statistics in the Record Settings area in the inspector sidebar for the Activity Monitor instrument to see which processes are sending and receiving information.
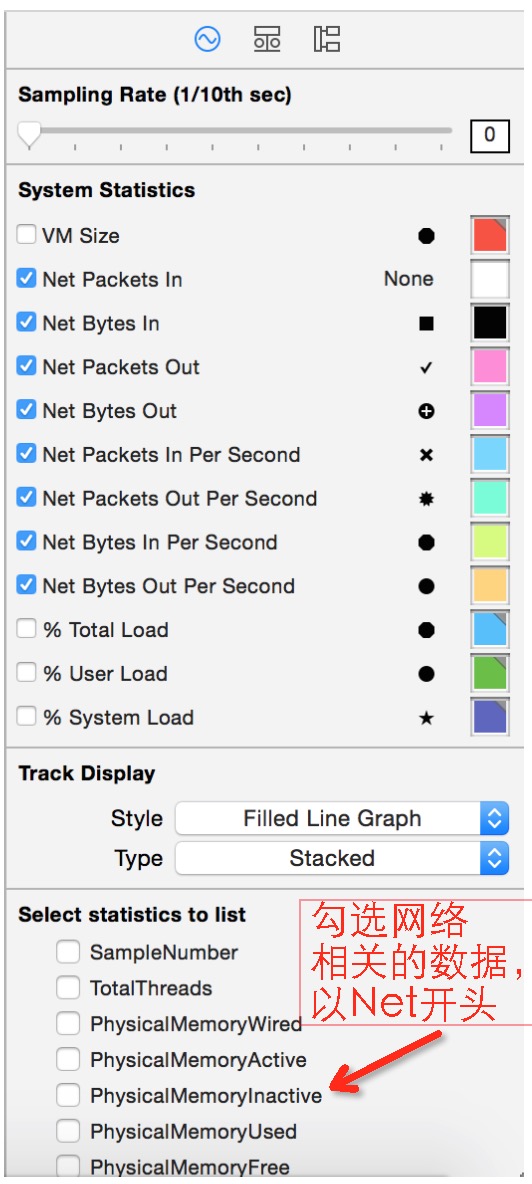
There are a number of statistics the Activity Monitor instrument supports, but the following ones are network-specific:
Net Packets In
Net Bytes In
Net Packets Out
Net Bytes Out
Net Packets In Per Second
Net Packets Out Per Second
Net Bytes In Per Second
Net Bytes Out Per Second
If one of the statistics above doesn’t appear under System Statistics in the Record Settings inspector, locate it under “Select statistics to list” and click its checkbox to include it in the list.
Once you have gathered network activity for your app, examine it carefully to pinpoint areas where your app is sending out excessive amounts of information and therefore tying up valuable device resources. When you minimize the amount of information sent and received, you can benefit from increased performance and response times in your app.
下图为Activity Monitor instrument tracing network packets
Instruments之Activity Monitor使用入门的更多相关文章
- Instruments_Activity Monitor使用入门
Activity Monitor,官方解释为:(活动监视器)即实时显示CPU.内存和网络的使用情况,记录由虚拟内存大小测量的系统负载.用一句大白话来说,Activity Monitor类似Window ...
- [转]Performance Analysis Using SQL Server 2008 Activity Monitor Tool
本文转自:https://www.mssqltips.com/sqlservertip/1917/performance-analysis-using-sql-server-2008-activity ...
- Activity Monitor 闪退 & 无法进入睡眠
情况描述 黑苹果主机突然无法进入睡眠. 考虑到可能是后台程序阻碍了系统正常进入睡眠, 于是想要通过Activity Monitor查看系统的活动情况,然而,Activity Monitor闪退. 重 ...
- Activity工作流(2)-入门安装运行第一个例子
转: Activity工作流(2)-入门安装运行第一个例子 置顶 2017年05月24日 15:58:50 li_ch_ch 阅读数:24432 版权声明:本文为博主原创文章,未经博主允许不得转载 ...
- Activity工作流框架入门(二)API使用DEMO
工作流API使用Demo package activity.demo.test; import java.io.File; import java.io.FileInputStream; import ...
- 增加Activity Monitor中的作业保存数量
在Master Server的注册表中加入如下两个键值即可: (1500的单位是小时)
- 移动app性能测试(待完善)
移动终端性能测试是测试手机终端是否符合特定性能指标的测试,包括有:内存.CPU.电量.流量.流畅度.时延等 测试准备:测试账号.测试需求.测试用例.待测手机.待测应用包.测试工具.测试电脑 1. 时 ...
- Instruments 使用指南
Instruments 用户指南 http://cdn.cocimg.com/bbs/attachment/Fid_6/6_24457_90eabb4ed5b3863.pdf 原著:Apple Inc ...
- Instruments模板介绍(更新中...)
第一章.Instruments(仪器)快速入门 Instruments可以用来收集关于一个或者多个系统进程的性能和行为的数据,并跟踪睡着时间产生的数据.它提供了好几个分析模板: Blank 任何类型都 ...
随机推荐
- Atitit 医学之道 attilax总结
Atitit 医学之道 attilax总结 1. 相关的学科3 1.1. 口腔医学 ok3 1.2. 人体解剖学 ok3 1.3. 生理学 ok3 1.4. 病理学 ok3 1.5. 骨伤科学 ...
- 【Linux】深入理解Linux中内存管理
主题:Linux内存管理中的分段和分页技术 回顾一下历史,在早期的计算机中,程序是直接运行在物理内存上的.换句话说,就是程序在运行的过程中访问的都是物理地址. 如果这个系统只运行一个程序,那么只要这个 ...
- jupyter修改根目录
找到jupyter的快捷方式,然后修改目标: 首先在快捷方式上右键单击,选择属性: 然后将目标那里替换自己想要的目录: 网上有的教程说保留%USERPROFILE%,其实这是受系统对路径解析的影响的. ...
- 【30集iCore3_ADP出厂源代码(ARM部分)讲解视频】30-10底层驱动之I2C
视频简介:该视频介绍iCore3应用开发平台中I2C通信的实现方法. 源视频包下载地址:链接:http://pan.baidu.com/s/1dF5Ssbn 密码:czw8 银杏科技优酷视频发布区:h ...
- java获取视频的第一帧
//------------maven配置文件--------------- <dependency> <groupId>org.bytedeco</groupId> ...
- Threads vs. Tasks
Posted on Friday, October 11, 2013 .Net has three low-level mechanisms to run code in parallel: Thre ...
- Provided id of the wrong type for class pojo.Books. Expected: class java.lang.Integer, got class java.lang.Long
log4j:WARN No appenders could be found for logger (org.hibernate.cfg.Environment). log4j:WARN Please ...
- websphere 删除文件
META-INF 文件夹下加入ibm-partialapp-delete.props即可 里面添加路径 如WEB-INF/xxx/xxx.xxx
- [AWS] OAuth2.0
Ref: 理解OAuth 2.0 若干专有名词: (1)Third-party application:第三方应用程序,本文中又称"客户端"(client),即上一节例子中的&qu ...
- ios开发之--NSString中substringFromIndex,substringWithRange,substringToIndex方法的使用
1,substringFromIndex 从索引0开发到到index的后面的字符 2,substringWithRange 取指定range里面的字符,左边为索引index,右边为截取的范围 3,su ...