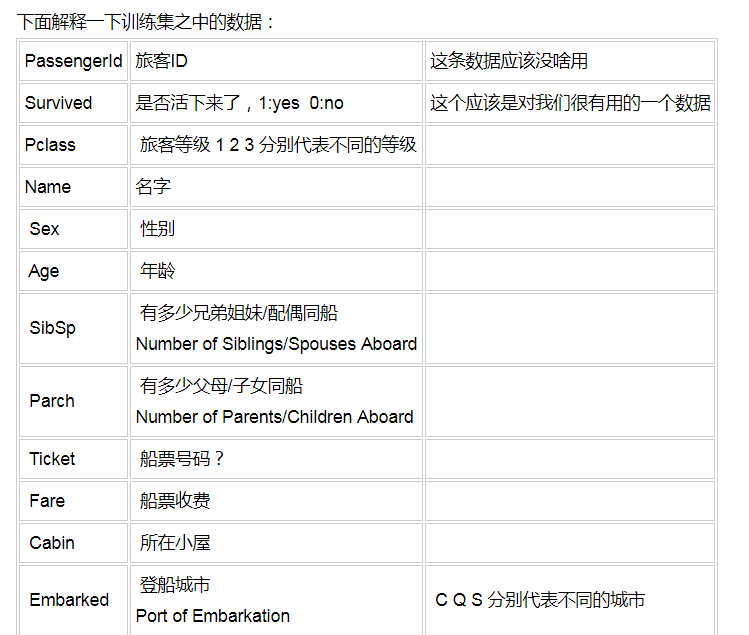
sklearn机器学习-泰坦尼克号
sklearn实战-乳腺癌细胞数据挖掘(博主亲自录制视频)
https://study.163.com/course/introduction.htm?courseId=1005269003&utm_campaign=commission&utm_source=cp-400000000398149&utm_medium=share

randomForest.py
调参后,预测最高准确性也达到了89%
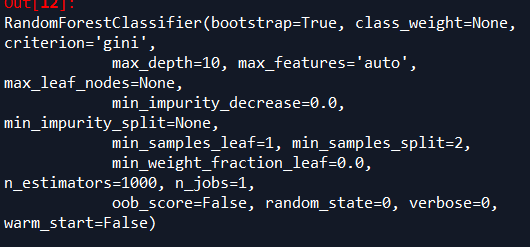
随机森林的参数
# -*- coding: utf-8 -*-

"""

Created on Sat Mar 31 09:30:24 2018

@author: Administrator

随机森林不需要预处理数据

"""

#导入数据预处理,包括标准化处理或正则处理

from sklearn import preprocessing

from sklearn.preprocessing import Imputer

from sklearn import metrics

import numpy as np

import matplotlib.pyplot as plt

from sklearn.ensemble import RandomForestClassifier

from sklearn.model_selection import train_test_split

import pandas as pd

#中文字体设置

from matplotlib.font_manager import FontProperties

font=FontProperties(fname=r"c:\windows\fonts\simsun.ttc",size=14)

#读取变量名文件

varibleFileName="titantic.xlsx"

#读取目标文件

targetFileName="target.xlsx"

#读取excel

data=pd.read_excel(varibleFileName)

data_dummies=pd.get_dummies(data)

print('features after one-hot encoding:\n',list(data_dummies.columns))

features=data_dummies.ix[:,"Pclass":'Embarked_S']

x=features.values

#数据预处理

imp = Imputer(missing_values='NaN', strategy='most_frequent', axis=0)

imp.fit(x)

x=imp.transform(x)

target=pd.read_excel(targetFileName)

y=target.values

x_train,x_test,y_train,y_test=train_test_split(x,y,random_state=0)

names=features.columns

trees=1000

max_depth=10

#n_estimators表示树的个数,测试中100颗树足够

forest=RandomForestClassifier(n_estimators=trees,random_state=0,max_depth=max_depth)

forest.fit(x_train,y_train)

print("random forest with %d trees:"%trees)

print("accuracy on the training subset:{:.3f}".format(forest.score(x_train,y_train)))

print("accuracy on the test subset:{:.3f}".format(forest.score(x_test,y_test)))

#print('Feature importances:{}'.format(forest.feature_importances_))

names=features.columns

importance=forest.feature_importances_

zipped = zip(importance,names)

list1=list(zipped)

list1.sort(reverse=True)

#print(list1)

n_features=data_dummies.shape[1]

plt.barh(range(n_features),forest.feature_importances_,align='center')

plt.yticks(np.arange(n_features),features)

plt.title("random forest with %d trees,%dmax_depth:"%(trees,max_depth))

plt.xlabel('Feature Importance')

plt.ylabel('Feature')

plt.show()

'''

random forest with 1000 trees:

accuracy on the training subset:0.983

accuracy on the test subset:0.878

random forest with 1000 trees,max_depth=4:

accuracy on the training subset:0.854

accuracy on the test subset:0.884

random forest with 1000 trees,max_depth=5:

accuracy on the training subset:0.853

accuracy on the test subset:0.887

random forest with 1000 trees,max_depth=9

accuracy on the training subset:0.871

accuracy on the test subset:0.890

'''
去掉覆盖率低的变量后,随机森林准确性反而下降,看了随机森林不需要去计算变量覆盖率
训练数据准确性0.983
测试数据准确性0.878
'''
random forest with 1000 trees:
accuracy on the training subset:0.983
accuracy on the test subset:0.878
'''
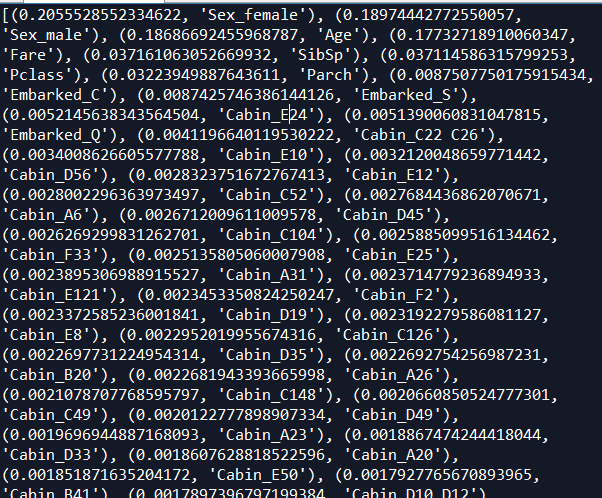
重要因子来看,性别第一,占据40%重要性,
年龄重要性18%左右,
票价重要性17%左右
logistic.py
# -*- coding: utf-8 -*-

"""

Created on Sun Apr 29 22:39:35 2018

@author: Administrator

"""

# -*- coding: utf-8 -*-

"""

Created on Sat Mar 31 09:30:24 2018

@author: Administrator

随机森林不需要预处理数据

"""

from sklearn.linear_model import LogisticRegression

#导入数据预处理,包括标准化处理或正则处理

from sklearn import preprocessing

from sklearn.preprocessing import Imputer

from sklearn import metrics

import numpy as np

import matplotlib.pyplot as plt

from sklearn.model_selection import train_test_split

import pandas as pd

#中文字体设置

from matplotlib.font_manager import FontProperties

font=FontProperties(fname=r"c:\windows\fonts\simsun.ttc",size=14)

#读取变量名文件

varibleFileName="titantic.xlsx"

#读取目标文件

targetFileName="target.xlsx"

#读取excel

data=pd.read_excel(varibleFileName)

data_dummies=pd.get_dummies(data)

print('features after one-hot encoding:\n',list(data_dummies.columns))

features=data_dummies.ix[:,"Pclass":'Embarked_S']

x=features.values

#数据预处理

imp = Imputer(missing_values='NaN', strategy='most_frequent', axis=0)

imp.fit(x)

x=imp.transform(x)

target=pd.read_excel(targetFileName)

y=target.values

x_train,x_test,y_train,y_test=train_test_split(x,y,random_state=0)

names=features.columns

#n_estimators表示树的个数,测试中100颗树足够

logistic=LogisticRegression()

logistic.fit(x_train,y_train)

print("logistic:")

print("accuracy on the training subset:{:.3f}".format(logistic.score(x_train,y_train)))

print("accuracy on the test subset:{:.3f}".format(logistic.score(x_test,y_test)))

'''

logistic:

accuracy on the training subset:0.850

accuracy on the test subset:0.875

'''
目前效果最好的是去掉低覆盖率的变量后,SVM准确率最高0.89
# -*- coding: utf-8 -*-

"""

Created on Sat Mar 31 09:30:24 2018

@author: Administrator

随机森林不需要预处理数据

"""

from sklearn.svm import SVC

#导入数据预处理,包括标准化处理或正则处理

from sklearn import preprocessing

from sklearn.preprocessing import Imputer

from sklearn import metrics

import numpy as np

import matplotlib.pyplot as plt

from sklearn.model_selection import train_test_split

import pandas as pd

#中文字体设置

from matplotlib.font_manager import FontProperties

font=FontProperties(fname=r"c:\windows\fonts\simsun.ttc",size=14)

#读取变量名文件

varibleFileName="titantic.xlsx"

#读取目标文件

targetFileName="target.xlsx"

#读取excel

data=pd.read_excel(varibleFileName)

data_dummies=pd.get_dummies(data)

print('features after one-hot encoding:\n',list(data_dummies.columns))

features=data_dummies.ix[:,"Pclass":'Embarked_S']

x=features.values

#数据预处理

imp = Imputer(missing_values='NaN', strategy='most_frequent', axis=0)

imp.fit(x)

x=imp.transform(x)

target=pd.read_excel(targetFileName)

y=target.values

x_train,x_test,y_train,y_test=train_test_split(x,y,random_state=0)

names=features.columns

svm=SVC()

svm.fit(x_train,y_train)

print("svc:")

print("accuracy on the training subset:{:.3f}".format(svm.score(x_train,y_train)))

print("accuracy on the test subset:{:.3f}".format(svm.score(x_test,y_test)))

'''

svc:

accuracy on the training subset:0.900

accuracy on the test subset:0.726

'''

#标准化数据

X_train_scaled = preprocessing.scale(x_train)

x_test_scaled = preprocessing.scale(x_test)

svm1=SVC()

svm1.fit(X_train_scaled,y_train)

#改变C参数,调优,kernel表示核函数,用于平面转换,probability表示是否需要计算概率

svm1=SVC()

svm1.fit(X_train_scaled,y_train)

print("accuracy on the scaled training subset:{:.3f}".format(svm1.score(X_train_scaled,y_train)))

print("accuracy on the scaled test subset:{:.3f}".format(svm1.score(x_test_scaled,y_test)))

'''

accuracy on the scaled training subset:0.866

accuracy on the scaled test subset:0.881

'''

#改变C参数,调优,kernel表示核函数,用于平面转换,probability表示是否需要计算概率

svm2=SVC(C=10,gamma="auto",kernel='rbf',probability=True)

svm2.fit(X_train_scaled,y_train)

print("after c parameter=10,accuracy on the scaled training subset:{:.3f}".format(svm2.score(X_train_scaled,y_train)))

print("after c parameter=10,accuracy on the scaled test subset:{:.3f}".format(svm2.score(x_test_scaled,y_test)))

'''

after c parameter=10,accuracy on the scaled training subset:0.878

after c parameter=10,accuracy on the scaled test subset:0.890

'''
xgboost1.py
效果也相当好
AUC: 0.9464

ACC: 0.8841

Recall: 0.8716

F1-score: 0.8716

Precesion: 0.8716
# -*- coding: utf-8 -*-

"""

Created on Sat Mar 31 09:30:24 2018

@author: Administrator

随机森林不需要预处理数据

"""

import xgboost as xgb

#导入数据预处理,包括标准化处理或正则处理

from sklearn import preprocessing

from sklearn.preprocessing import Imputer

from sklearn import metrics

import numpy as np

import matplotlib.pyplot as plt

from sklearn.model_selection import train_test_split

import pandas as pd

#中文字体设置

from matplotlib.font_manager import FontProperties

font=FontProperties(fname=r"c:\windows\fonts\simsun.ttc",size=14)

#读取变量名文件

varibleFileName="titantic.xlsx"

#读取目标文件

targetFileName="target.xlsx"

#读取excel

data=pd.read_excel(varibleFileName)

data_dummies=pd.get_dummies(data)

print('features after one-hot encoding:\n',list(data_dummies.columns))

features=data_dummies.ix[:,"Pclass":'Embarked_S']

x=features.values

#数据预处理

imp = Imputer(missing_values='NaN', strategy='most_frequent', axis=0)

imp.fit(x)

x=imp.transform(x)

target=pd.read_excel(targetFileName)

y=target.values

x_train,x_test,y_train,y_test=train_test_split(x,y,random_state=0)

names=features.columns

dtrain=xgb.DMatrix(x_train,label=y_train)

dtest=xgb.DMatrix(x_test)

params={'booster':'gbtree',

    #'objective': 'reg:linear',

    'objective': 'binary:logistic',

    'eval_metric': 'auc',

    'max_depth':4,

    'lambda':10,

    'subsample':0.75,

    'colsample_bytree':0.75,

    'min_child_weight':2,

    'eta': 0.025,

    'seed':0,

    'nthread':8,

     'silent':1}

watchlist = [(dtrain,'train')]

bst=xgb.train(params,dtrain,num_boost_round=100,evals=watchlist)

ypred=bst.predict(dtest)

# 设置阈值, 输出一些评价指标

y_pred = (ypred >= 0.5)*1

#模型校验

print ('AUC: %.4f' % metrics.roc_auc_score(y_test,ypred))

print ('ACC: %.4f' % metrics.accuracy_score(y_test,y_pred))

print ('Recall: %.4f' % metrics.recall_score(y_test,y_pred))

print ('F1-score: %.4f' %metrics.f1_score(y_test,y_pred))

print ('Precesion: %.4f' %metrics.precision_score(y_test,y_pred))

metrics.confusion_matrix(y_test,y_pred)

print("xgboost:")

print('Feature importances:{}'.format(bst.get_fscore()))

'''

AUC: 0.9464

ACC: 0.8841

Recall: 0.8716

F1-score: 0.8716

Precesion: 0.8716

xgboost:

Feature importances:{'f5': 69, 'f1': 178, 'f2': 68, 'f4': 245, 'f6': 25, 'f0': 88, 'f3': 25, 'f194': 4, 'f193': 21, 'f195': 9}

'''
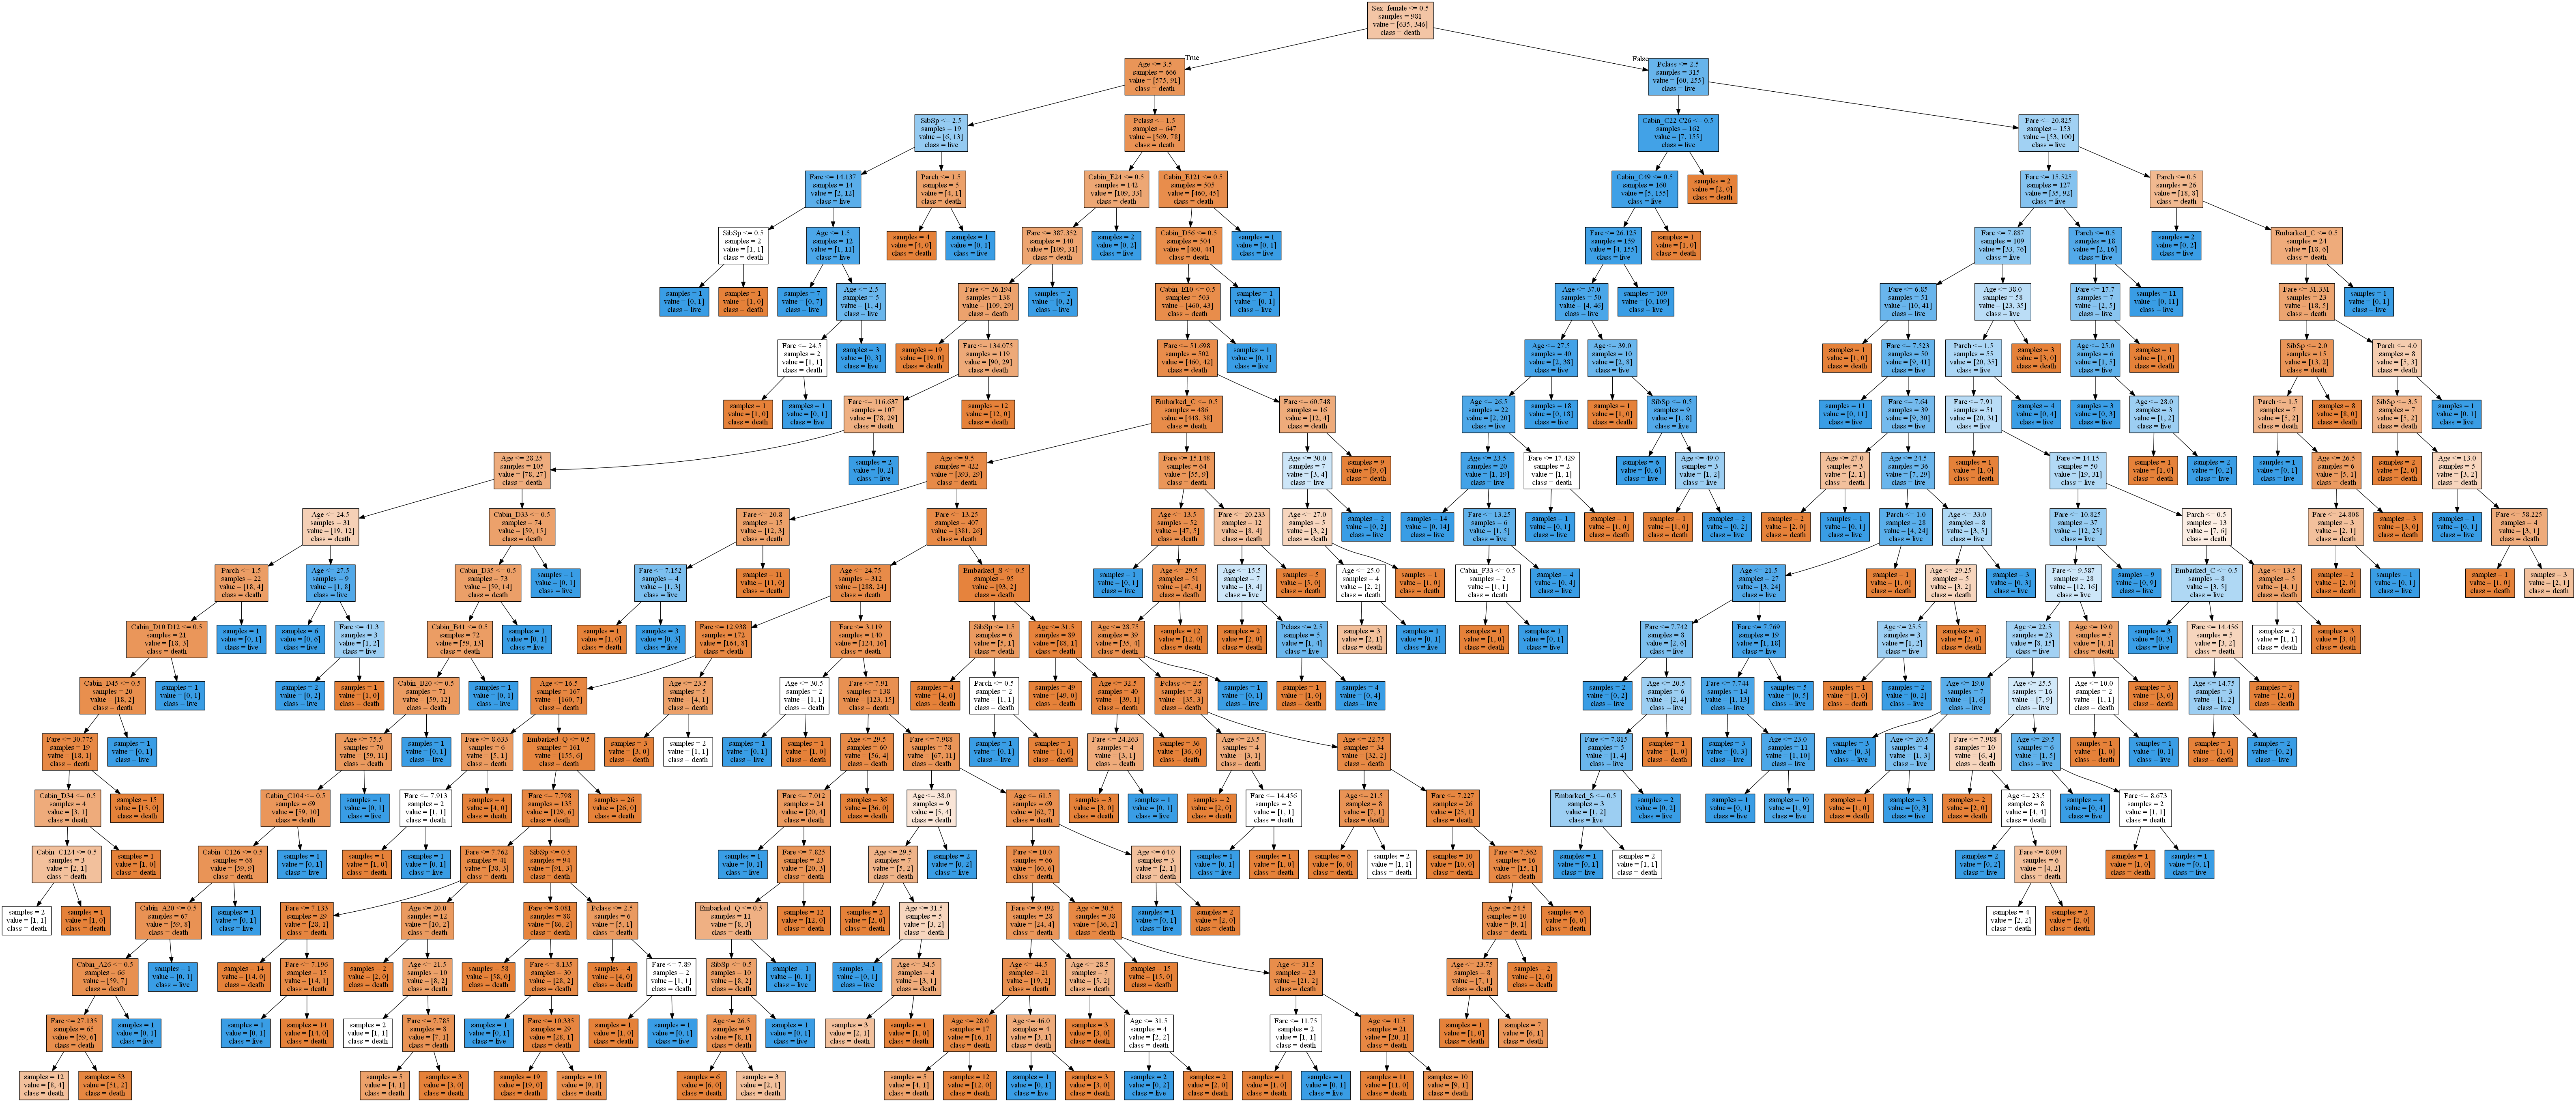
决策树
decisionTree.py
# -*- coding: utf-8 -*-
"""
Created on Mon Apr 30 19:04:10 2018 @author: Administrator
"""
from sklearn.tree import export_graphviz
from sklearn.model_selection import train_test_split
from sklearn.preprocessing import Imputer
import pandas as pd
import numpy as np
from sklearn.tree import DecisionTreeClassifier
import matplotlib.pyplot as plt #读取变量名文件
varibleFileName="titantic.xlsx"
#读取目标文件
targetFileName="target.xlsx"
#读取excel
data=pd.read_excel(varibleFileName)
data_dummies=pd.get_dummies(data)
print('features after one-hot encoding:\n',list(data_dummies.columns))
features=data_dummies.ix[:,"Pclass":'Embarked_S']
x=features.values #数据预处理
imp = Imputer(missing_values='NaN', strategy='most_frequent', axis=0)
imp.fit(x)
x=imp.transform(x) target=pd.read_excel(targetFileName)
y=target.values
X_train,x_test,y_train,y_test=train_test_split(x,y,random_state=0)
#变量名
names=features.columns #调参
list_average_accuracy=[]
depth=range(1,30)
for i in depth:
#max_depth=4限制决策树深度可以降低算法复杂度,获取更精确值
tree= DecisionTreeClassifier(max_depth=i,random_state=0)
tree.fit(X_train,y_train)
accuracy_training=tree.score(X_train,y_train)
accuracy_test=tree.score(x_test,y_test)
average_accuracy=(accuracy_training+accuracy_test)/2.0
#print("average_accuracy:",average_accuracy)
list_average_accuracy.append(average_accuracy) max_value=max(list_average_accuracy)
#索引是0开头,结果要加1
best_depth=list_average_accuracy.index(max_value)+1
print("best_depth:",best_depth) best_tree= DecisionTreeClassifier(max_depth=best_depth,random_state=0)
best_tree.fit(X_train,y_train)
accuracy_training=best_tree.score(X_train,y_train)
accuracy_test=best_tree.score(x_test,y_test) print("decision tree:")
print("accuracy on the training subset:{:.3f}".format(best_tree.score(X_train,y_train)))
print("accuracy on the test subset:{:.3f}".format(best_tree.score(x_test,y_test))) '''
best_depth: 19
decision tree:
accuracy on the training subset:0.976
accuracy on the test subset:0.860
''' #绘图,显示因子重要性
n_features=x.shape[1]
plt.barh(range(n_features),best_tree.feature_importances_,align='center')
plt.yticks(np.arange(n_features),features)
plt.title("Decision Tree:")
plt.xlabel('Feature Importance')
plt.ylabel('Feature')
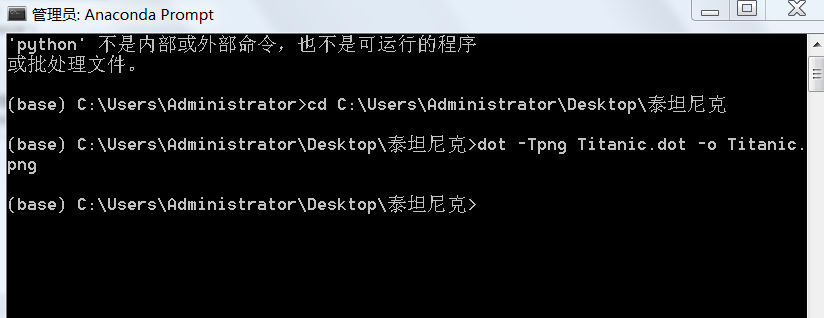
plt.show() #生成一个dot文件,以后用cmd形式生成图片
export_graphviz(best_tree,out_file="Titanic.dot",class_names=['death','live'],feature_names=names,impurity=False,filled=True)
python风控评分卡建模和风控常识
sklearn机器学习-泰坦尼克号的更多相关文章
- Python 3 利用 Dlib 19.7 和 sklearn机器学习模型 实现人脸微笑检测
0.引言 利用机器学习的方法训练微笑检测模型,给一张人脸照片,判断是否微笑: 使用的数据集中69张没笑脸,65张有笑脸,训练结果识别精度在95%附近: 效果: 图1 示例效果 工程利用pytho ...
- 使用sklearn机器学习库实现线性回归
import numpy as np # 导入科学技术框架import matplotlib.pyplot as plt # 导入画图工具from sklearn.linear_model imp ...
- Python线性回归算法【解析解,sklearn机器学习库】
一.概述 参考博客:https://www.cnblogs.com/yszd/p/8529704.html 二.代码实现[解析解] import numpy as np import matplotl ...
- 用python+sklearn(机器学习)实现天气预报数据 模型和使用
用python+sklearn机器学习实现天气预报 模型和使用 项目地址 系列教程 0.前言 1.建立模型 a.准备 引入所需要的头文件 选择模型 选择评估方法 获取数据集 b.建立模型 c.获取模型 ...
- 用python+sklearn(机器学习)实现天气预报数据 数据
用python+sklearn机器学习实现天气预报 数据 项目地址 系列教程 勘误表 0.前言 1.爬虫 a.确认要被爬取的网页网址 b.爬虫部分 c.网页内容匹配取出部分 d.写入csv文件格式化 ...
- 用python+sklearn(机器学习)实现天气预报 准备
用python+sklearn机器学习实现天气预报 准备 项目地址 系列教程 0.流程介绍 1. 环境搭建 a.python b.涉及到的机器学习相关库 sklearn panda seaborn j ...
- 5分钟教你玩转 sklearn 机器学习(上)
假期结束,你的状态有没有回归?那么,放空脑袋后,先来学习学习,欢迎大家继续关注腾讯云技术社区. 作者:赵成龙 这是一篇很难写的文章,因为我希望这篇文章能对大家有所帮助.我不会给大家介绍机器学习,数据挖 ...
- 编程作业1.1——sklearn机器学习算法系列之LinearRegression线性回归
知识点 scikit-learn 对于线性回归提供了比较多的类库,这些类库都可以用来做线性回归分析. 我们也可以使用scikit-learn的线性回归函数,而不是从头开始实现这些算法. 我们将scik ...
- sklearn机器学习-特征提取1
scikit-learn机器学习的特征提取部分较多nlp内容,故学到一半学不下去,看完nltk再来补上 scikit-learn机器学习的特征提取这一章感觉讲的不是特别好,所以会结合着来看 首先是Di ...
随机推荐
- hdu-1814(2-sat)
题意:给你n个组,m条规则,每组有俩个人,这两个人不能同时出现,然后m条规则代表着有两个人,这两个人也不能同时出现,问你是否存在每组都能出现一人的选择方案 解题思路:因为这个需要字典序输出,所以只能用 ...
- hdu—3861(tarjan+二分图)
题意:给你n个城市,每个城市之间有一条有向边,将城市划分为几个区域,问你最小的划分方法, 划分规则为:能相互到达的放在一个区域:然后区域内的a,b两点肯定存在某种方式,使得a能到b或者b能到a(注意, ...
- 训练赛-Building Numbers
题意:首先告诉你,一个数字从1开始有两种变换方式:1.当前数字的值加1 2.当前的数字值乘2: 思路:首先把数组里的数字需要的变换次数算出来,然后用前缀和解决: 代码: #include<ios ...
- Siki的虚幻第一季
空项目.一闪而过的解决方法 命名空间std::cout的作用: int ,long , long long类型的范围 unsigned int 0-4294967295 int 21474 ...
- HDU3966-Aragorn's Story-树链剖分-点权
很模板的树链剖分题 注意什么时候用线段树上的标号,什么时候用点的标号. #pragma comment(linker, "/STACK:102400000,102400000") ...
- 大学jsp实验七--JavaBean在JSP中的应用
值bean的应用 (1)若有如下图所示的两个JSP页面,在第一个的页面的表单中填写相应内容,提交后再显示用户的提交信息.使用JavaBean的方式实现上述效果,请写出相应的代码. bean文件:Tes ...
- MT【304】反射路径长度比
(高考压轴题改编)如图,长方体$ABCD-A_1B_1C_1D_1$中,$AB=11,AD=7,AA_1=12.$一质点从顶点$A$设向$E(4,3,12)$遇到长方体的面反射(服从光的反射原理),将 ...
- NOIP2018联赛总结
NOIP2018联赛总结 Day 0 打了几个模板,看了一下别人的博客,背了一下vimrc Day 1 到了考场,先把vimrc配好 打开题目一先把三道题瞄了一眼,\(T1\)似乎是NOIP原题,\( ...
- linux中shell脚本引用另一shell脚本
调用有三种方法: 1.fork:不同的shell,调用后返回父shell,子shell从父shell中继承变量,但子shell的变量不会带回父shell,直接用path/to/file.sh调用: 2 ...
- hdu 2516(Fibonacci博弈博弈)
题目链接:http://acm.hdu.edu.cn/showproblem.php?pid=2516 Problem Description 1堆石子有n个,两人轮流取.先取者第1次可以取任意多个, ...