使用d3.v5实现条形图
效果图:
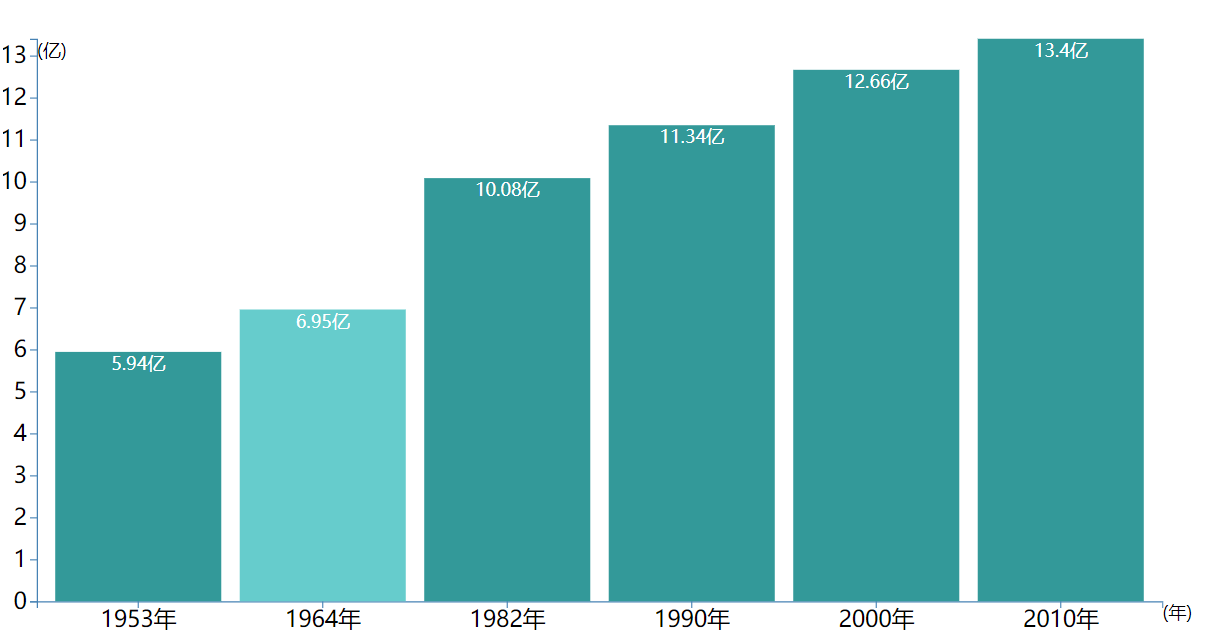
条形图:
目录结构:

<!DOCTYPE html>

<html lang="en">

<head>

    <meta charset="UTF-8">

    <link href="css/style.css" media="screen" rel="stylesheet" type="text/css"/>

    <title>Linechart1</title>

</head>

<body>

    <div id="container"></div>

    <script src="https://d3js.org/d3.v5.min.js"></script>

    <script src="js/index.js"></script>

</body>

</html>
index.html
svg rect{

    fill:#339999;

}

svg rect:hover {

    cursor: pointer;

    fill: #66cccc;

}
style.css
year,population

1953,5.94

1964,6.95

1982,10.08

1990,11.34

2000,12.66

2010,13.40
data.csv
/垂直Bar,加刻度

d3.csv("Data/data.csv",function (d) {

    return {

        // year: new Date(+d.year, 0, 1), // convert "Year" column to Date

        year: d.year+"年",

        population: +d.population // convert "population" column to number

    };

}).then(function (data) {

    console.log(data);

    var //data=[1,8,5,6,8,9,3,5,2,20],

        width=1000,

        height=500,

        margin={left:30,top:30,right:30,bottom:30},

        svg_width=width+margin.left+margin.right,

        svg_height=height+margin.top+margin.bottom;

    //离散缩放 population=>[0,width]

    var scale_x=d3.scaleBand()

        .domain(data.map(function (d) {

            return d.year;

        }))

        .range([0,width])

        .padding(0.1);

    //线性缩放

    var scale_y=d3.scaleLinear()

        .domain([0,d3.max(data,function (d) {

            return d.population;

        })])

        .range([height,0])

    var svg=d3.select("#container")

        .append("svg")

        .attr("width",svg_width)

        .attr("height",svg_height)

    var chart=svg.append("g")

        .attr("transform","translate("+margin.left+","+margin.top+")");

    var x_axis_color="steelblue",

        y_axis_color="steelblue";

    var x_axis=chart.append('g')

        .call(d3.axisBottom(scale_x))

        .attr("transform","translate(0,"+height+")");

    x_axis.selectAll("path")

        .attr("stroke",x_axis_color)

    x_axis.selectAll("line")

        .attr("stroke",x_axis_color)

    x_axis.selectAll("text")

        .attr("font-size",'2em')

    var y_axis=chart.append('g')

        .call(d3.axisLeft(scale_y));

    y_axis.selectAll("path")

        .attr("stroke",y_axis_color)

    y_axis.selectAll("line")

        .attr("stroke",y_axis_color)

    y_axis.selectAll("text")

        .attr("font-size",'2em')

    //Y轴注解

    chart.append("text")

        .text("(亿)")

        // .attr("text-anchor","end")

        // .attr("transform","rotate(-90)")

        .attr("dy","1em")

    //X轴注解

    chart.append("text")

        .text("(年)")

        // .attr("text-anchor","end")

        .attr("transform","translate("+width+","+height+")")

        .attr("dy","1em")

    var bar=chart.selectAll(".bar")

        .data(data)

        .enter()

        .append("g")

        .attr("transform",function (d,i) {

            return "translate("+scale_x(d.year)+",0)"

        })

    bar.append("rect")

        .attr("y",function (d) {

            return scale_y(d.population);

        })

        .attr("height",function (d) {

            return height-scale_y(d.population);

        })

        .attr("width",scale_x.bandwidth() )

        .attr("class",".rect")

    bar.append("text")

        .text(function (d) {

            return d.population+"亿";

        })

        .attr("y",function (d) {

            return scale_y(d.population);

        })

        .attr("x",scale_x.bandwidth() /2)

        .attr("dy","1em")

        .style("text-anchor","middle")

        .style("fill","white")

})
index.js
参考教程:https://www.imooc.com/learn/103
使用d3.v5实现条形图的更多相关文章
- 使用d3.v5实现饼状图
效果图: 饼状图: 目录结构: <!DOCTYPE html> <html lang="en"> <head> <meta charset ...
- 使用d3.v5实现折线图与面积图
d3最新是V5版的,比起V2的API变动了不少,写下我实现过程 效果图: 面积图: 折线图: 目录结构: <!DOCTYPE html> <html lang="en&qu ...
- D3(v5) in TypeScript 坐标轴之 饼状图生成
饼状图生成时依旧遇到了类型问题,记录如下: import * as d3 from 'd3'; import * as React from 'react'; class TestGraph exte ...
- D3(v5) in TypeScript 坐标轴之 scaleBand用法
在学习d3时候,发现在TS中实现D3的坐标轴中遇到一些错误,而这些错误却不会存在于js(因为ts的类型检查)写法中,因此做下笔记: import * as d3 from 'd3';import * ...
- Vue整合d3.v5.js制作--柱状图(rect)
先上效果图: 图中柱状图变成纯蓝色是鼠标滑动过的颜色(颜色可改,本人配色能力十分的强,建议直接用默认设置即可 ( ᖛ ̫ ᖛ )ʃ)) 1.环境说明 Vue版本:"vue": &q ...
- Vue整合d3.v5.js制作--折线图(line)
先上效果图(x轴固定为时间轴): 图中出现的悬浮框是鼠标悬停效果 1.环境说明: vue版本:"vue": "^2.5.2" d3版本:"d3&quo ...
- ASP.NET+d3.js实现Sqlserver数据库的可视化展示
效果: 数据库端: 前端展示: 实现原理: 1.在数据段建立两个存储过程 queryUserAnsawer(id) 根据用户ID返回每一题的得分,主要是bcp exe时不能直接在sqlserver中执 ...
- 使用D3.js构建实时图形
首先你需要在计算机上安装Node和npm. 数据的可视化表示是传递复杂信息的最有效手段之一,D3.js提供了创建这些数据可视化的强大工具和灵活性. D3.js是一个JavaScript库,用于使用SV ...
- 使用JavaScript和D3.js实现数据可视化
欢迎大家前往腾讯云+社区,获取更多腾讯海量技术实践干货哦~ 本文由独木桥先生发表于云+社区专栏 介绍 D3.js是一个JavaScript库.它的全称是Data-Driven Documents(数据 ...
随机推荐
- Java高并发之无锁与Atomic源码分析
目录 CAS原理 AtomicInteger Unsafe AtomicReference AtomicStampedReference AtomicIntegerArray AtomicIntege ...
- 并发库应用之九 & 到时计数器CountDownLatch应用
申明:CountDownLatch好像倒计时计数器,调用CountDownLatch对象的countDown方法就将计数器减1,当到达0时,所有等待者就开始执行. java.util.concurre ...
- Oracle-05:伪表dual
------------吾亦无他,唯手熟尔,谦卑若愚,好学若饥------------- 此乃这张表里的全部字段信息,此表无法做修改操作 为什么有伪表这个概念?????????? 因为sql92的一个 ...
- SSM-MyBatis-05:Mybatis中别名,sql片段和模糊查询加getMapper
------------吾亦无他,唯手熟尔,谦卑若愚,好学若饥------------- 简单概述一下本讲 别名,sql片段简单写一下,模糊查询多写一点 一.别名 <typeAliases> ...
- Linux时间子系统之(十四):tick broadcast framework
专题文档汇总目录 Notes:BroadcastTick作为cpuidle的waker,硬件基础.BroadcastTick嵌入在当前系统Tick框架中.BroadcastTick设备初始化:周期性T ...
- 自研网关纳管Spring Cloud(一)
摘要: 本文主要从网关的需求,以及Spring Cloud Zuul的线程模型和源码瓶颈分析结合,目前最近一段时间自研网关中间件纳管Spring Cloud的经验汇总整理. 一.自研网关纳管Sprin ...
- 产品 vs 服务,见识,耐心
站在空无一人略有冷意的街头,突然有种恍如隔世的感觉:这就是传说中橘生淮北则为枳的淮北?咦,我为什么会出现在这里? 于是我陷入了深深的思考. 关于对过去的思考 托尔斯泰说过:幸福的家庭是相似的,不幸的家 ...
- mysql查询当天所有数据sql语句
mysql查询当天的所有信息: select * from test where year(regdate)=year(now()) and month(regdate)=month(now()) a ...
- 2. 引入springmvc
springboot提供了spring-web-starter-web为web开发提供了支持,并且内嵌了tomcat及spring mvc的依赖,而且通过spring-boot-autoconfigu ...
- Java 学习笔记 (三) Java 日期类型
以下内容摘自: https://www.cnblogs.com/crazylqy/p/4172324.html import java.sql.Timestamp; import java.text ...