
Oracle ASH报告生成和性能分析
我写的SQL调优专栏:https://blog.csdn.net/u014427391/article/category/8679315
对于局部的,比如某个页面列表sql,我们可以使用Oracle的执行计划进行sql调优,但是对于整个系统来说,你可以知道哪些sql比较耗时?当然可以通过查Oracle的共享池得到,不过Oracle系统本身就提供了几种性能分析报告,比如AWR、ASH、ADDM等等报告,本博客介绍一下ASH性能分析报告
ASH即活动会话历史,Active Session History,ASH以V$SESSION为基础,每秒采样一次,记录活动会话等待的事件。不活动的会话不会采样, 采样工作由新引入的后台进程MMNL完成。
v$active_session_history视图提供了在实例级别抽取会话活动信息。活动会话每分钟会被抽样一次且被存储在sga中的循环缓冲区中。任何被连接到数据库且正等待一个不属于空闲等待时间的会话会被考虑是一个活动的会话。每个会话抽样都是一组行数据且通过v$active_session_history视图来返回每个被抽样活动会话的行数据,返回最新被抽样会话的第一行数据。
一、ASH报告生成
继上一篇AWR方面的博客之后,https://smilenicky.blog.csdn.net/article/details/89414432,我再写一篇ASH方面的博客:
1.1 工具选择
对于Oracle数据库可以使用sqlplus或者plsql developer客户端软件
sqlplus 使用
可以使用sqlplus工具登录
进入数据库
sqlplus / as sysdba
查看用户
show parameter db_name
用登录之后才可以使用
plsql developer使用
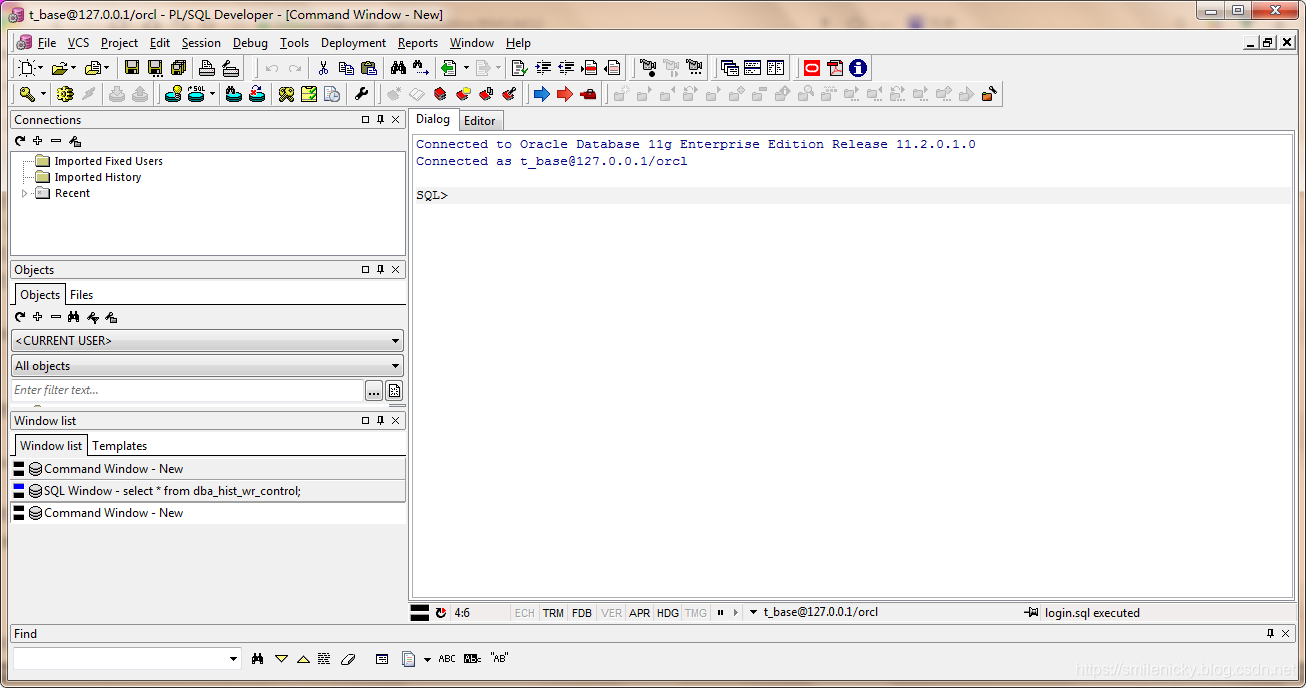
plsql developer也可以使用,登录之后,选择文件(File)->新建(New)->命令窗口(Command Window)
1.2 自动创建快照
开始压测后执行
exec DBMS_WORKLOAD_REPOSITORY.CREATE_SNAPSHOT ();
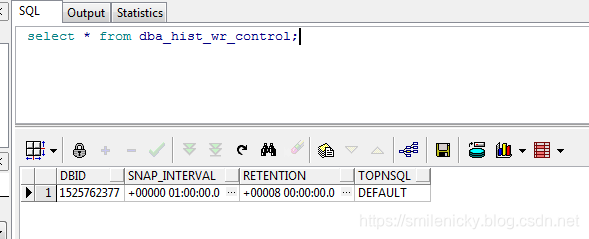
可以通过dba_hist_wr_control查看当前的配置情况,当前awr为每1小时做一次数据快照,保留时间为8天。
select * from dba_hist_wr_control;
修改配置,每隔30分钟收集一次,保存1天
execute dbms_workload_repository.modify_snapshot_settings(interval=>30,retention=>14000);
关闭自动收集
SQL>exec dbms_workload_repository.modify_snapshot_settings (interval=>0,retention=>24*60);
1.3 手工创建快照
除了自动创建快照,也可以手工创建快照
select dbms_workload_repository.create_snapshot() from dual;
1.4 ASH报告生成
对于sqlplus客户端的可以使用
@?/rdbms/admin/ashrpt.sql
对于plsql客户端,我用绝对路径去执行,@?的命令找不到文件
这个要根据自己的Oracle安装路径去修改,例如:
@D:/oracle/product/11.1.0/db_1/RDBMS/ADMIN/ashrpt.sql
(1)日志报告类型
Enter value for report_type: text
选择生成的ASH 报告类型,是text 还是html,一般选择html
(2)日志报告起始时间
Enter value for begin_time: 04/18/1920:00:00
输入ASH 开始的时间,时间格式上面的示例有说明,比如我这里是2019年4月18日晚上20:00:00开始。
(3)日志报告结束时间
Enter value for duration:15
输入ASH 结束时间,默认是SYSDATE - begin_time,一般输入,一般默认是秒或者分组,拿出15分组的ash分析日志来。
(4) ASH报告名称
Enter value of report name:ash20190420
输入ASH报告名称,可以随意填,非生产,报告名称,打印的日志后面可以找到报告存放路径,比如:
D:\oracle\product\11.2.0\dbhome_1\RDBMS\ADMIN\ash.html
SQL> @D:/oracle/product/11.1.0/db_1/RDBMS/ADMIN/ashrpt.sql

Current Instance

~~~~~~~~~~~~~~~~

      DBID DB_NAME      INST_ INST_NAME

---------- ------------ ----- ------------

1525762377 ORCL             1 orcl

Specify the Report Type

~~~~~~~~~~~~~~~~~~~~~~~

Enter 'html' for an HTML report, or 'text' for plain text

Defaults to 'html'

Type Specified:  html

Instances in this Workload Repository schema

~~~~~~~~~~~~~~~~~~~~~~~~~~~~~~~~~~~~~~~~~~~~

DBBID        INSTT DBB_NAME     INSTT_NAME   HOST

------------ ----- ------------ ------------ ------------

* 1525762377     1 ORCL         orcl         PC-201508171

                                             906

Defaults to current database

Using database id: 1525762377

Enter instance numbers. Enter 'ALL' for all instances in a

RAC cluster or explicitly specify list of instances (e.g., 1,2,3).

Defaults to current instance.

Using instance number(s): 1

PL/SQL procedure successfully completed

...

0

PL/SQL procedure successfully completed

...

18-Apr-19 22:05:54

ASH Samples in this Workload Repository schema

~~~~~~~~~~~~~~~~~~~~~~~~~~~~~~~~~~~~~~~~~~~~~~

Oldest ASH sample available:  09-Apr-19 22:00:36   [    12968 mins in the past] Latest ASH sample available:  18-Apr-19 22:05:54   [        3 mins in the past]

...

18-Apr-19 22:05:54

Specify the timeframe to generate the ASH report

~~~~~~~~~~~~~~~~~~~~~~~~~~~~~~~~~~~~~~~~~~~~~~~~

Enter begin time for report:

--    Valid input formats:

--      To specify absolute begin time:

--        [MM/DD[/YY]] HH24:MI[:SS]

--        Examples: 02/23/03 14:30:15

--                  02/23 14:30:15

--                  14:30:15

--                  14:30

--      To specify relative begin time: (start with '-' sign)

--        -[HH24:]MI

--        Examples: -1:15  (SYSDATE - 1 Hr 15 Mins)

--                  -25    (SYSDATE - 25 Mins)

Defaults to -15 mins

Report begin time specified: 04/18/1920:00:00

PL/SQL procedure successfully completed

18-Apr-20 00:00:00

Enter duration in minutes starting from begin time:

Defaults to SYSDATE - begin_time

Press Enter to analyze till current time

Report duration specified:   7200

PL/SQL procedure successfully completed

...

23-Apr-20 00:00:00

Specify Slot Width (using ashrpti.sql) for 'Activity Over Time' section

~~~~~~~~~~~~~~~~~~~~~~~~~~~~~~~~~~~~~~~~~~~~~~~~~~~~~~~~~~~~~~~~~~~~~~~

-- Explanation:

--   In the 'Activity Over Time' section of the ASH report,

--   the analysis period is divided into smaller slots

--   and top wait events are reported in each of those slots.

-- Default:

--   The analysis period will be automatically split upto 10 slots

--   complying to a minimum slot width of

--     1 minute,  if the source is V$ACTIVE_SESSION_HISTORY or

--     5 minutes, if the source is DBA_HIST_ACTIVE_SESS_HISTORY.

Specify Slot Width in seconds to use in the 'Activity Over Time' section:

Defaults to a value as explained above:

Slot Width specified:

Specify Report Targets (using ashrpti.sql) to generate the ASH report

~~~~~~~~~~~~~~~~~~~~~~~~~~~~~~~~~~~~~~~~~~~~~~~~~~~~~~~~~~~~~~~~~~~~~

-- Explanation:

--   ASH Report can accept "Report Targets",

--   like a particular SQL statement, or a particular SESSION,

--   to generate the report on. If one or more report targets are

--   specified, then the data used to generate the report will only be

--   the ASH samples that pertain to ALL the specified report targets.

-- Default:

--   If none of the report targets are specified,

--   then the target defaults to all activity in the database instance.

Specify SESSION_ID (eg: from V$SESSION.SID) report target:

Defaults to NULL:

SESSION report target specified:

Specify SQL_ID (eg: from V$SQL.SQL_ID) report target:

Defaults to NULL: (% and _ wildcards allowed)

SQL report target specified:

Specify WAIT_CLASS name (eg: from V$EVENT_NAME.WAIT_CLASS) report target:

[Enter 'CPU' to investigate CPU usage]

Defaults to NULL: (% and _ wildcards allowed)

WAIT_CLASS report target specified:

Specify SERVICE_HASH (eg: from V$ACTIVE_SERVICES.NAME_HASH) report target:

Defaults to NULL:

SERVICE report target specified:

Specify MODULE name (eg: from V$SESSION.MODULE) report target:

Defaults to NULL: (% and _ wildcards allowed)

MODULE report target specified:

Specify ACTION name (eg: from V$SESSION.ACTION) report target:

Defaults to NULL: (% and _ wildcards allowed)

ACTION report target specified:

Specify CLIENT_ID (eg: from V$SESSION.CLIENT_IDENTIFIER) report target:

Defaults to NULL: (% and _ wildcards allowed)

CLIENT_ID report target specified:

Specify PLSQL_ENTRY name (eg: "SYS.DBMS_LOB.*") report target:

Defaults to NULL: (% and _ wildcards allowed)

PLSQL_ENTRY report target specified:

Specify the Report Name

~~~~~~~~~~~~~~~~~~~~~~~

The default report file name is ashrpt_1_0423_0000.html.  To use this name,

press <return> to continue, otherwise enter an alternative.

Using the report name ash.html

Summary of All User Input -------------------------                                                        Format         : HTML                                                            DB Id          : 1525762377                                                      Inst num       : 1                                                               Begin time     : 18-Apr-20 00:00:00                                              End time       : 23-Apr-20 00:00:00                                              Slot width     : Default                                                         Report targets : 0                                                               Report name    : ash.html

...

23-Apr-20 00:00:00

Started spooling to D:\oracle\product\11.2.0\dbhome_1\RDBMS\ADMIN\ash.html
二、ASH报告指标分析
ASH报告就非常直接了,直接给出等待事件和哪些SQL关联,然后我们就可以拿SQL去调优了
图来自《收获,不止SQL优化》一书

Oracle ASH报告生成和性能分析的更多相关文章
- Oracle AWRDD报告生成和性能分析
我写的SQL调优专栏:https://blog.csdn.net/u014427391/article/category/8679315 对于局部的,比如某个页面列表sql,我们可以使用Oracle的 ...
- Oracle ADDM报告生成和性能分析
我写的SQL调优专栏:https://blog.csdn.net/u014427391/article/category/8679315 对于局部的,比如某个页面列表sql,我们可以使用Oracle的 ...
- Oracle AWRSQRPT报告生成和性能分析
我写的SQL调优专栏:https://blog.csdn.net/u014427391/article/category/8679315 对于局部的,比如某个页面列表sql,我们可以使用Oracle的 ...
- Oracle AWR报告生成和性能分析
目录 一.AWE报告生成步骤 1.1 工具选择 1.2 自动创建快照 1.3 手工创建快照 1.4 生成AWR报告 二.AWR报告分析 2.1 AWR之DB Time 2.2 AWR之load_pro ...
- ORACLE AWR报告生成步骤
ORACLE AWR报告生成步骤 (以PL/SQL中命令窗口为例) 1.sqlplus或plsql的commod窗口(命令窗口)运行命令 @D:\oracle\product\10.2.0\db_1\ ...
- Oracle Update 语句语法与性能分析 - 多表关联
Oracle Update 语句语法与性能分析 - 多表关联 为了方便起见,建立了以下简单模型,和构造了部分测试数据: 在某个业务受理子系统BSS中, SQL 代码 --客户资料表 create ...
- [转]oracle awr报告生成和分析
转自:http://blog.csdn.net/cuker919/article/details/8767328 最近由于数据库cpu占用非常高,导致VCS常常自动切换,引起很多问题. 最近学习一下数 ...
- oracle sql语句跟踪及性能分析工具实现
在网上找了一大圈,没找着合适的工具来跟踪oracle一段时间的sql. 我们的场景是打算自动化跑遍所有场景(rft)+fiddler跟踪请求+后端跟踪sql,根据结果去分析慢的请求和sql,本来awr ...
- Oracle awr报告生成操作步骤
1.登录主机切换到oracle用户 ssh root@192.168.220.128 su - oracle 2.以sysdba身份登录数据库 sqlplus / as sysdba 3.执行@?/r ...
随机推荐
- SpringBoot如何新建一个项目 2017.12.14
http://blog.csdn.net/q649381130/article/details/77875736 从入门到精通
- JavaScript的数据类型问题总结
一 JS中有哪些数据类型? -- 共 6 种数据类型,其中 5 种基本数据类型Undefined,Null,Boolean,Number和 String,1 种复杂数据类型Object.因为EC ...
- Extjs 上传文件 IE不兼容的问题[提示下载保存]
我最不喜欢的浏览器的是IE,但无奈很多项目的客户使用的是IE. 在使用Extjs做文件上传时,其他浏览器没有问题,但IE却一个劲提示保存文件,看服务端运行,它其实是运行成功了已经,但客户端的进度条却一 ...
- python爬取网易云周杰伦所有专辑,歌曲,评论,并完成可视化分析
---恢复内容开始--- 去年在网络上有一篇文章特别有名:我分析42万字的歌词,为搞清楚民谣歌手们在唱些什么.这篇文章的作者是我大学的室友,随后网络上出现了各种以为爬取了XXX,发现了XXX为名的文章 ...
- java基础学习周计划之2--面向对象
JAVA面向对象第一天一. 知识点:1. 类和对象二. 关键问题(理论):1. 简述什么是类.什么是对象2. 简述基本类型变量与引用类型变量赋值时的差别3. 简述null的含义三. 关键代码(操作): ...
- stats.go
, len(c.clients)) for _, client := range c.clients { clients = append(cl ...
- message.go
+MsgIDLength:] return &msg, nil } func writeMessageToBackend(buf *bytes.Buffer, msg *Message ...
- Hibernate Annotation _List/Map
// Student.java 实体类 package com.tao.pojo; import java.util.List; public class Student { private int ...
- 【LOJ #6094. 「Codeforces Round #418」归乡迷途】
题目大意: 传送门. lca说的很明白就不重复了. 题解: 先膜一发lca. 大体读完题以后我们可以知道对于第i个节点最短路一定是连向1到i-1中的某个点. 然后我们考虑将到1距离(这里及以下均是最短 ...
- 用js制作数码时钟
实现效果 实现效果 图片素材 图片素材 原理分析 用setInterval(fn, 1000)来循环刷新图片. 用date对象的getHours().getMinutes().getSeconds() ...