sklearn提供的自带的数据集
sklearn 的数据集有好多个种
- 自带的小数据集(packaged dataset):sklearn.datasets.load_<name>
- 可在线下载的数据集(Downloaded Dataset):sklearn.datasets.fetch_<name>
- 计算机生成的数据集(Generated Dataset):sklearn.datasets.make_<name>
- svmlight/libsvm格式的数据集:sklearn.datasets.load_svmlight_file(...)
- 从买了data.org在线下载获取的数据集:sklearn.datasets.fetch_mldata(...)
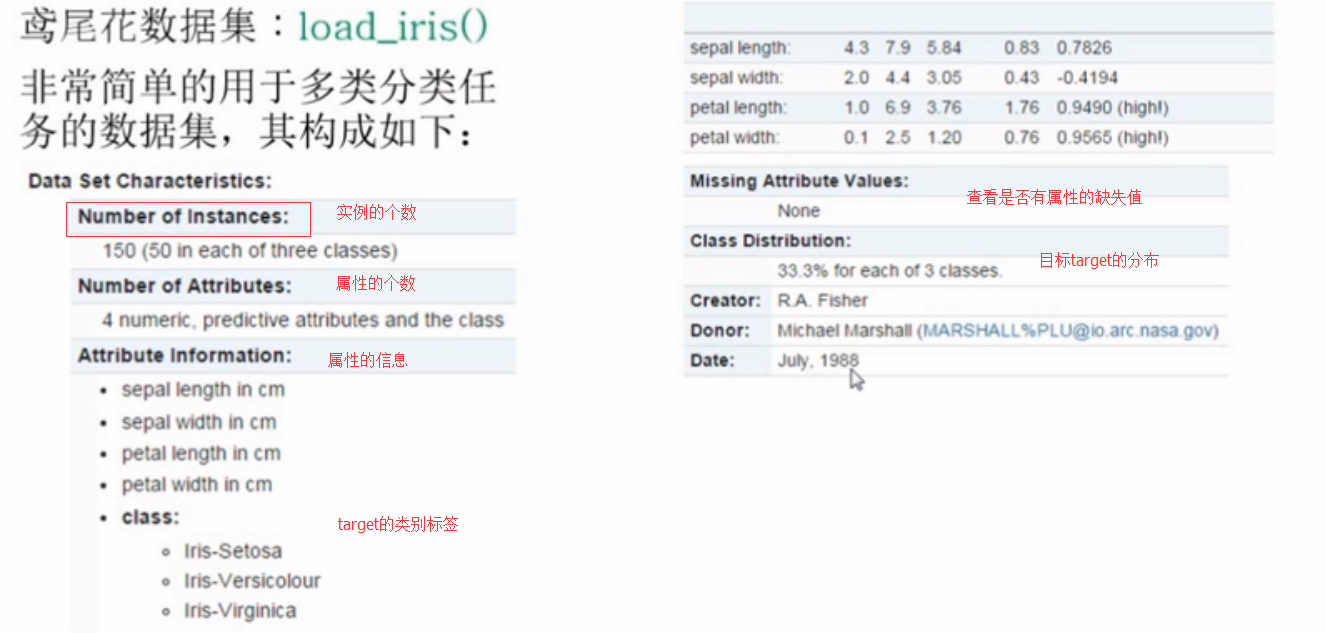
①自带的数据集
其中的自带的小的数据集为:sklearn.datasets.load_<name>

这些数据集都可以在官网上查到,以鸢尾花为例,可以在官网上找到demo,http://scikit-learn.org/stable/auto_examples/datasets/plot_iris_dataset.html
from sklearn.datasets import load_iris
#加载数据集

iris=load_iris()

iris.keys()  #dict_keys(['target', 'DESCR', 'data', 'target_names', 'feature_names'])
#数据的条数和维数

n_samples,n_features=iris.data.shape

print("Number of sample:",n_samples)  #Number of sample: 150

print("Number of feature",n_features)  #Number of feature 4
#第一个样例

print(iris.data[0])      #[ 5.1  3.5  1.4  0.2]

print(iris.data.shape)    #(150, 4)

print(iris.target.shape)  #(150,)

print(iris.target)
"""
[0 0 0 0 0 0 0 0 0 0 0 0 0 0 0 0 0 0 0 0 0 0 0 0 0 0 0 0 0 0 0 0 0 0 0 0 0
0 0 0 0 0 0 0 0 0 0 0 0 0 1 1 1 1 1 1 1 1 1 1 1 1 1 1 1 1 1 1 1 1 1 1 1 1
1 1 1 1 1 1 1 1 1 1 1 1 1 1 1 1 1 1 1 1 1 1 1 1 1 1 2 2 2 2 2 2 2 2 2 2 2
2 2 2 2 2 2 2 2 2 2 2 2 2 2 2 2 2 2 2 2 2 2 2 2 2 2 2 2 2 2 2 2 2 2 2 2 2
2 2]
"""
import numpy as np
print(iris.target_names) #['setosa' 'versicolor' 'virginica']
np.bincount(iris.target) #[50 50 50] import matplotlib.pyplot as plt
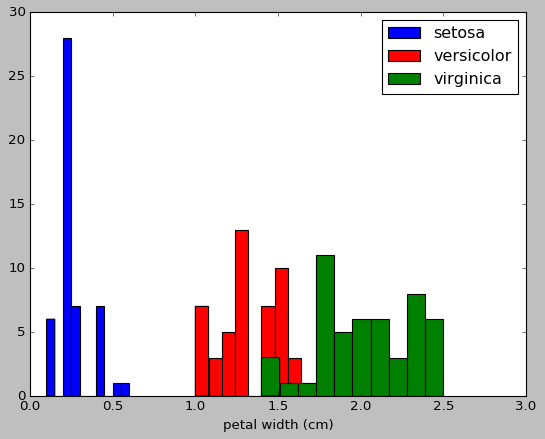
#以第3个索引为划分依据,x_index的值可以为0,1,2,3
x_index=3
color=['blue','red','green']
for label,color in zip(range(len(iris.target_names)),color):
plt.hist(iris.data[iris.target==label,x_index],label=iris.target_names[label],color=color) plt.xlabel(iris.feature_names[x_index])
plt.legend(loc="Upper right")
plt.show()
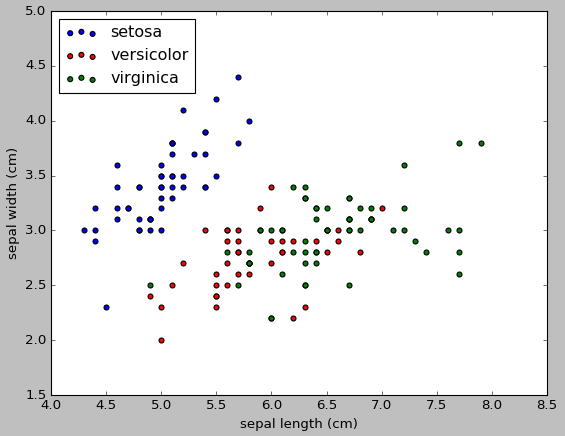
#画散点图,第一维的数据作为x轴和第二维的数据作为y轴
x_index=0
y_index=1
colors=['blue','red','green']
for label,color in zip(range(len(iris.target_names)),colors):
plt.scatter(iris.data[iris.target==label,x_index],
iris.data[iris.target==label,y_index],
label=iris.target_names[label],
c=color)
plt.xlabel(iris.feature_names[x_index])
plt.ylabel(iris.feature_names[y_index])
plt.legend(loc='upper left')
plt.show()
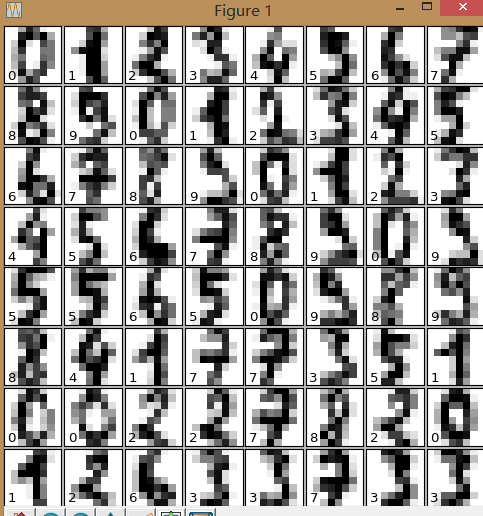
手写数字数据集load_digits():用于多分类任务的数据集
from sklearn.datasets import load_digits

digits=load_digits()

print(digits.data.shape)

import matplotlib.pyplot as plt

plt.gray()

plt.matshow(digits.images[0])

plt.show()

from sklearn.datasets import load_digits

digits=load_digits()

digits.keys()

n_samples,n_features=digits.data.shape

print((n_samples,n_features))

print(digits.data.shape)

print(digits.images.shape)

import numpy as np

print(np.all(digits.images.reshape((1797,64))==digits.data))

fig=plt.figure(figsize=(6,6))

fig.subplots_adjust(left=0,right=1,bottom=0,top=1,hspace=0.05,wspace=0.05)

#绘制数字:每张图像8*8像素点

for i in range(64):

    ax=fig.add_subplot(8,8,i+1,xticks=[],yticks=[])

    ax.imshow(digits.images[i],cmap=plt.cm.binary,interpolation='nearest')

    #用目标值标记图像

    ax.text(0,7,str(digits.target[i]))

plt.show()

乳腺癌数据集load-barest-cancer():简单经典的用于二分类任务的数据集
糖尿病数据集:load-diabetes():经典的用于回归认为的数据集,值得注意的是,这10个特征中的每个特征都已经被处理成0均值,方差归一化的特征值,
波士顿房价数据集:load-boston():经典的用于回归任务的数据集
体能训练数据集:load-linnerud():经典的用于多变量回归任务的数据集,其内部包含两个小数据集:Excise是对3个训练变量的20次观测(体重,腰围,脉搏),physiological是对3个生理学变量的20次观测(引体向上,仰卧起坐,立定跳远)
svmlight/libsvm的每一行样本的存放格式:
<label><feature-id>:<feature-value> <feature-id>:<feature-value> ....
这种格式比较适合用来存放稀疏数据,在sklearn中,用scipy sparse CSR矩阵来存放X,用numpy数组来存放Y
from sklearn.datasets import load_svmlight_file

x_train,y_train=load_svmlight_file("/path/to/train_dataset.txt","")#如果要加在多个数据的时候,可以用逗号隔开
②生成数据集
生成数据集:可以用来分类任务,可以用来回归任务,可以用来聚类任务,用于流形学习的,用于因子分解任务的
用于分类任务和聚类任务的:这些函数产生样本特征向量矩阵以及对应的类别标签集合
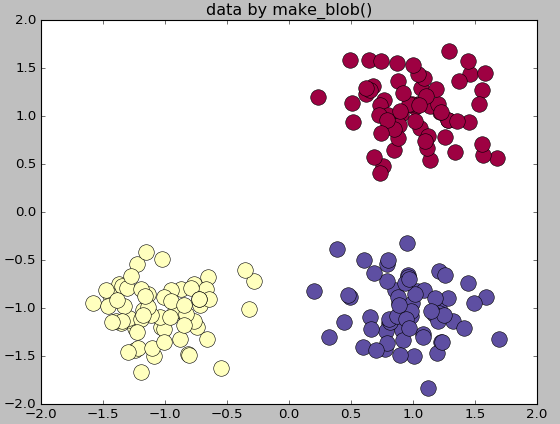
make_blobs:多类单标签数据集,为每个类分配一个或多个正太分布的点集
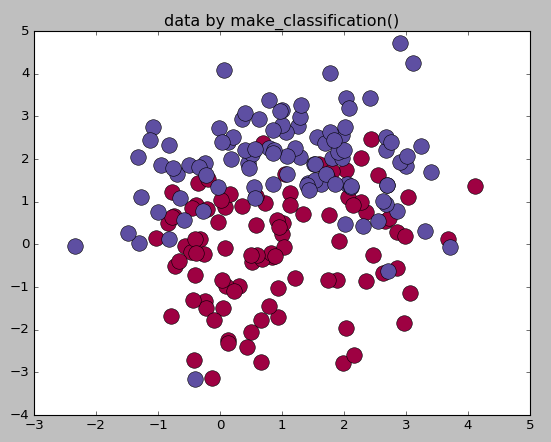
make_classification:多类单标签数据集,为每个类分配一个或多个正太分布的点集,提供了为数据添加噪声的方式,包括维度相关性,无效特征以及冗余特征等
make_gaussian-quantiles:将一个单高斯分布的点集划分为两个数量均等的点集,作为两类
make_hastie-10-2:产生一个相似的二元分类数据集,有10个维度
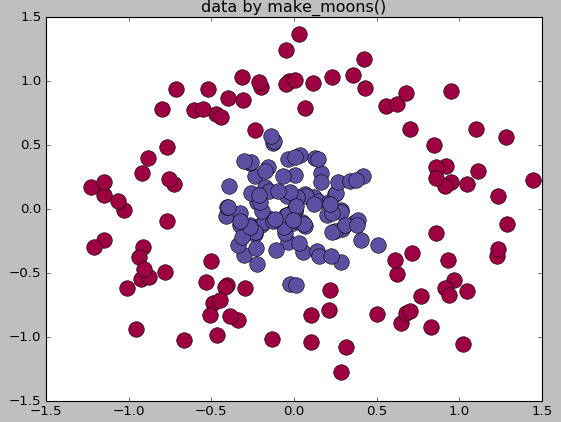
make_circle和make_moom产生二维二元分类数据集来测试某些算法的性能,可以为数据集添加噪声,可以为二元分类器产生一些球形判决界面的数据
#生成多类单标签数据集
import numpy as np

import matplotlib.pyplot as plt

from sklearn.datasets.samples_generator import make_blobs

center=[[1,1],[-1,-1],[1,-1]]

cluster_std=0.3

X,labels=make_blobs(n_samples=200,centers=center,n_features=2,

                    cluster_std=cluster_std,random_state=0)

print('X.shape',X.shape)

print("labels",set(labels))

unique_lables=set(labels)

colors=plt.cm.Spectral(np.linspace(0,1,len(unique_lables)))

for k,col in zip(unique_lables,colors):

    x_k=X[labels==k]

    plt.plot(x_k[:,0],x_k[:,1],'o',markerfacecolor=col,markeredgecolor="k",

             markersize=14)

plt.title('data by make_blob()')

plt.show()

#生成用于分类的数据集
from sklearn.datasets.samples_generator import make_classification

X,labels=make_classification(n_samples=200,n_features=2,n_redundant=0,n_informative=2,

                             random_state=1,n_clusters_per_class=2)

rng=np.random.RandomState(2)

X+=2*rng.uniform(size=X.shape)

unique_lables=set(labels)

colors=plt.cm.Spectral(np.linspace(0,1,len(unique_lables)))

for k,col in zip(unique_lables,colors):

    x_k=X[labels==k]

    plt.plot(x_k[:,0],x_k[:,1],'o',markerfacecolor=col,markeredgecolor="k",

             markersize=14)

plt.title('data by make_classification()')

plt.show()

#生成球形判决界面的数据

from sklearn.datasets.samples_generator import make_circles

X,labels=make_circles(n_samples=200,noise=0.2,factor=0.2,random_state=1)

print("X.shape:",X.shape)

print("labels:",set(labels))

unique_lables=set(labels)

colors=plt.cm.Spectral(np.linspace(0,1,len(unique_lables)))

for k,col in zip(unique_lables,colors):

    x_k=X[labels==k]

    plt.plot(x_k[:,0],x_k[:,1],'o',markerfacecolor=col,markeredgecolor="k",

             markersize=14)

plt.title('data by make_moons()')

plt.show()
sklearn提供的自带的数据集的更多相关文章
- Python——sklearn提供的自带的数据集
sklearn提供的自带的数据集 sklearn 的数据集有好多个种 自带的小数据集(packaged dataset):sklearn.datasets.load_<name> 可在线下 ...
- sklearn提供的自带数据集
sklearn 的数据集有好多个种 自带的小数据集(packaged dataset):sklearn.datasets.load_<name> 可在线下载的数据集(Downloaded ...
- 『Sklearn』框架自带数据集接口
自带数据集类型如下: # 自带小型数据集# sklearn.datasets.load_<name># 在线下载数据集# sklearn.datasets.fetch_<name&g ...
- C#调用Oracle带输出数据集的存储过程
1.创建一个带输出数据集的Oracle存储过程 create or replace procedure PRO_test(in_top in number,cur_out out sys_refcur ...
- 实验一 使用sklearn的决策树实现iris鸢尾花数据集的分类
使用sklearn的决策树实现iris鸢尾花数据集的分类 要求: 建立分类模型,至少包含4个剪枝参数:max_depth.min_samples_leaf .min_samples_split.max ...
- sklearn训练感知器用iris数据集
简化版代码 from sklearn import datasets import numpy as np #获取data和类标 iris = datasets.load_iris() X = iri ...
- from sklearn.datasets import make_classification创建分类数据集
make_classification创建用于分类的数据集,官方文档 例子: ### 创建模型 def create_model(): # 生成数据 from sklearn.datasets imp ...
- hibernate 为什么持久化类时必须提供一个不带参数的默认构造函数
因为hibernate框架会调用这个默认构造方法来构造实例对象..即Class类的newInstance方法 这个方法就是通过调用默认构造方法来创建实例对象的 ,另外再提醒一点,如果你没有提供任何构造 ...
- pytorch torchversion自带的数据集
from torchvision.datasets import MNIST # import torchvision # torchvision.datasets. #准备数据集 mnist = M ...
随机推荐
- C# 中委托和代理是一个概念吗??
刚刚看了一下资料,发现有些资料说的是代理,有的说是委托,但都是指同一样东西delegate,委托和事件是有关的,因为事件的本质就是多播委托,关于多播委托楼主可以找找资料就知道了. 不过个人觉得这两个概 ...
- [转]调试AngularJS应用
原文链接:Debugging AngularJS Apps from the Console 当我们开发AngularJS应用的时候,我们想在Chrome/FF/IE控制台调试隐藏在应用中的数据和服务 ...
- UNIX环境编程学习笔记(23)——信号处理初步学习
lienhua342014-10-29 1 信号的概念 维基百科中关于信号的描述是这样的: 在计算机科学中,信号(英语:Signals)是 Unix.类 Unix 以及其他 POSIX 兼容的操作系统 ...
- MVC學習網站
http://www.cnblogs.com/haogj/archive/2011/11/23/2246032.html
- TV和BTV(全变分和双边全变分)
TV:Total Variation BTV:Bilateral Total Variation Osher等在1992 年提出了总变分(TV)超分辨率重建方法,该方法能够有效地去除噪声和消除模糊,但 ...
- 小白扫盲:Android 设备的CPU类型(通常称为”ABIs”)
早期的Android系统几乎只支持ARMv5的CPU架构,但是现在不同了,你知道现在它支持多少种吗?7种! Android系统目前支持以下七种不同的CPU架构:ARMv5,ARMv7 (从2010年起 ...
- 安装kafka集群
1解压tar包 tar -zxvf kafka_2.-.tgz 2.进入config目录 3.配置server.properties文件 # Licensed to the Apache Softwa ...
- 单例模式__new__
单例模式,使用__new__ __new__是构造函数, __init__是初始化方法,先调用了__new__返回了实例,__init__给这个实例初始化绑定一些属性. class Singleton ...
- [web] spring boot 整合MyBatis
1.maven依赖 <?xml version="1.0" encoding="UTF-8"?> <project xmlns="h ...
- easyui datagrid 单元格编辑(cell editing)
demo中有row editing 项目中发现个cell editing,但是有bug,修改好了 主要实现功能:单击数据表格单元格,编辑单元格数据 js代码如下: $.extend($.fn.data ...