D01-R语言基础学习
R语言基础学习——D01
20190410内容纲要:
1、R的下载与安装
2、R包的安装与使用方法
(1)查看已安装的包
(2)查看是否安装过包
(3)安装包
(4)更新包
3、结果的重用
4、R处理大数据集
5、R的数据结构
(1)向量
(2)矩阵
(3)数组
(4)数据框
(5)列表
6、实例演练
7、小结
1 R的下载与安装
R是用于统计分析、绘图的语言和操作环境。R是属于GNU系统的一个自由、免费、源代码开放的软件,它是一个用于统计计算和统计制图的优秀工具。
学习它那就先下载它!话不多说看链接:
Windows镜像: http://mirror.fcaglp.unlp.edu.ar/CRAN/
当然也有Linux和Mac版本。
安装,就不多少,直接下一步,下一步,下一步。别忘了更改安装路径就行!!!
先随便玩点什么?
>demo()

>demo(graphics)

>help.start()

>help("mean")

>?mean

>getwd()

>setwd("path")

>history()
看完这些,觉得R跟linux和Matlab有点像。据说R的前身是S语言。S语言是什么?https://baike.baidu.com/item/S%E8%AF%AD%E8%A8%80
2 R包的安装与使用方法
(1)查看已安装的包。
首先,如果照1方法安装完成之后打开软件。在R console中输入library()就能查看当前已经安装的包。
>library()
 图书馆‘F:/R/R-3.5.3/library’里有个程辑包:

 abind                                                                 Combine Multidimensional Arrays

 assertthat                                                            Easy Pre and Post Assertions

 base                                                                  The R Base Package

 BH                                                                    Boost C++ Header Files

 boot                                                                  Bootstrap Functions (Originally by Angelo Canty for S)

 car                                                                   Companion to Applied Regression

 carData                                                               Companion to Applied Regression Data Sets

 cellranger                                                            Translate Spreadsheet Cell Ranges to Rows and Columns

 class                                                                 Functions for Classification

 cli                                                                   Helpers for Developing Command Line Interfaces

 clipr                                                                 Read and Write from the System Clipboard

 cluster                                                               "Finding Groups in Data": Cluster Analysis Extended Rousseeuw et al.

 codetools                                                             Code Analysis Tools for R

 compiler                                                              The R Compiler Package

 crayon                                                                Colored Terminal Output

 curl                                                                  A Modern and Flexible Web Client for R

 data.table                                                            Extension of `data.frame`

 datasets                                                              The R Datasets Package

 ellipsis                                                              Tools for Working with ...

 fansi                                                                 ANSI Control Sequence Aware String Functions

 forcats                                                               Tools for Working with Categorical Variables (Factors)

 foreign                                                               Read Data Stored by 'Minitab', 'S', 'SAS', 'SPSS', 'Stata', 'Systat', 'Weka', 'dBase', ...

 graphics                                                              The R Graphics Package

 grDevices                                                             The R Graphics Devices and Support for Colours and Fonts

 grid                                                                  The Grid Graphics Package

 haven                                                                 Import and Export 'SPSS', 'Stata' and 'SAS' Files

 hms                                                                   Pretty Time of Day

 KernSmooth                                                            Functions for Kernel Smoothing Supporting Wand & Jones (1995)

 lattice                                                               Trellis Graphics for R

 lme4                                                                  Linear Mixed-Effects Models using 'Eigen' and S4

 magrittr                                                              A Forward-Pipe Operator for R

 maptools                                                              Tools for Handling Spatial Objects

 MASS                                                                  Support Functions and Datasets for Venables and Ripley's MASS

 Matrix                                                                Sparse and Dense Matrix Classes and Methods

 MatrixModels                                                          Modelling with Sparse And Dense Matrices

 methods                                                               Formal Methods and Classes

 mgcv                                                                  Mixed GAM Computation Vehicle with Automatic Smoothness Estimation

 minqa                                                                 Derivative-free optimization algorithms by quadratic approximation

 nlme                                                                  Linear and Nonlinear Mixed Effects Models

 nloptr                                                                R Interface to NLopt

 nnet                                                                  Feed-Forward Neural Networks and Multinomial Log-Linear Models

 openxlsx                                                              Read, Write and Edit XLSX Files

 parallel                                                              Support for Parallel computation in R

 pbkrtest                                                              Parametric Bootstrap and Kenward Roger Based Methods for Mixed Model Comparison

 pillar                                                                Coloured Formatting for Columns

 pkgconfig                                                             Private Configuration for 'R' Packages

 prettyunits                                                           Pretty, Human Readable Formatting of Quantities

 progress                                                              Terminal Progress Bars

 quantreg                                                              Quantile Regression

 R6                                                                    Encapsulated Classes with Reference Semantics

 Rcpp                                                                  Seamless R and C++ Integration

 RcppEigen                                                             'Rcpp' Integration for the 'Eigen' Templated Linear Algebra Library

 readr                                                                 Read Rectangular Text Data

 readxl                                                                Read Excel Files

 rematch                                                               Match Regular Expressions with a Nicer 'API'

 rio                                                                   A Swiss-Army Knife for Data I/O

 rlang                                                                 Functions for Base Types and Core R and 'Tidyverse' Features

 rpart                                                                 Recursive Partitioning and Regression Trees

 sp                                                                    Classes and Methods for Spatial Data

 SparseM                                                               Sparse Linear Algebra

 spatial                                                               Functions for Kriging and Point Pattern Analysis

 splines                                                               Regression Spline Functions and Classes

 stats                                                                 The R Stats Package

 stats4                                                                Statistical Functions using S4 Classes

 survival                                                              Survival Analysis

 tcltk                                                                 Tcl/Tk Interface

 tibble                                                                Simple Data Frames

 tools                                                                 Tools for Package Development

 translations                                                          The R Translations Package

 utf8                                                                  Unicode Text Processing

 utils                                                                 The R Utils Package

 zip                                                                   Cross-Platform 'zip' Compression
(2)查看当前是否安装过包
>help(package="car") #car就是具体的某个包的名称
如果已经安装过,会自动跳转本机的12569端口查看网页版的详细介绍。如果没有那就装吧~
(3)安装包
安装包的时候会提示选择镜像源,选中国的就行,剩下的就看网络给不给力了~
install.packages("car")
(4)更新包
update.packages() #不生命的话就默认更新全部
3 结果的重用
>head(mtcars)                                      #mtcars是一个数据集

>lm(mpg~wt, data=mtcars                     #lm是线性拟合的命令

>Result = lm(mpg~wt, data=mtcars)

>summary(Result)

>plot(Result)

>predict(Result, mynewdata)                   #mynewdata是自己要预测的值
有很多东西看不懂没事,后面还会有详细说明。~~
4 R处理大数据集
(1)R有专门用于大数据分析的包。如biglm()能以内存高效的方式实现大型数据的线性模型拟合。
(2)R与大数据平台的结合。如Rhadoop、RHive、RHipe。
R的数据集通常是由数据构成的一个矩形数组,行表示记录,列表示属性(字段)。形式可以使Excel、txt、SAS、Mysql
对数据库有兴趣的话可以看看:2019最受欢迎的数据库是? https://mp.weixin.qq.com/s/9fhPicVCjMpfMmjbhZUoFA
5 R的数据结构
话不多说,还是通过代码比较容易理解。。
(1)向量
向量中的元素可以是数字型、字符型、也可以是布尔型。但是当数组型和字符型混一起时,有没有什么说法自己动手试试吧!!
>a <- c(1,3,5,7,2,-4)

>b <- c("one","two","three")

>c <- c(TRUE,TRUE,FALSE)

>d <- c(1,3,5,"ONE")
此外,关于切片其实跟python有点类似
>d[c(1,3,4)]

>d[3]

>d[1:3]
(2)矩阵 matrix
>?matrix

>y <- matrix(5:24, nrow=4, ncol=5)

>x <- c(2,45,68,94)

>rnames <- c("R1","R2")

>cnames <- c("C1","C2")

>newMatrix <- matrix(x, nrow=2, ncol=2, byrow=TRUE, dimnames=list(rnames,cnames))

>>newMatrix <- matrix(x, nrow=2, ncol=2,dimnames=list(rnames,cnames))        #默认按列填充
>x[3,]

>x[2,3]

>x[,4]
(3)数组 array
>?array

>dim1 <- c("A1","A2", "A3")

>dim2 <- c("B1", "B2")

>dim3 <- c("C1","C2", "C3")

>d <- array(1:24, c(3,2,4), dimnames=list(dim1,dim2,dim3))

>d[1,2,3]
 #输出结果

 > d

 , , C1

    B1 B2

 A1  1  4

 A2  2  5

 A3  3  6

 , , C2

    B1 B2

 A1  7 10

 A2  8 11

 A3  9 12

 , , C3

    B1 B2

 A1 13 16

 A2 14 17

 A3 15 18

 , , C4

    B1 B2

 A1 19 22

 A2 20 23

 A3 21 24

 > d[1,2,3]

 [1] 16
(4)数据框 data.frame()
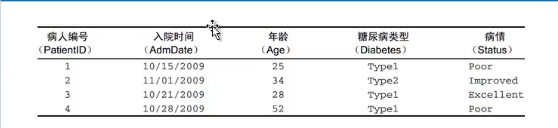
>patientID <- c(1,2,3,4)

>age <- c(25,34,28,52)

>diabetes <- c("Type1", "Type2", "Type3", "Type2")

>status <- c("poor", "Improved, "Excllent", "poor")

>patientData <- data.frame(patientID, age, diabetes, status)
> patientData

  patientID age diabetes   status

1         1  25    Type1     poor

2         2  34    Type2 Improved

3         3  28    Type3 Excllent

4         4  52    Type2     poor
>patientData[1:2]

>patientData[c("diabetes","status")]

>patientData$age
#虽然age直接输入age也能调出,但是这是因为前面创建数据帧的时候包含age。如果没有呢?
#下面举个例子

>head(mtcars)

>mtcars$mpg

>mpg

#为什么会报错呢,这个时候是因为mpg并没有关联到R中。这个时候可以用attach这个命令进行关联,解除用detach
>attach(mtcars)

>mpg

>detach(mtcars)

>mpg
#因子

> diabetes <- factor(diabetes)

> diabetes

[1] Type1 Type2 Type3 Type2

Levels: Type1 Type2 Type3
(5)列表 list
> g <- "My first list"

> h <- c(12,23,34)

> j <- c("one","two","there")

> k <- matrix(1:10, nrow=2)
> mylist <- list(g,h,j,k
> mylist

[[1]]

[1] "My first list"

[[2]]

[1] 12 23 34

[[3]]

[1] "one"   "two"   "there"

[[4]]

     [,1] [,2] [,3] [,4] [,5]

[1,]    1    3    5    7    9

[2,]    2    4    6    8   10
但是,列表的切片方式略有不同。双中括号!!!
>mylist[[2]]
6 实例演练
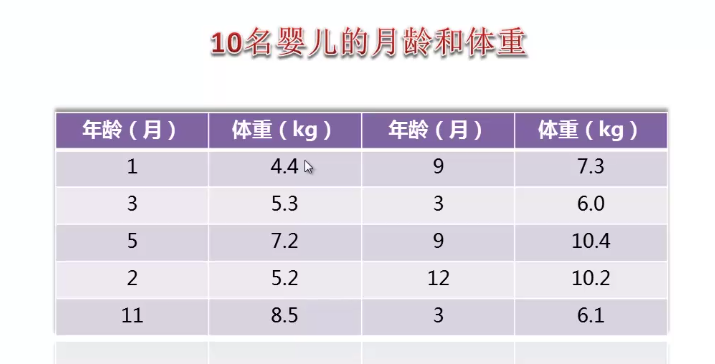
>age <- c(1,3,5,2,11,9,3,9,12,3)

>weight <- c(4.4, 5.3, 7.2, 5.2, 8.5, 7.3, 6.0, 10.4, 10.2, 6.1)

>mean(weight)        #求均值

>sd(weight)            #求方差

>cor(age, weight)    #求相关性

>plot(age,weight)
7 推荐
推荐1: 数据分析从零开始实战 | 基础篇 https://mp.weixin.qq.com/s/4ESKjlF4B63IveiIlfCdDA
推荐2:给入行数据分析的8个建议 https://mp.weixin.qq.com/s/FYQ192iwstn2J2QejDvNhA
我是尾巴~
数据分析必将大有所为!!!
D01-R语言基础学习的更多相关文章
- 从零开始系列-R语言基础学习笔记之二 数据结构(二)
在上一篇中我们一起学习了R语言的数据结构第一部分:向量.数组和矩阵,这次我们开始学习R语言的数据结构第二部分:数据框.因子和列表. 一.数据框 类似于二维数组,但不同的列可以有不同的数据类型(每一列内 ...
- 从零开始系列--R语言基础学习笔记之一 环境搭建
R是免费开源的软件,具有强大的数据处理和绘图等功能.下面是R开发环境的搭建过程. 一.点击网址 https://www.r-project.org/ ,进入"The R Project fo ...
- D02-R语言基础学习
R语言基础学习——D02 20190423内容纲要: 1.前言 2.向量操作 (1)常规操作 (2)不定长向量计算 (3)序列 (4)向量的删除与保留 3.列表详解 (1)列表的索引 (2)列表得元素 ...
- D03-R语言基础学习
R语言基础学习——D03 20190423内容纲要: 1.导入数据 (1)从键盘输入 (2)从文本文件导入 (3)从excel文件导入 2.用户自定义函数 3.R访问MySQL数据库 (1)安装R ...
- D01——C语言基础学PYTHON
C语言基础学习PYTHON——基础学习D01 20180705内容纲要: 1 PYTHON介绍 2 PYTHON变量定义规则 3 PYTHON文件结构 4 PYTHON语句及语法 5 字符编码 6 ...
- R语言基础:数组&列表&向量&矩阵&因子&数据框
R语言基础:数组和列表 数组(array) 一维数据是向量,二维数据是矩阵,数组是向量和矩阵的直接推广,是由三维或三维以上的数据构成的. 数组函数是array(),语法是:array(dadta, d ...
- D03——C语言基础学习PYTHON
C语言基础学习PYTHON——基础学习D03 20180804内容纲要: 1 函数的基本概念 2 函数的参数 3 函数的全局变量与局部变量 4 函数的返回值 5 递归函数 6 高阶函数 7 匿名函数 ...
- R语言可视化学习笔记之添加p-value和显著性标记
R语言可视化学习笔记之添加p-value和显著性标记 http://www.jianshu.com/p/b7274afff14f?from=timeline 上篇文章中提了一下如何通过ggpubr ...
- R语言基础画图/绘图/作图
R语言基础画图/绘图/作图 R语言基础画图 R语言免费且开源,其强大和自由的画图功能,深受广大学生和可视化工作人员喜爱,这篇文章对如何使用R语言作基本的图形,如直方图,点图,饼状图以及箱线图进行简单介 ...
随机推荐
- centos7 hive + 远程mysql 搭建笔记
1.require:java环境,本地可用的hadoop,远程可访问的mysql 2.拷贝hive文件(hive-2.2.1) 3.设置环境变量 export HIVE_HOME=/data/spar ...
- tomat修改启动路径
https://blog.csdn.net/axela30w/article/details/76546735
- dj forms表单组件
手动的一个个去校验前端传过来的字段数据,是很麻烦的,利用django 的forms组件,对需要校验的字段定义好,能够大大提高效率. 校验字段功能 from django.db import model ...
- 怎么让挨着的两input之间没有空隙?
问题:在写选项卡的时候,用input做点击事件的切换时,两个input之间会有空隙,使用margin/padding为0或者为负数依旧如此 → 解决:我脑慢的最后才想到是空格影响的,呵呵呵.
- Keras分类问题
#-*- coding: utf-8 -*- #使用神经网络算法预测销量高低 import pandas as pd #参数初始化 inputfile = 'data/sales_data.xls' ...
- Jersey RESTful WebService框架学习(三)使用@QueryParam
介绍:@QueryParamuri路径请求参数写在方法的参数中,获得请求路径附带的参数.比如:@QueryParam("desc") String desc 前端控制 <!D ...
- java使用filter设置跨域访问
import java.io.IOException; import javax.servlet.Filter; import javax.servlet.FilterChain; import ja ...
- Sql Server用户名和登录名的关系总结
以前经常被SQL Server中的用户名和登录名搞迷糊,因为用sa(登录名)就搞定一切东西了,当然这会存在一些安全隐患.网上的文章也貌似讲得很好,但还是不明白.今天决心把这个问题弄明白.mashall ...
- volatile 实现 单例模式
单例模式的一种实现方式,但很多人会忽略volatile关键字,因为没有该关键字,程序也可以很好的运行,只不过代码的稳定性总不是100%,说不定在未来的某个时刻,隐藏的bug就出来了. 双重校验锁 cl ...
- 配置weblogic nodemanager管理器
[内容提示]:看了一场皇族对阵OMG的比赛,失落 .皇族又输了.. 可爱的UZI... 我承认我是逗比,看了3天节点管理器才明白点东西 .笨笨 .. 废话不多说,上图!所有的故意围绕一张图开始了 ...