1.prometheus源码安装
一、prometheus安装前准备
prometheus官网:https://prometheus.io/
grafana官网:https://grafana.com/
资源下载:
# 1.资源下载

wget https://github.com/prometheus/prometheus/releases/download/v2.45.4/prometheus-2.45.4.linux-amd64.tar.gz

wget https://github.com/prometheus/alertmanager/releases/download/v0.27.0/alertmanager-0.27.0.linux-amd64.tar.gz

wget https://github.com/prometheus/node_exporter/releases/download/v1.7.0/node_exporter-1.7.0.linux-amd64.tar.gz

wget https://dl.grafana.com/enterprise/release/grafana-enterprise-10.4.2.linux-amd64.tar.gz

# 2.解压到对应目录

mkdir -p /opt/prometheus

root@os:/opt/prometheus# pwd

/opt/prometheus

root@os:/opt/prometheus# ls

alertmanager  grafana  node_exporter  prometheus

# 3.创建一个专门的prometheus用户

useradd -M -s /usr/sbin/nologin prometheus

# 4.修改目录权限

chown prometheus:prometheus -R /opt/prometheus
二、配置文件修改
2.1 创建system服务
# 1.prometheus服务启动文件
cat > /etc/systemd/system/prometheus.service << "EOF"

[Unit]

Description=Prometheus Server

Documentation=https://prometheus.io/docs/introduction/overview/

After=network-online.target

[Service]

Type=simple

User=prometheus

Group=prometheus

Restart=on-failure

ExecStart=/opt/prometheus/prometheus/prometheus \

  --config.file=/opt/prometheus/prometheus/prometheus.yml \

  --storage.tsdb.path=/opt/prometheus/prometheus/data \

  --storage.tsdb.retention.time=60d \

  --web.enable-lifecycle

[Install]

WantedBy=multi-user.target

EOF

# 详情

--config.file=/opt/prometheus/prometheus/prometheus.yml                 #主配置文件

--storage.tsdb.path=/opt/prometheus/prometheus/data                     #数据库存储目录

--web.console.libraries=/opt/prometheus/prometheus/console_libraries    #指定控制台库目录路径

--web.console.templates=/opt/prometheus/prometheus/consoles             #指定控制台模版目录路径

--storage.tsdb.retention=60d                                            #指明数据保留天数,默认15天

--web.enable-lifecycle                                                  #热加载
# 2.创建altermanager启动服务

cat >/etc/systemd/system/alertmanager.service << "EOF"

[Unit]

Description=Alert Manager

Wants=network-online.target

After=network-online.target

[Service]

Type=simple

User=prometheus

Group=prometheus

ExecStart=/opt/prometheus/alertmanager/alertmanager \

  --config.file=/opt/prometheus/alertmanager/alertmanager.yml \

  --storage.path=/opt/prometheus/alertmanager/data

Restart=always

[Install]

WantedBy=multi-user.target

EOF
# 3.创建grafana启动服务

cat >/etc/systemd/system/grafana-server.service<<"EOF"

[Unit]

Description=Grafana server

Documentation=http://docs.grafana.org

[Service]

Type=simple

User=prometheus

Group=prometheus

Restart=on-failure

ExecStart=/opt/prometheus/grafana/bin/grafana-server \

  --config=/opt/prometheus/grafana/conf/defaults.ini \

  --homepath=/opt/prometheus/grafana

[Install]

WantedBy=multi-user.target

EOF
# 4.创建node_exporter启动服务

cat > /etc/systemd/system/node_exporter.service <<"EOF"

[Unit]

Description=node_exporter

Documentation=https://prometheus.io/

After=network.target

[Service]

User=prometheus

Group=prometheus

ExecStart=/opt/prometheus/node_exporter/node_exporter

Restart=on-failure

[Install]

WantedBy=multi-user.target

EOF
2.2 修改配置文件
# altermanager启动前修改prometheus配置

vim /opt/prometheus/prometheus/prometheus.yml

alerting:

  alertmanagers:

  - static_configs:

    - targets:

      #根据实际填写alertmanager的地址

      - localhost:9093

rule_files:

  #根据实际名修改文件名

  - "alert.yml"

# 搜刮配置

scrape_configs:

  - job_name: 'alertmanager'

    scrape_interval: 15s

    static_configs:

    - targets: ['localhost:9093']

# 触发器配置文件alert.yml

cat > /opt/prometheus/prometheus/alert.yml <<"EOF"

groups:

- name: Prometheus alert

  rules:

  # 对任何实例超过30秒无法联系的情况发出警报

  - alert: 服务告警

    expr: up == 0

    for: 30s

    labels:

      severity: critical

    annotations:

      summary: "服务异常,实例:{{ $labels.instance }}"

      description: "{{ $labels.job }} 服务已关闭"

EOF
# node_exporter服务

cat >> /opt/prometheus/prometheus/prometheus.yml <<"EOF"

# 再scrape_configs这行下面添加如下配置:

  #node-exporter配置

  - job_name: 'node-exporter'

    scrape_interval: 15s

    static_configs:

    - targets: ['localhost:9100']

      labels:

        instance: Prometheus服务器

EOF
2.3 启动服务
# 启动服务
systemctl daemon-reload
systemctl start prometheus.service
systemctl enable prometheus.service
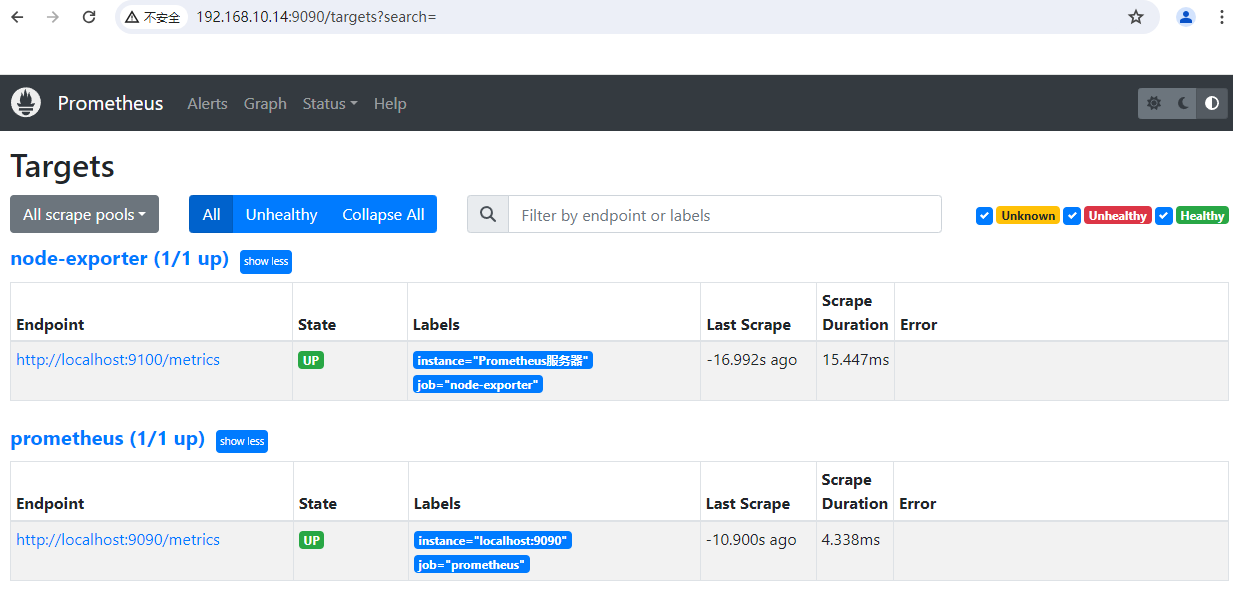
访问测试地址:
http://192.168.10.14:9090/
监控指标:http://192.168.10.14:9090/metrics
systemctl start alertmanager.service
systemctl enable alertmanager.service
访问测试地址:http://192.168.10.14:9093/
systemctl start grafana-server.service
systemctl enable grafana-server.service
web访问地址:http://192.168.10.14:3000/
systemctl start node_exporter.service
systemctl enable node_exporter.service
web访问地址:http://192.168.10.14:9100/metrics # 查看命令
systemctl status 服务名
# prometheus配置文件如果有修改,请用重载或重启服务命令
重载:curl -X POST http://localhost:9090/-/reload
三、使用grafana展示prometheus
3.1 登录grafana
http://192.168.10.14:3000/login
默认用户名密码:admin/admin
3.2 创建prometheus数据源
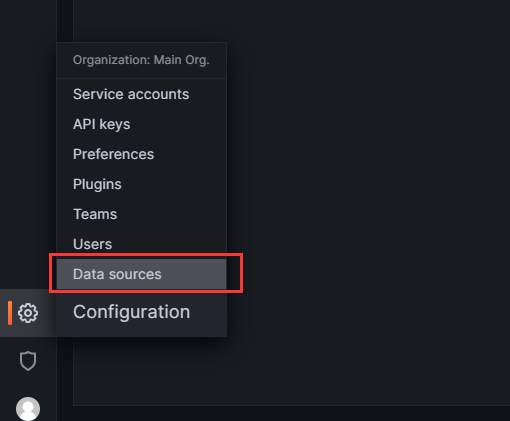
在 Grafana 中创建 Prometheus 数据源:
- 单击边栏中的“齿轮”,打开“配置”菜单。
- 单击“数据源”。
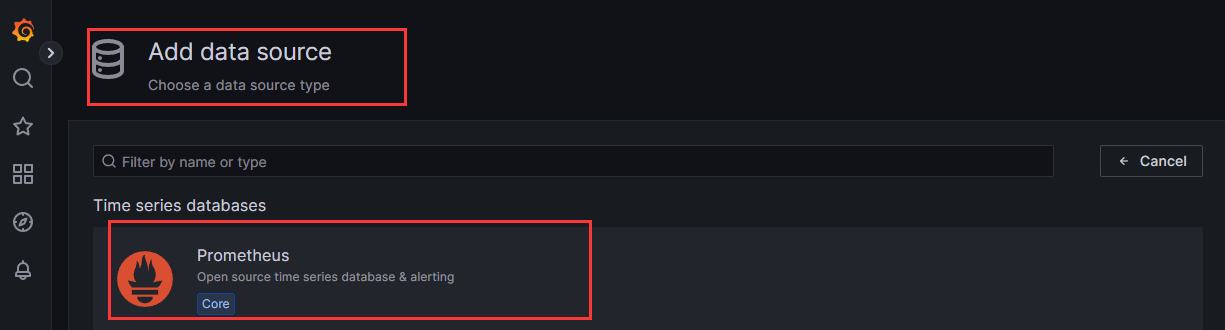
- 单击“添加数据源”。
- 选择“Prometheus”作为类型。
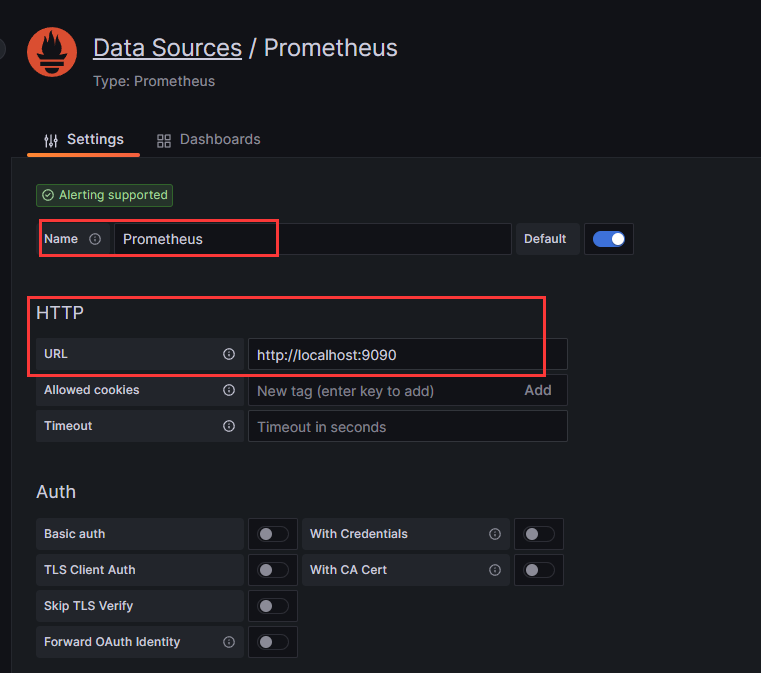
- 设置适当的 Prometheus 服务器 URL(例如,
http://localhost:9090)
- 单击“保存并测试”以保存新的数据源。
url填入:http://localhost:9090 注:localhost表示本机,然后保存save&test
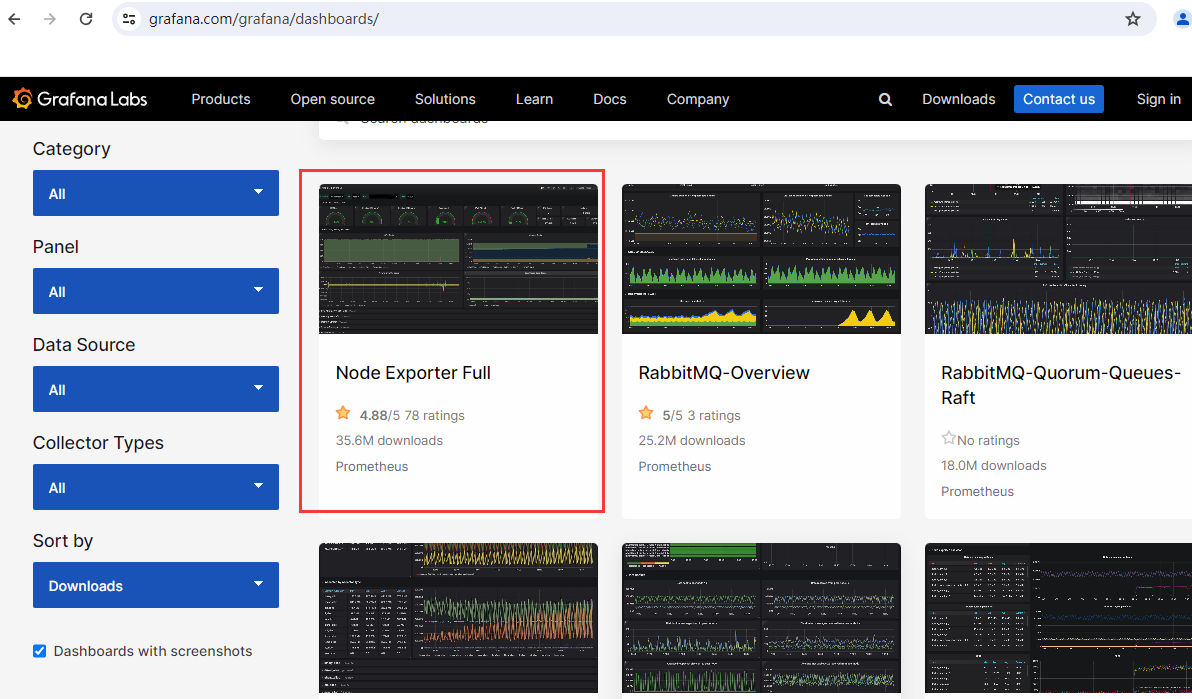
3.3 创建仪表盘:从grafana导入仪表盘
https://grafana.com/grafana/dashboards/
打开grafana的dashboards官网,在搜索栏输入node exporter回车,点击下载量大的dashboards如下图:
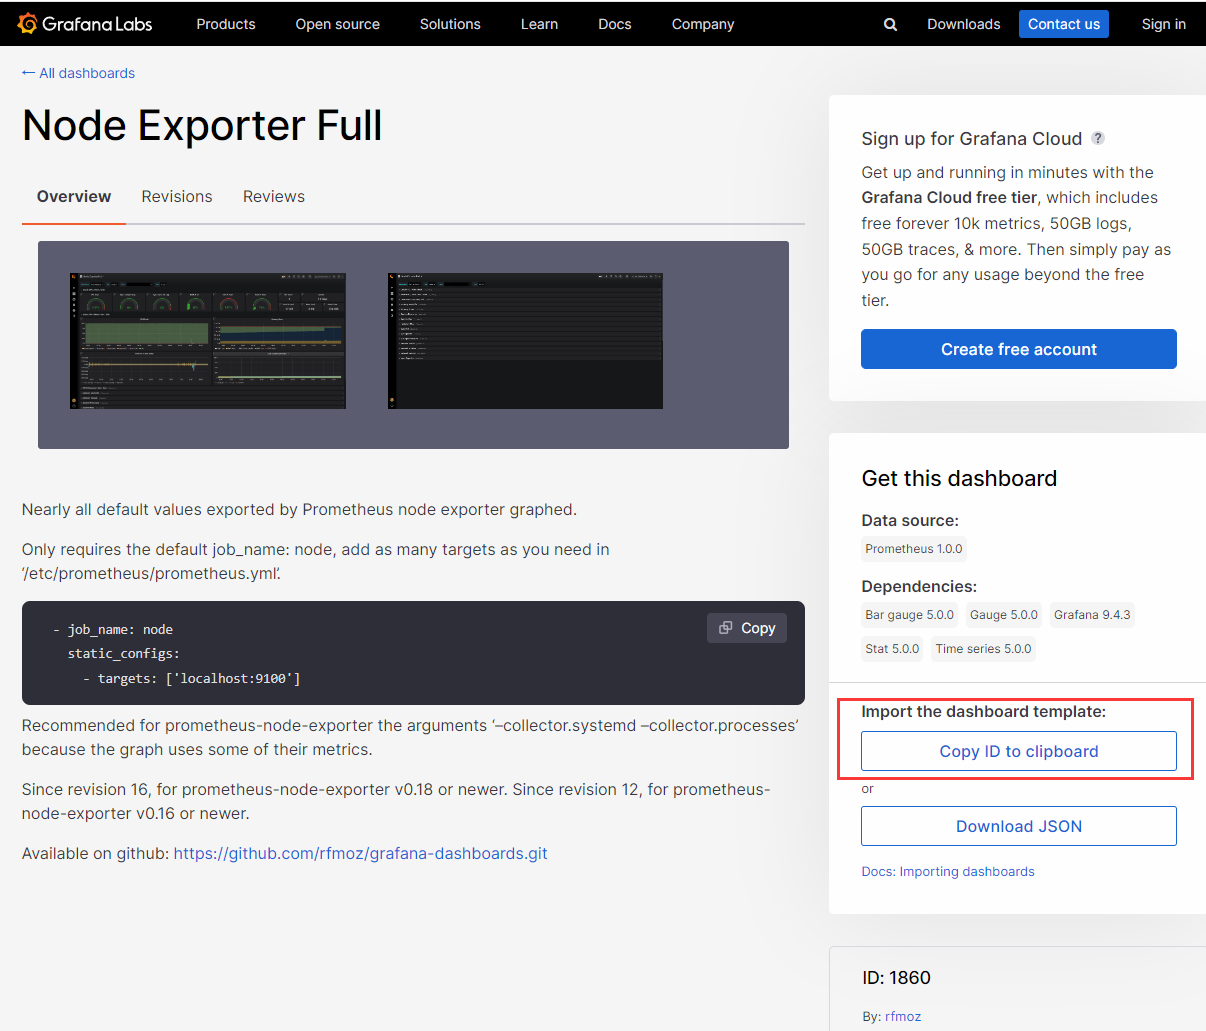
拷贝id
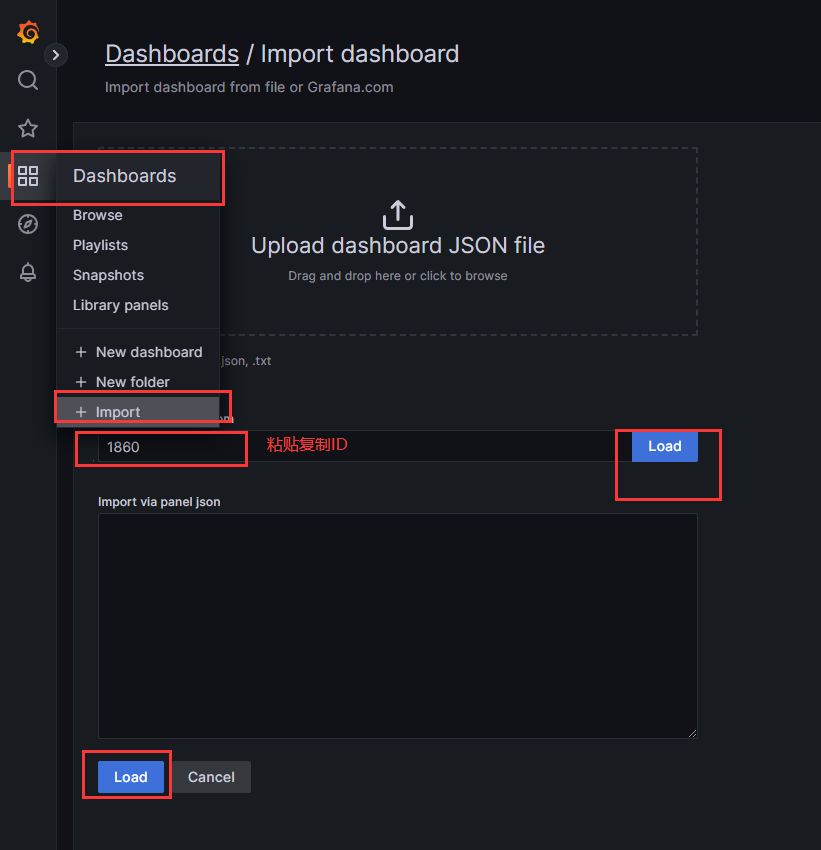
打开grafana web控制台--点击dashbord图标--在点import导入--粘贴之前复制的id--在点load加载
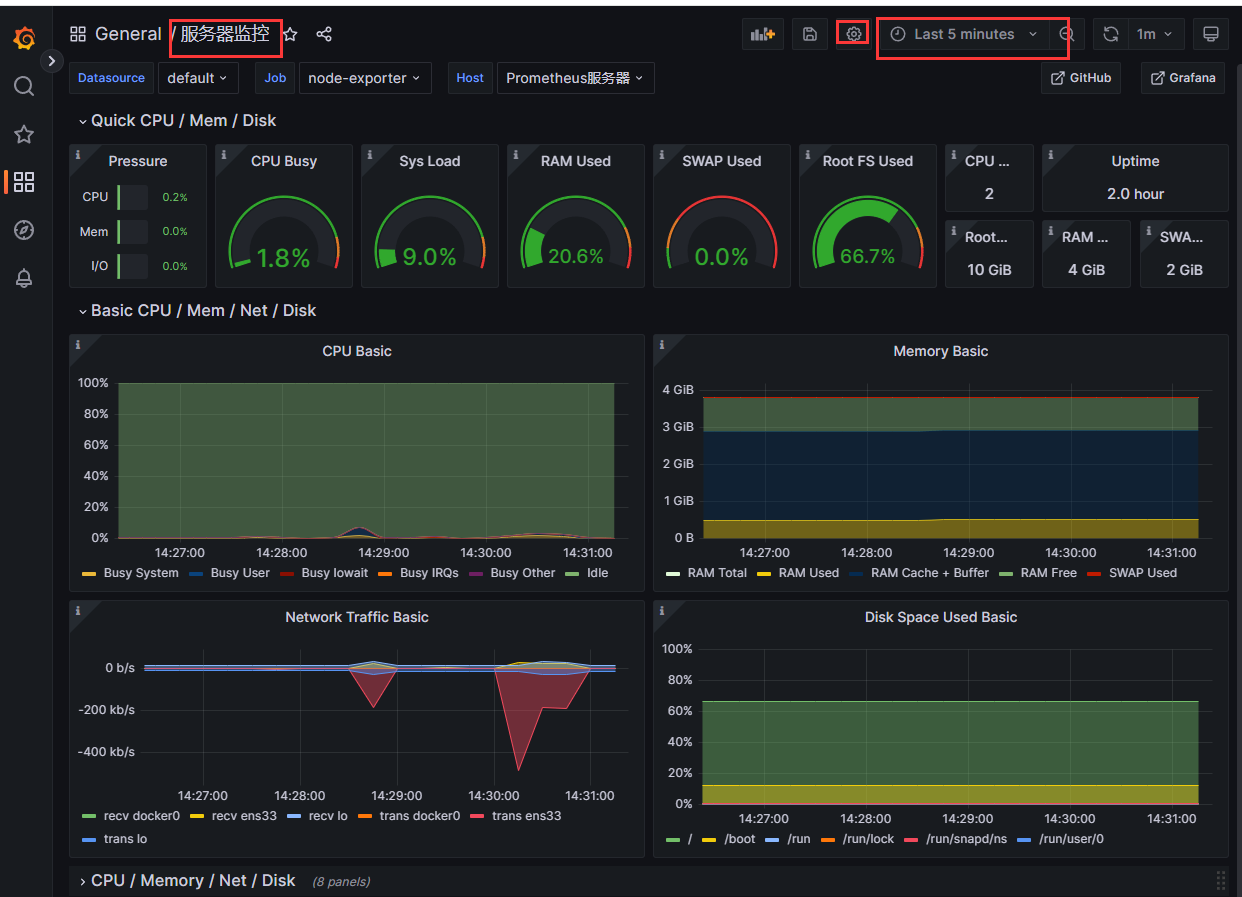
name填写“服务器监控”(根据实际修改),选择“prometheus”--在点import导入
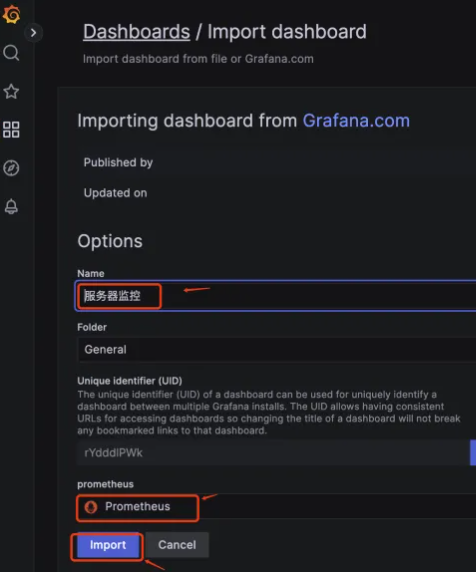
导入dashboard完成后,查看:
1.prometheus源码安装的更多相关文章
- mono-3.4.0 源码安装时出现的问题 [do-install] Error 2 [install-pcl-targets] Error 1 解决方法
Mono 3.4修复了很多bug,继续加强稳定性和性能(其实Mono 3.2.8 已经很稳定,性能也很好了),但是从http://download.mono-project.com/sources/m ...
- 搭建LNAMP环境(七)- PHP7源码安装Memcached和Memcache拓展
上一篇:搭建LNAMP环境(六)- PHP7源码安装MongoDB和MongoDB拓展 一.安装Memcached 1.yum安装libevent事件触发管理器 yum -y install libe ...
- 搭建LNAMP环境(二)- 源码安装Nginx1.10
上一篇:搭建LNAMP环境(一)- 源码安装MySQL5.6 1.yum安装编译nginx需要的包 yum -y install pcre pcre-devel zlib zlib-devel ope ...
- 搭建LNAMP环境(一)- 源码安装MySQL5.6
1.yum安装编译mysql需要的包 yum -y install gcc-c++ make cmake bison-devel ncurses-devel perl 2.为mysql创建一个新的用户 ...
- Greenplum 源码安装教程 —— 以 CentOS 平台为例
Greenplum 源码安装教程 作者:Arthur_Qin 禾众 Greenplum 主体以及orca ( 新一代优化器 ) 的代码以可以从 Github 上下载.如果不打算查看代码,想下载编译好的 ...
- salt源码安装软件和yum安装软件
上面简单列出了源码安装的sls文件书写思路. 涉及到一些固定的思路:如, 1,拷贝 解压安装时候需要依赖tar.gz存在 如果已安装则无需再次安装. 2,启动脚本 加入chk时候需要文件存在,如果已添 ...
- 搭建LNAMP环境(六)- PHP7源码安装MongoDB和MongoDB拓展
上一篇:搭建LNAMP环境(五)- PHP7源码安装Redis和Redis拓展 一.安装MongoDB 1.创建mongodb用户组和用户 groupadd mongodb useradd -r -g ...
- 搭建LNAMP环境(三)- 源码安装Apache2.4
上一篇:搭建LNAMP环境(二)- 源码安装Nginx1.10 1.yum安装编译apache需要的包(如果已经安装,可跳过此步骤) yum -y install pcre pcre-devel zl ...
- Linux MySQL源码安装缺少ncurses-devel包
在Red Hat Enterprise Linux Server release 5.7 上用源码安装MySQL-5.6.23时,遇到了" remove CMakeCache.txt and ...
- centos 6x系统下源码安装mysql操作记录
在运维工作中经常部署各种运维环境,涉及mysql数据库的安装也是时常需要的.mysql数据库安装可以选择yum在线安装,但是这种安装的mysql一般是系统自带的,版本方面可能跟需求不太匹配.可以通过源 ...
随机推荐
- Kingbase ES 游标跨事务及其案例一则
前言 本文介绍游标在PLSQL和SQL层跨事务使用案例,及其案例一则. 本文验证版本: db0=# select version(); db0-# / version ---------------- ...
- 浅谈 KingbaseES 和 SQLServer 中的 instead of 触发器
本文基于Kingbase和SqlServer的INSTEAD OF 触发器主要功能特点进行对比浅析,同时针对SqlServer 的INSTEAD OF 触发器提出了多种kingbase环境的等价代码方 ...
- KingabseES例程之巧用QueryMapping解决查询硬解析问题
什么是QueryMapping KingbaseES Query Mapping 是一种查询映射功能.有过SQL优化经历的人都知道,对于有些SQL性能问题,可能需要涉及到SQL层面的修改,这不仅麻烦, ...
- Windows线程API —CreateTimerQueueTimer/DeleteTimerQueueTimer的使用
问题代码: 1 #include<windows.h> 2 #include<iostream> 3 #include<thread> 4 HANDLE h1; 5 ...
- Spring---AoP(面向切面编程)原理学习笔记【全】
1.AOP 1.1.什么是AOP AOP(Aspect Oriented Programming)意为:面向切面编程,通过预编译方式和运行期动态代理实现程序功能的统一维护的一种技术.AOP是OOP的延 ...
- #线性dp#洛谷 5999 [CEOI2016]kangaroo
题目 问有多少个长度为 \(n\) 的排列满足首项为 \(st\),末项为 \(ed\), 并且 \(\forall i\in (1,n),\left[a_{i-1}<a_i \oplus a_ ...
- #dp#洛谷 6855 「EZEC-4.5」走方格
题目 分析 考虑每个格子\((i,j)\)获得的得分即为经过这个格子与不经过这个格子的答案 预处理出起点到每个点的最小得分和每个点到终点的最小得分, 那么经过这个格子的答案很好求,问题是不经过这个格子 ...
- Spring Boot 2.X系列教程:七天从无到有掌握Spring Boot-持续更新
目录 简介 Spring Boot的基本操作 Spring Boot的构建和部署 Spring Boot工具 Spring Boot的测试 Spring Boot中使用JPA Spring Boot和 ...
- 陈海波:OpenHarmony技术领先,产学研深度协同,生态蓬勃发展
11月4日,以"技术筑生态,智联赢未来"为主题的第二届OpenHarmony技术大会在北京隆重举办.本次大会由OpenAtom OpenHarmony(简称"Open ...
- OpenHarmony创新赛|赋能直播第四期
开放原子开源大赛OpenHarmony创新赛进入了中期评审环节,为了解决开发者痛点,本期以三方库移植.MQTT移植案例.开发工具介绍的3节系列技术课程,帮助开发者提升开发效率,为作品的创新能力奠定坚 ...