Bar 3D 和Pie 3D的统计图形
最近在做一个关于图形统计的界面,主要用到的是Dev控件ChartControl(功能很强大,能解决基本和复杂图形统计问题)。
ChartControl主要有Diagram、Series、Legend三个重要属性
diagram主要是用来控制图形X、Y、Z轴显示的样式和是否允许旋转以及旋转的角度和绕那个轴旋转。
series主要是用来给chartcontrol控件增加各种图形,图形的种类用viewtype来控制。
legend主要是用来说明图形的分类(可以说是图例)。
第一部分是以饼状图来分类显示各种情况所占的百分比:例如最近一段时间水果占销售总量的百分比是多少等等。
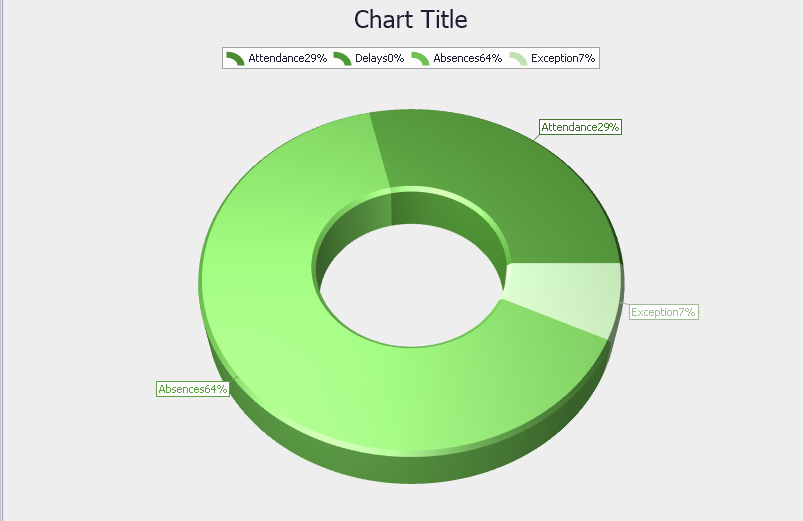
代码主要是先实例化chartcontrol,再对chartcontrol进行属性赋值最后进行绑定数据,代码如下:
 ChartControl staticsChart = new ChartControl();//create the chart control

        Series series1 = null;

        Series series2 = null;

        Series series3 = null;

        Series series4 = null;

/// <summary>

        /// config the format for doughnut3D

        /// </summary>

        private void AddDoughnut3D()

        {

            series1= new Series("Doughnut Sereis 1", ViewType.Doughnut3D);//add series1

            ChangeTheDouguntData();

            staticsChart.Series.Add(series1);

            series1.Label.TextPattern = "{A}{VP:0%}";

            ((Doughnut3DSeriesView)series1.View).HoleRadiusPercent=;

            //((Doughnut3DSeriesView)series1.View).ExplodedPoints.Add(series1.Points[0]);export diagram

            ((SimpleDiagram3D)staticsChart.Diagram).RotationType = RotationType.UseAngles;

            ((SimpleDiagram3D)staticsChart.Diagram).RotationAngleX = -;

            SetChartFormat();

        }

  private void SetChartFormat()

        {

            staticsChart.CrosshairOptions.ShowArgumentLabels = true;

            staticsChart.CrosshairOptions.ShowArgumentLine = true;

            staticsChart.CrosshairOptions.ShowCrosshairLabels = true;

            staticsChart.BackColor = Color.Transparent;

            staticsChart.PaletteBaseColorNumber = ;

            staticsChart.PaletteName = "Green";

            staticsChart.Titles.Clear();

            ChartTitle chartTitle1 = new ChartTitle();

            staticsChart.Text = "Data Graphics";

            staticsChart.Titles.Add(chartTitle1);

            staticsChart.Legend.UseCheckBoxes = false;

            staticsChart.Legend.Direction = LegendDirection.LeftToRight;

            staticsChart.Legend.AlignmentHorizontal = LegendAlignmentHorizontal.Center;

            staticsChart.Dock = DockStyle.Fill;

            this.pnlAddDiagram.Controls.Add(staticsChart);

        }

 private void ChangeTheDouguntData()

        {

            DataTable diagramData = GetAllEmployeeDaySummary();

            int attendanceNumber = ;

            int delaysNumber = ;

            int absencesNumber = ;

            int exceptionNumber = ;

            if (diagramData.Rows.Count > )

            {

                attendanceNumber = diagramData.Select("pc_code=2" + " and pc_results>0").Length;

                delaysNumber = diagramData.Select("pc_code=6" + " and pc_results>0").Length;

                absencesNumber = diagramData.Select("pc_code=8" + " and pc_results>0").Length;

                exceptionNumber = diagramData.Select("pc_code in(11,12) " + " and pc_results>0").Length;

            }

            series1.Points.AddRange(new SeriesPoint[]{

            new SeriesPoint("Attendance",attendanceNumber),

            new SeriesPoint("Delays",delaysNumber),

            new SeriesPoint("Absences",absencesNumber),

            new SeriesPoint("Exception",exceptionNumber)});

        }
第二部分是柱状图,思路和饼状图差不多,series设置的不一样。

实现代码:
  private void AddBar3DChart()

         {

             series1 = new Series("Attendance", ViewType.Bar3D);

             series2 = new Series("Delays", ViewType.Bar3D);

             series3 = new Series("Absences", ViewType.Bar3D);

             series4 = new Series("Exception", ViewType.Bar3D);

             if (cmbType.SelectedIndex == )

             {

                 ChangeEmployeeBarData();

             }

             else if (cmbType.SelectedIndex == )

             {

                 ChangeDepartmentBarData();

             }

             staticsChart.Series.AddRange(new Series[] { series1, series2, series3, series4 });

             //series1.Label.ResolveOverlappingMode = ResolveOverlappingMode.Default;

             #region set the series view's value

             Bar3DSeriesView myView1 = (Bar3DSeriesView)series1.View;

             myView1.BarDepthAuto = false;

             myView1.BarDepth = 0.2;

             myView1.BarWidth = 0.5;

             Bar3DSeriesView myView2 = (Bar3DSeriesView)series2.View;

             myView2.BarDepthAuto = false;

             myView2.BarDepth = 0.2;

             myView2.BarWidth = 0.5;

             Bar3DSeriesView myView3 = (Bar3DSeriesView)series3.View;

             myView3.BarDepthAuto = false;

             myView3.BarDepth = 0.2;

             myView3.BarWidth = 0.5;

             Bar3DSeriesView myView4 = (Bar3DSeriesView)series4.View;

             myView4.BarDepthAuto = false;

             myView4.BarDepth = 0.2;

             myView4.BarWidth = 0.5;

             #endregion

             XYDiagram3D myDiagram = (XYDiagram3D)staticsChart.Diagram;

             myDiagram.RotationType = RotationType.UseAngles;

             myDiagram.RotationOrder = RotationOrder.XYZ;

             myDiagram.RotationAngleX = ;

             myDiagram.RotationAngleY = ;

             myDiagram.RotationAngleZ = ;

             myDiagram.RuntimeScrolling = true;

             SetChartFormat();

         }

 private void ChangeDepartmentBarData()

         {

             List<Employee> empList = treeModule.CheckedEmps;

             List<Department> depList = treeModule.CheckedDepartment;

             DateTime fromDate = dteFromDate.DateTime;

             DateTime endDate = dteEndDate.DateTime;

             List<DaySummary> dsList = new DaySummaryBLL().GetEmployeesDailySummary(empList, fromDate, endDate);

             List<Paycode> paycodeList = new PaycodeBLL().GetMainFields();

             var dsPaycodeList = from ds in dsList

                                 join p in paycodeList on ds.paycode.id equals p.id

                                 where ds.pc_results >

                                 orderby ds.employee.id ascending, ds.att_date descending

                                 select new { ID = ds.employee.id, Minutes = ds.pc_results, Date = ds.att_date, Paycode = p.pc_code };

             foreach (Department dep in depList)

             {

                 int attendanceDay = ;

                 int delaysDay = ;

                 int absencesDay = ;

                 int ExceptionDay = ;

                 List<Employee> depEmpList = new EmployeeBLL().GetMainFields(string.Format("where e.department.id={0}", dep.id));

                 foreach (Employee employee in depEmpList)

                 {

                     attendanceDay += dsPaycodeList.Count(dspaycode => dspaycode.ID == employee.id && dspaycode.Paycode == );

                     delaysDay += dsPaycodeList.Count(dspaycode => dspaycode.ID == employee.id && dspaycode.Paycode == );

                     absencesDay += dsPaycodeList.Count(dspaycode => dspaycode.ID == employee.id && dspaycode.Paycode == );

                     ExceptionDay += dsPaycodeList.Count(dspaycode => dspaycode.ID == employee.id && dspaycode.Paycode == ) +

                         dsPaycodeList.Count(dspaycode => dspaycode.ID == employee.id && dspaycode.Paycode == );

                 }

                 series1.Points.Add(new SeriesPoint(dep.dept_name.ToString(), attendanceDay));

                 series2.Points.Add(new SeriesPoint(dep.dept_name.ToString(), delaysDay));

                 series3.Points.Add(new SeriesPoint(dep.dept_name.ToString(), absencesDay));

                 series4.Points.Add(new SeriesPoint(dep.dept_name.ToString(), ExceptionDay));

             }

         }
以上主要是提供一个思路怎么来解决这种图形统计类问题,以及怎么进行数据绑定,如有不对的地方请指出。
Bar 3D 和Pie 3D的统计图形的更多相关文章
- 4-Highcharts 3D图之3D普通饼图
<!DOCTYPE> <html lang='en'> <head> <title>4-Highcharts 3D图之3D普通饼图</title& ...
- 物联网3D,物业基础设施3D运维,使用webgl(three.js)与物联网设备结合案例。搭建智慧楼宇,智慧园区,3D园区、3D物业设施,3D楼宇管理系统——第八课
写在前面的废话: 很久没有更新文章了,这段时间一直忙于项目落地,虽然很忙,但是感觉没有总结,没有提炼的日子,总是让人感觉飘飘忽忽的. 所幸放下一些事,抽出一些时间,把近期的项目做一些整理与记录.也算是 ...
- Python制作统计图形
转载自:http://www.dcharm.com/?p=15 Python一般使用Matplotlib制作统计图形,用它自己的说法是‘让简单的事情简单,让复杂的事情变得可能’.(你说国外的“码农”咋 ...
- 3-Highcharts 3D图之3D柱状图分组叠堆3D图
<!DOCTYPE> <html lang='en'> <head> <title>3-Highcharts 3D图之3D柱状图分组叠堆3D图</ ...
- 2-Highcharts 3D图之3D柱状图带可调试倾斜角度
<!DOCTYPE> <html lang='en'> <head> <title>2-Highcharts 3D图之3D柱状图带可调试倾斜角度< ...
- 3D Analyst Tools(3D Analyst 工具)
3D Analyst 工具 工具里有又细分如下分类: 注:以下代码的参数需要另行配置,不能直接执行:Python2不支持中文变量! 1.3D 要素 # Process: 3D 内部 arcpy.Ins ...
- 如何用webgl(three.js)搭建一个3D库房,3D密集架,3D档案室(升级版)
很长一段时间没有写3D库房,3D密集架相关的效果文章了,刚好最近有相关项目落地,索性总结一下 与之前我写的3D库房密集架文章<如何用webgl(three.js)搭建一个3D库房,3D密集架,3 ...
- webgl(three.js)3D光伏,3D太阳能能源,3D智慧光伏、光伏发电、清洁能源三维可视化解决方案——第十六课
序: 能源是文明和发展的重要保障,人类命运不可避开的话题,无论是战争还是发展,都有它存在的身影.从石器时代到现代文明,人类的能源应用在进步,也在面临能源枯竭的危机与恐惧,而开发与应用可再生能源才是解决 ...
- 如何使用webgl(three.js)实现3D储能,3D储能站,3D智慧储能、储能柜的三维可视化解决方案——第十七课
前言 上节课我们讲了<3D光伏发电>,与之配套的就是能量存储 这节课我们主要讲讲储能,储能站,在分布式能源系统中起到调节用对电的尖峰平谷进行削峰填谷的作用.特别是小型储能站,更加灵活,因地 ...
随机推荐
- noi 1.8 11图像旋转
水题不解释 其实我偷懒了 直接输出,,,,,,, 个人QQ:757394026团队QQ:466373640个人博客:www.doubleq.winc++/noi/信息学奥数博客:http://www. ...
- php投票练习
一.题目要求:建立如下两个数据库,实现投票和%的统计结果: 二.具体编写方法: (1).建立数据库: 里面的蓝色背景的表格名称就是我们所需的表格! 表格内容如下: 表名:diaoyantimu 表名: ...
- 《经久不衰的Spring框架:Spring+SpringMVC+MyBatis 整合》
前言 主角即Spring.SpringMVC.MyBatis,即所谓的SSM框架,大家应该也都有所了解,概念性的东西就不写了,有万能的百度.之前没有记录SSM整合的过程,这次刚刚好基于自己的一个小项目 ...
- 数据存储与访问之——初见SQLite数据库
本节引言: 本节学习Android数据库存储与访问的第三种方式:SQLite数据库,和其他的SQL数据库不同,我们并不需要在手机上另外安装一个数据库手机软件,Android系统已经集成了这 ...
- 数据的增删改查(三层)<!--待补充-->
进行数据操作必然少了对数据的增删改查,用代码生成器生成的代码不是那么满意!方便在今后使用,这里就主要写“数据访问层(Dal)” 既然这里提到三层架构:有必要将三层内容在这里详细介绍一下(待补充) 注: ...
- 普实软件:MES机器数据维护
概述 机器数据有两个菜单,机器主数据在制造数据模块下,机器MES数据相关的设置在MES模块下,两个菜单查看的内容是一致的,但是机器主数据显示的是普通的机器,可做新增.编辑.删除操作,机器MES数据仅做 ...
- 你知道自己执行的是哪个jre吗?
多个JRE 我在做<Java日志工具之java.util.logging.Logger>的DEMO时,修改java.util.logging.Logger的配置文件,怎么修改都不起作用,因 ...
- C语言学习心得
最近学习了C语言,打脑壳,很多东西不会用,没有概念,单点知识都懂,组合起来就不知道怎么弄了.慢慢来吧
- UVa1587 盒子
前言 第一次刷题,ac的感觉真的很棒! 题目 题目 大意是说,输入6个面,判断是否是个长方体. 思路 根据长方体的特质来判断,比如说6个面中3个面是相互对应的,只有3条不同的边等等. 我就知道我肯定会 ...
- mongoDB & Nodejs 访问mongoDB (二)
非常详细的文档http://mongodb.github.io/node-mongodb-native/2.2/quick-start/quick-start/ 连接数据库 安装express 和 m ...