
横截面数据分类——基于R
参考资料:
《复杂数据统计方法》&网络&帮助文件
适用情况:在因变量为分类变量而自变量含有多个分类变量或分类变量水平较多的情况。
一.
(一)概论和例子
数据来源:http://archive.ics.uci.edu/ml/datasets/Cardiotocography
自变量:LB - FHR baseline (beats per minute)
AC - # of accelerations per second
FM - # of fetal movements per second
UC - # of uterine contractions per second
DL - # of light decelerations per second
DS - # of severe decelerations per second
DP - # of prolongued decelerations per second
ASTV - percentage of time with abnormal short term variability
MSTV - mean value of short term variability
ALTV - percentage of time with abnormal long term variability
MLTV - mean value of long term variability
Width - width of FHR histogram
Min - minimum of FHR histogram
Max - Maximum of FHR histogram
Nmax - # of histogram peaks
Nzeros - # of histogram zeros
Mode - histogram mode
Mean - histogram mean
Median - histogram median
Variance - histogram variance
Tendency - histogram tendency
CLASS - FHR pattern class code (1 to 10)
因变量:
NSP - fetal state class code (N=normal; S=suspect; P=pathologic)
(二)产生交叉验证数据集
1.十折交叉验证 概念(百度百科)
英文名叫做10-fold cross-validation,用来测试算法准确性。是常用的测试方法。将数据集分成十分,轮流将其中9份作为训练数据,1份作为测试数据,进行试验。每次试验都会得出相应的正确率(或差错率)。10次的结果的正确率(或差错率)的平均值作为对算法精度的估计,一般还需要进行多次10折交叉验证(例如10次10折交叉验证),再求其均值,作为对算法准确性的估计。
之所以选择将数据集分为10份,是因为通过利用大量数据集、使用不同学习技术进行的大量试验,表明10折是获得最好误差估计的恰当选择,而且也有一些理论根据可以证明这一点。但这并非最终诊断,争议仍然存在。而且似乎5折或者20折与10折所得出的结果也相差无几。
Fold=function(Z=,w,D,seed=){

n=nrow(w)

d=:n

dd=list()

e=levels(w[,D])

T=length(e)

set.seed(seed)

for(i in :T){

d0=d[w[,D]==e[i]]

j=length(d0)

ZT=rep(:Z,ceiling(j/Z))[:j]

id=cbind(sample(ZT,length(ZT)),d0)

dd[[i]]=id}

mm=list()

for(i in :Z){u=NULL;

for(j in :T)u=c(u,dd[[j]][dd[[j]][,]==i,])

mm[[i]]=u}

return(mm)}
#读入数据

w=read.csv("CTG.NAOMIT.csv")

#因子化最后三个哑元变量

F=: #三个分类变量的列数

for(i in F)

w[,i]=factor(w[,i])

D= #因变量的位置

Z= #折数

n=nrow(w)#行数

mm=Fold(Z,w,D,)
二.决策树分类(分类树)
library(rpart.plot)

(a=rpart(NSP~.,w))#用决策树你和全部数据并打印输出

rpart.plot(a,type=,extra=)
rpart.plot参数解释:
x :
An rpart object. The only required argument.
type:
Type of plot. Five possibilities:
0 The default. Draw a split label at each split and a node label at each leaf.
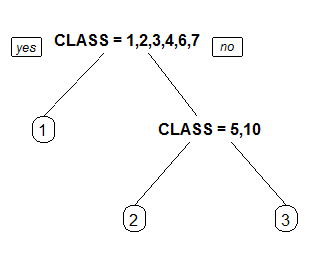
1 Label all nodes, not just leaves. Similar to text.rpart's all=TRUE.

2 Like 1 but draw the split labels below the node labels. Similar to the plots in the CART book.
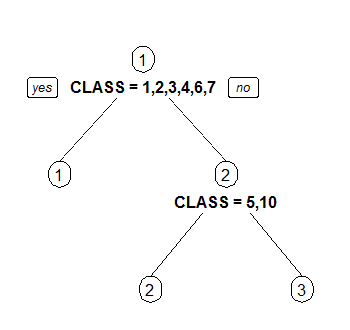
3 Draw separate split labels for the left and right directions.
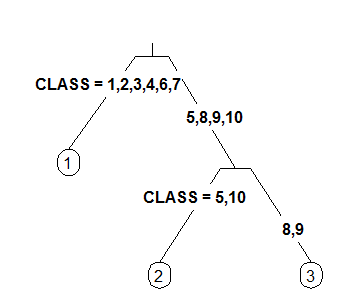
4 Like 3 but label all nodes, not just leaves. Similar to text.rpart's fancy=TRUE. See also clip.right.labs.
extra :
Display extra information at the nodes. Possible values:
0 No extra information (the default).
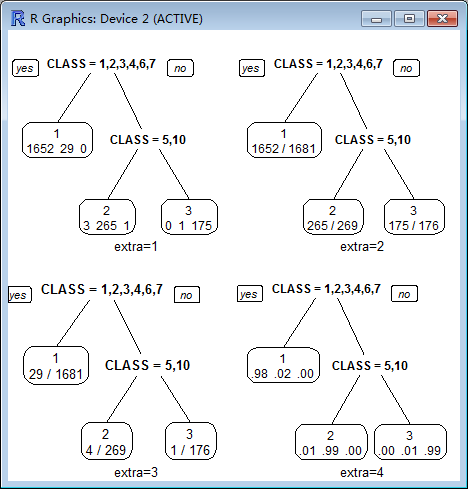
1 Display the number of observations that fall in the node (per class for class objects; prefixed by the number of events for poisson and exp models). Similar to text.rpart's use.n=TRUE.
2 Class models: display the classification rate at the node, expressed as the number of correct classifications and the number of observations in the node. Poisson and exp models: display the number of events.
3 Class models: misclassification rate at the node, expressed as the number of incorrect classifications and the number of observations in the node.
4 Class models: probability per class of observations in the node (conditioned on the node, sum across a node is 1).
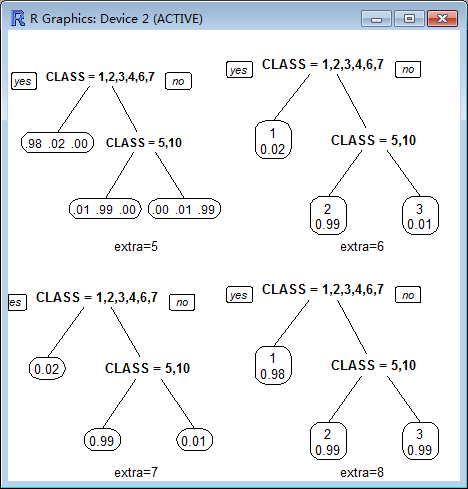
5 Class models: like 4 but do not display the fitted class.
6 Class models: the probability of the second class only. Useful for binary responses.
7 Class models: like 6 but do not display the fitted class.
8 Class models: the probability of the fitted class.
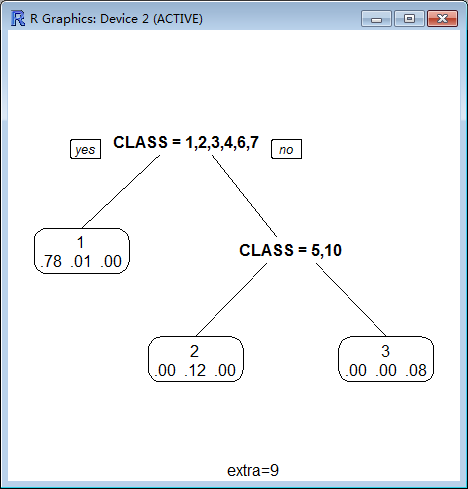
9 Class models: the probabilities times the fraction of observations in the node (the probability relative to all observations, sum across all leaves is 1).
branch:
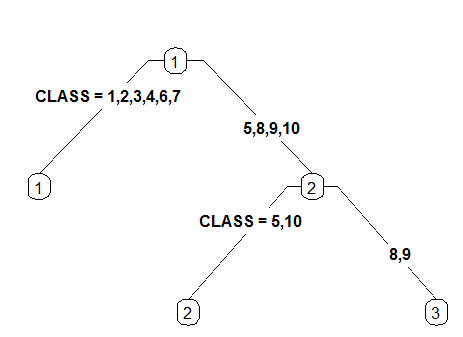
Controls the shape of the branch lines. Specify a value between 0 (V shaped branches) and 1 (square shouldered branches). Default is if(fallen.leaves) 1 else .2.

branch=0
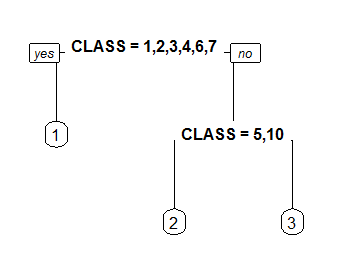
branch=1
digits :
The number of significant digits in displayed numbers. Default 2.
rpart.plot(a,extra=,digits=)

横截面数据分类——基于R的更多相关文章
- 统计学习导论:基于R应用——第二章习题
目前在看统计学习导论:基于R应用,觉得这本书非常适合入门,打算把课后习题全部做一遍,记录在此博客中. 第二章习题 1. (a) 当样本量n非常大,预测变量数p很小时,这样容易欠拟合,所以一个光滑度更高 ...
- 基于R树索引的点面关系判断以及效率优化统计
文章版权由作者李晓晖和博客园共有,若转载请于明显处标明出处:http://www.cnblogs.com/naaoveGIS/ 1.背景 在之前的博客中,我分别介绍了基于网格的空间索引(http:// ...
- 概率图模型 基于R语言 这本书中的第一个R语言程序
概率图模型 基于R语言 这本书中的第一个R语言程序 prior <- c(working =0.99,broken =0.01) likelihood <- rbind(working = ...
- 基于R语言的时间序列指数模型
时间序列: (或称动态数列)是指将同一统计指标的数值按其发生的时间先后顺序排列而成的数列.时间序列分析的主要目的是根据已有的历史数据对未来进行预测.(百度百科) 主要考虑的因素: 1.长期趋势(Lon ...
- 基于R语言的ARIMA模型
A IMA模型是一种著名的时间序列预测方法,主要是指将非平稳时间序列转化为平稳时间序列,然后将因变量仅对它的滞后值以及随机误差项的现值和滞后值进行回归所建立的模型.ARIMA模型根据原序列是否平稳以及 ...
- Twitter基于R语言的时序数据突变检测(BreakoutDetection)
Twitter开源的时序数据突变检测(BreakoutDetection),基于无参的E-Divisive with Medians (EDM)算法,比传统的E-Divisive算法快3.5倍以上,并 ...
- (数据科学学习手札10)系统聚类实战(基于R)
上一篇我们较为系统地介绍了Python与R在系统聚类上的方法和不同,明白人都能看出来用R进行系统聚类比Python要方便不少,但是光介绍方法是没用的,要经过实战来强化学习的过程,本文就基于R对2016 ...
- 递归函数之阶乘和字符串反转-基于R和Python
Python课第五周开始讲函数了.递归函数.递归在python中不能超过900多层,否则报错内存溢出什么的.同样在R中递归太深也会报错,阈值和python中大概一样,900多次就报错了. error ...
- R学习:《机器学习与数据科学基于R的统计学习方法》中文PDF+代码
当前,机器学习和数据科学都是很重要和热门的相关学科,需要深入地研究学习才能精通. <机器学习与数据科学基于R的统计学习方法>试图指导读者掌握如何完成涉及机器学习的数据科学项目.为数据科学家 ...
随机推荐
- ES6的转换器
---恢复内容开始--- ES6代码转为ES5代码的转换器 1.Babel 2.Traceur,Google公司出品 Babel是一个广泛使用的ES6转码器,可以将ES6代码转为ES5代码,从而在现有 ...
- (转载)Bonding技术指南
原文链接:http://www.wushiqin.com/?post=68 一.什么是网卡绑定及简单原理 网卡绑定也称作"网卡捆绑",就是使用多块物理网卡虚拟成为一块网卡,以提供负 ...
- voa 2015 / 4 / 27
As reports of the death toll rise in Nepal, countries and relief organizations around the world are ...
- gulp环境搭建
简介: gulp是前端开发过程中对代码进行构建的工具,是自动化项目的构建利器:它不仅对网站资源进行优化,而且在开发过程中很多重复的任务,他可以通过明确的工具自动完成,使用它我们不仅可以很愉快的编写代码 ...
- .net 爬虫框架技术选型
个人认为爬虫框架分抓取框架和分析框架 1)抓取框架 .net 市面上好的似乎不多,选择要素分两种:1.轻量型,2.重量型. 1. 轻量型是可以定制一些特殊的功能或者插件开关形式.总体性能高,速度快. ...
- Spring Boot 1.5.4集成Redis
本文示例源码,请看这里: 如何安装与配置Redis,请看这里 首先添加起步依赖: <dependency> <groupId>org.springframework.boot& ...
- centos下-MariaDB的安装
安装命令: yum install mariadb mariadb-server 服务命令: systemctl start|stop|restart mariadb root用户密码设置 mysql ...
- call和apply和bind区别
call和apply特征一样 都是用来调用函数 立即调用 但是可以在调用函数的同时 通过第一个参数指定函数内部this的指向 call 调用的时候 参数必须以参数列表的形式进行传递 也就是以逗号分隔的 ...
- hash冲突随笔
一:hash表 也叫散列表,以key-value的形式存储数据,就是将需要存储的关键码值通过hash函数映射到表中的位置,可加快访问速度. 二:hash冲突 如果两个相同的关键码值通过hash函数映射 ...
- css中的几个小tip(一)
原博:http://www.webhek.com/post/7-tips-web-front-developer-must-know__trashed.html 1.元素的margin-top.mar ...