
echarts交叉关系图二
echarts关系图表,此图是坐标关系图,此图用的随机坐标,此图可以拖拽,更方便整理关系,
引入echarts.js就可以实现
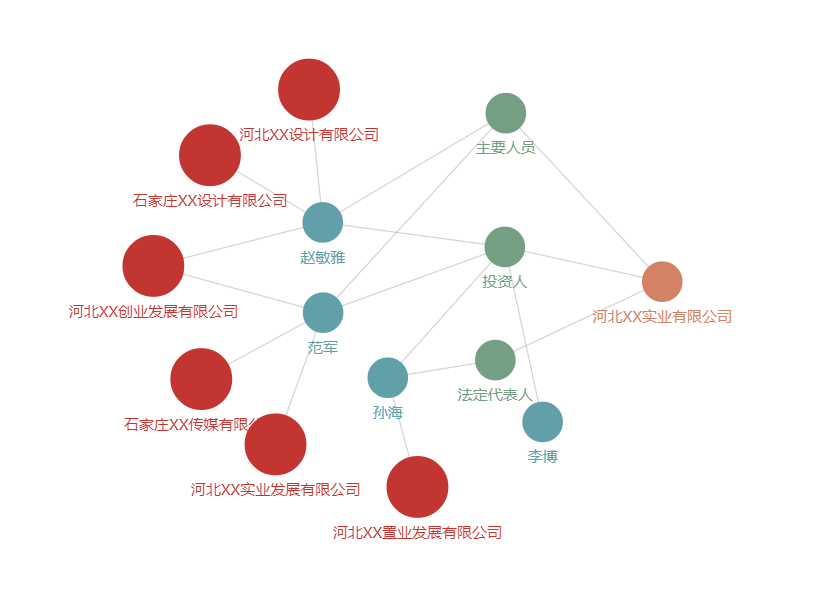
代码:
var graph={  //这是数据项目中一般都是获取到的
    nodes:[
        {"id":"0","name":"河北XX设计有限公司","attributes":{"modularity_class":0}},
        {"id":"1","name":"石家庄XX设计有限公司","attributes":{"modularity_class":0}},
        {"id":"2","name":"河北XX创业发展有限公司","attributes":{"modularity_class":0}},
        {"id":"3","name":"河北XX置业发展有限公司","attributes":{"modularity_class":0}},
        {"id":"4","name":"石家庄XX传媒有限公司","attributes":{"modularity_class":0}},
        {"id":"5","name":"河北XX实业发展有限公司","attributes":{"modularity_class":0}},

        {"id":"6","name":"赵敏雅","attributes":{"modularity_class":1}},
        {"id":"7","name":"范军","attributes":{"modularity_class":1}},
        {"id":"8","name":"孙海","attributes":{"modularity_class":1}},
        {"id":"9","name":"李博","attributes":{"modularity_class":1}},

        {"id":"10","name":"主要人员","attributes":{"modularity_class":2}},
        {"id":"11","name":"投资人","attributes":{"modularity_class":2}},
        {"id":"12","name":"法定代表人","attributes":{"modularity_class":2}},

        {"id":"13","name":"河北XX实业有限公司","attributes":{"modularity_class":3}}
    ],
    links:[
        {"id":"0","source":"0","target":"6"},
        {"id":"1","source":"1","target":"6"},
        {"id":"2","source":"2","target":"6"},
        {"id":"3","source":"2","target":"7"},
        {"id":"4","source":"3","target":"8"},
        {"id":"5","source":"4","target":"7"},
        {"id":"6","source":"5","target":"7"},
        {"id":"7","source":"6","target":"10"},
        {"id":"8","source":"7","target":"10"},
        {"id":"9","source":"6","target":"11"},
        {"id":"10","source":"7","target":"11"},
        {"id":"11","source":"8","target":"11"},
        {"id":"12","source":"8","target":"12"},
        {"id":"13","source":"9","target":"11"},
        {"id":"14","source":"10","target":"13"},
        {"id":"15","source":"11","target":"13"},
        {"id":"16","source":"12","target":"13"}
    ]
};
var myChart = echarts.init(document.getElementById('guanxitu'));
var categories=[
    {
        id:0,
        name: '公司',
        itemStyle:{normal:{color:'#c23531'}},
        symbolSize:[42,42]
    },
    {
        id:1,
        name: '主要成员',
        itemStyle:{normal:{color:'#61a0a8'}},
        symbolSize:[42,42]
    },
    {
        id:2,
        name:'自然人',
        itemStyle:{normal:{color:'#749f83'}},
        symbolSize:[42,42]
    },
    {
        id:3,
        name:'实业公司',
        itemStyle:{normal:{color:'#d48265'}},
        symbolSize:[42,42]
    }
];
var winWidth=document.body.clientWidth;
var winHeight=document.body.clientHeight;
graph.nodes.forEach(function (node) {
    node.x=parseInt(Math.random()*800);  //这里是最重要的如果数据中有返回节点x,y位置这里就不用设置,如果没有这里一定要设置node.x和node.y,不然无法定位节点 也实现不了拖拽了;
    node.y=parseInt(Math.random()*800);
    if(node.attributes.modularity_class != 0){
        node.symbolSize=[42,42];
        node.sizeFlag=[42,42];
    }else{
        node.symbolSize=[64,64];
        node.sizeFlag=[64,64];
    }
    node.category = node.attributes.modularity_class;
    node.label={
        normal:{
            show:true
        }
    }
});
var option = {    //这里是option配置
    legend: [{    //图例组件
        data: categories.map(function (a) {
            return a.name;
        }),
        top:0,
        left:(winWidth-1200)/2,         //这里是图例组件定位使用的,自定义
        itemGap:26,
        textStyle:{
            padding:[0,12]
        },
        backgroundColor:'#f5f5f5'
    }],
    animationDurationUpdate: 1500,
    animationEasingUpdate: 'quinticInOut',
    series : [
        {
            type: 'graph',
            layout: 'none',           //因为节点的位置已经有了就不用在这里使用布局了
            circular:{rotateLabel:true},
            animation: false,
            data: graph.nodes,
            links: graph.links,
            categories: categories,   //节点分类的类目
            roam: true,   //添加缩放和移动
            draggable: false,   //注意这里设置为false,不然拖拽鼠标和节点有偏移
            label: {
                normal: {
                    position: 'bottom',
                    rich:{
                        bg:{
                            backgroundColor: '#f5f5f5'
                        }
                    }
                }
            }
        }
    ]
};
myChart.setOption(option);
initInvisibleGraphic() ;
function initInvisibleGraphic() {
    // Add shadow circles (which is not visible) to enable drag.
    myChart.setOption({
        graphic: echarts.util.map(option.series[0].data, function (item, dataIndex) {
            //使用图形元素组件在节点上划出一个隐形的图形覆盖住节点
            var tmpPos=myChart.convertToPixel({'seriesIndex': 0},[item.x,item.y]);
            return {
                type: 'circle',
                id:dataIndex,
                position: tmpPos,
                shape: {
                    cx: 0,
                    cy: 0,
                    r: 20
                },
                // silent:true,
                invisible: true,
                draggable: true,
                ondrag: echarts.util.curry(onPointDragging, dataIndex),
                z: 100              //使图层在最高层
            };
        })
    });
    window.addEventListener('resize', updatePosition);
    myChart.on('dataZoom', updatePosition);
}
myChart.on('graphRoam', updatePosition);
function updatePosition() {    //更新节点定位的函数
    myChart.setOption({
        graphic: echarts.util.map(option.series[0].data, function (item, dataIndex) {
            var tmpPos=myChart.convertToPixel({'seriesIndex': 0},[item.x,item.y]);
            return {
                position: tmpPos
            };
        })
    });

}
function onPointDragging(dataIndex) {      //节点上图层拖拽执行的函数
    var tmpPos=myChart.convertFromPixel({'seriesIndex': 0},this.position);
    option.series[0].data[dataIndex].x = tmpPos[0];
    option.series[0].data[dataIndex].y = tmpPos[1];
    myChart.setOption(option);
    updatePosition();
}
echarts交叉关系图二的更多相关文章
- echarts交叉关系图一
想要做一个公司-人员关系图,官网echarts图graph webkit dep 稍微改了一下, 也是有点恶心自己,调了一个数据最多的去改,如果正好有人需要就不用去改了 说明:此图没有坐标,可以设置图 ...
- 深入浅出ECharts系列 (二) 折线图
深入浅出ECharts系列(二) 目标 本次教程的目标是实现“折线图堆叠”折线,实现结果如图: 2. 准备工作 a) 首先下载ECharts插件,你可以根据自己的实际需求选择你想要下载 ...
- echarts柱图自定义为硬币堆叠的形式
看这标题,可能会有一些人不太明白,那么直接上图,就是柱图展示形式如下图(兼容IE8) 要想实现这样展示效果.我们想用echarts直接实现不行的,即使是纹理填充也不可行的,但是我们可以借助echart ...
- Echarts 甘特图教程
Echarts甘特图教程 echarts官网实例: https://gallery.echartsjs.com/editor.html?c=xEYpsVs30s 效果: 代码: <html& ...
- echarts雷达图
用echarts展现雷达图的定制 <!doctype html> <html> <head> <meta charset="utf-8"& ...
- 实现Echarts折线图的虚实转换
需求:医院的体温单,在统计体温时,对于正常情况下统计的体温数据,需要显示实线:对于进行物理降温后统计的体温数据,需要显示虚线. 现有的体温单是运用 Echarts 折线图,统一用实线显示.因此在这基础 ...
- 使用echarts水球图
使用echarts水球图 官方实例中没有水球图样式,当我们需要用到水球图的时候需要下载echarts-liquidfill.js. 使用 在echarts之后引入 echarts-liquidfill ...
- echarts 雷达图的个性化设置
echarts 雷达图的个性化设置 function test() { let myChart = echarts.init(document.getElementById('levelImage') ...
- 修改echarts环形图的牵引线及文字位置
修改echarts环形图的牵引线及文字位置,下面代码及效果不仅如此,也包含了其它的效果哦.有问题可以留言. 根据echarts官方示例修改效果: 官方示例图: 修改效果图: 直接上代码:其它不多说. ...
随机推荐
- [luoguP1134] 阶乘问题(数论)
传送门 我直接用 long long 暴力,居然过了 ——代码 #include <cstdio> int n; long long x, ans = 1; int main() { in ...
- Asp.Net页面生命周期[转]
一.什么是Asp.Net页面生命周期 当我们在浏览器地址栏中输入网址,回车查看页面时,这时会向服务器端(IIS)发送一个request请求,服务器就会判断发送过来的请求页面, 完全识别 HTTP 页 ...
- 网上的仿QQ验证码,详细使用方法
struts2的配置 和代码 1.生成图片流 类名:VerifyCodeUtils /** * 生成图片流 * @author Administrator * */ import java.awt.C ...
- 基本的数据类型分析----java.lang.Number类及其子类分析
本文转自http://blog.csdn.net/springcsc1982/article/details/8788345 感谢作者 编写了一个测试程序,如下: int a = 1000, b= 1 ...
- ubuntu16.04 卸载 php7并安装php5.6记录
ubuntu16.04版本从默认源安装的php版本为7.x版本,我们都知道php7.0已经舍弃了很多旧版本的函数等内容,这对旧系统来说是致命的,那么,我们就有了安装旧版php的需求,而同一主机安装两个 ...
- Fragment中的setUserVisibleHint()方法调用
使用Fragment的时候难免会遇到想在视图可见与不可见之中做些操作.此时一般会想到类似Activity中的onResume()和onPause()方法.Fragment中也确实有这两个方法,然而亲測 ...
- iOS UITextView 高度随文字自己主动添加,并尾随键盘移动(二)
上节地址:http://blog.csdn.net/lwjok2007/article/details/47401293 接着上节我们来实现 输入框自己主动调节高度 首先,我们得知道,要推断是否该换行 ...
- 关于C语言指针的一些新认识(2)
在使用C语言编程的过程中,遇到了很多关于指针使用的小问题,这里总结一下就当做是编程的小技巧啦 Q1. 如何用printf( )输出指针 这个问题相当于如何用printf( )输出地址,答案是:用"%p ...
- oc68--NSString
// // main.m // 字符串截取 #import <Foundation/Foundation.h> int main(int argc, const char * argv[] ...
- ALSA声卡驱动中的DAPM详解之二:widget-具备路径和电源管理信息的kcontrol
上一篇文章中,我们介绍了音频驱动中对基本控制单元的封装:kcontrol.利用kcontrol,我们可以完成对音频系统中的mixer,mux,音量控制,音效控制,以及各种开关量的控制,通过对各种kco ...