ASP.NET统计图表控件
近来客户需要将前段时间开发的统计信息用图表展示出来,还要多个图表类型,例如:柱状图、饼图、曲线图、三维图等等。在网上google了一下,发现了三个(也许更多)可以使用的控件。下面我们一起看看这三个控件。
1、OWC11
这个控件全称是:Office Web Component 11,是office2003中的一个组件,可惜的是office2007中没有了它的身影。不过安装office2003之后可以引用,然后使用。使用过的人都知道,就是它的效果要差一点。
2、dotnetCharting
http://www.dotnetcharting.com/
dotnetcharting是国外的一个产品,是要收费的。具体还没有使用,后面在我尝试之后,我会添加一些使用范例。大家也可以上网搜索一下,很多的列子。
3、MSChart
微软发布了.NET 3.5框架下的图表控件,发觉功能很强劲,基本上能想到的图表都可以使用它绘制出来,给图形统计和报表图形显示提供了很好的解决办法,同时支持Web和WinForm两种方式,不过缺点也比较明显,只能在最新的开发环境中使用,需要.Net 3.5 Sp1以及VS 2008的开发环境。
MSChart在ASP.NET中的使用,需要设置web.config文件,可以参看下面的链接:
http://www.cnblogs.com/carysun/archive/2009/03/15/MSChart.html
http://www.cnblogs.com/bluetiger/archive/2009/03/02/1401457.html
MSChart在SharePoint2007中的使用,同样也需要设置web.config文件,可以参看下面的链接:
http://social.msdn.microsoft.com/Forums/en/MSWinWebChart/thread/6eed0b12-9334-4ef5-9d1e-6da1c43d791a
下面是下载地址:
包含英文版,中文版。上面提供的链接是中文版的,可以更改为英文版。
语言包:Microsoft Chart Controls for Microsoft .NET Framework 3.5 Language Pack
Microsoft .NET Framework 3.5 的Microsoft 图表控件 的语言包,包含23中语言。
Microsoft Chart Controls Add-on for Microsoft Visual Studio 2008
这个只有英文的,没找到中文的。
文档 (Microsoft Chart Controls for .NET Framework Documentation)
这个只有英文的,没找到中文的。
WinForm 和 Asp.net的例子(Samples Environment for Microsoft Chart Controls) –
这个只有英文的,没找到中文的。
Demo 下载:http://code.msdn.microsoft.com/mschart
页面代码

<%@ Page Language="C#" AutoEventWireup="true" CodeBehind="Chart.aspx.cs" Inherits="BeautyCode.SharePoint.MVPDemo.Pages.Chart" %>

<%@ Register Assembly="System.Web.DataVisualization, Version=3.5.0.0, Culture=neutral, PublicKeyToken=31bf3856ad364e35"

    Namespace="System.Web.UI.DataVisualization.Charting" TagPrefix="asp" %>

<!DOCTYPE html PUBLIC "-//W3C//DTD XHTML 1.0 Transitional//EN" "http://www.w3.org/TR/xhtml1/DTD/xhtml1-transitional.dtd">

<html xmlns="http://www.w3.org/1999/xhtml">

<head runat="server">

    <title></title>

</head>

<body>

    <form id="form1" runat="server">

    <div>

        <fieldset>

            <legend>ddd</legend>

            <asp:Chart ID="Chart1" runat="server">

                <Titles>

                    <asp:Title Name="Title" Text="Title1">

                    </asp:Title>

                </Titles>

                <Annotations >

                <asp:TextAnnotation Text=""></asp:TextAnnotation>

                </Annotations>


                <Legends>

                <asp:Legend Title =""></asp:Legend>

                </Legends>

                <MapAreas>

                </MapAreas>

                <Series>


                </Series>

                <ChartAreas>

                    <asp:ChartArea Name="ChartAreas1">

                    </asp:ChartArea>

                </ChartAreas>

            </asp:Chart>

        </fieldset>

    </div>

    <div>

        <asp:Chart ID="Chart2" runat="server">

            <Series>


            </Series>

            <Legends>

                <asp:Legend Title =""></asp:Legend>

                </Legends>

            <ChartAreas>

                <asp:ChartArea Name="ChartAreas1">

                </asp:ChartArea>


            </ChartAreas>

        </asp:Chart>

    </div>

    </form>

</body>

</html>
后台代码
using System;
using System.Collections.Generic;
using System.Linq;
using System.Web;
using System.Data;
using System.Web.UI;
using System.Web.UI.WebControls;
using Microsoft.Office.Core;
using Microsoft.Office.Interop.Owc11;
using Microsoft.Office.Interop;
using System.Web.UI.DataVisualization.Charting; namespace BeautyCode.SharePoint.MVPDemo.Pages
{
public partial class Chart : System.Web.UI.Page
{
private DataTable _SampleDataTable;
private DataTable _InSchool;
protected void Page_Load(object sender, EventArgs e)
{
if (!IsPostBack)
{
PaintChart1();
PaintChart2();
}
}
private void CreateDataTable()
{
_SampleDataTable = new DataTable();
_SampleDataTable.Columns.Add("jx");
_SampleDataTable.Columns.Add("count"); DataRow row; row = _SampleDataTable.NewRow();
row[0] = "上将";
row[1] = 100;
_SampleDataTable.Rows.Add(row); row = _SampleDataTable.NewRow();
row[0] = "准将";
row[1] = 400;
_SampleDataTable.Rows.Add(row); row = _SampleDataTable.NewRow();
row[0] = "大校";
row[1] = 1000;
_SampleDataTable.Rows.Add(row); row = _SampleDataTable.NewRow();
row[0] = "上校";
row[1] = 800;
_SampleDataTable.Rows.Add(row); row = _SampleDataTable.NewRow();
row[0] = "上尉";
row[1] = 600;
_SampleDataTable.Rows.Add(row);
}
private void PaintChart1()
{
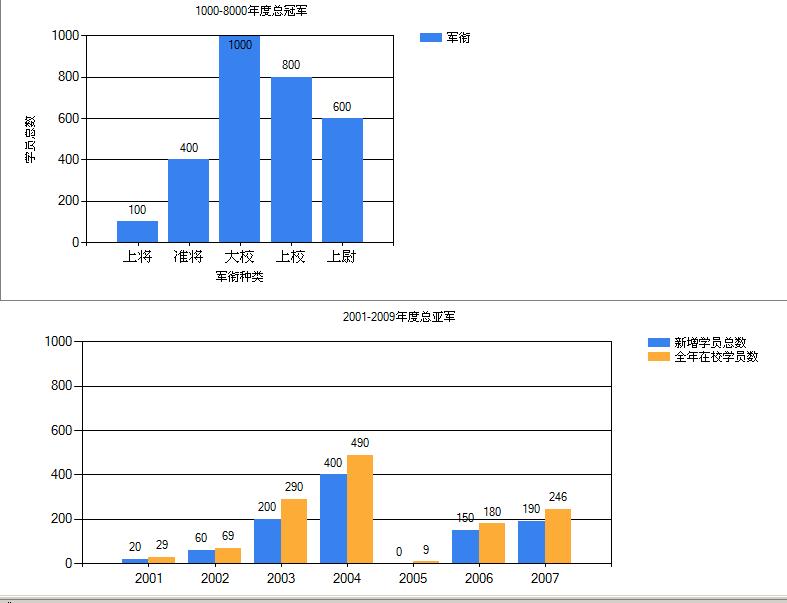
CreateDataTable(); this.Chart1.Titles["Title"].Text = "1000-8000年度总冠军";
this.Chart1.Series.Add(new Series("军衔"));
this.Chart1.Width = 500;
#region MSChart manual add data //this.Chart1.Series["军衔"].Points.AddXY("上将", 20);
//this.Chart1.Series["军衔"].Points.AddXY("中将", 200);
//this.Chart1.Series["军衔"].Points.AddXY("准将", 40);
//this.Chart1.Series["军衔"].Points.AddXY("中校", 60);
//this.Chart1.Series["军衔"].Points.AddXY("少校", 100);
//this.Chart1.Series["军衔"].Points.AddXY("上尉", 48);
#endregion #region MSChart DataSource Array //int xy = _SampleDataTable.Rows.Count;
//List<string> jx = new List<string>();
//List<int> count = new List<int>();
//DataRowCollection rows = _SampleDataTable.Rows;
//foreach (DataRow row in rows)
//{
// jx.Add(row["jx"].ToString());
// count.Add(int.Parse(row["count"].ToString()));
//}
//this.Chart1.Series["军衔"].Points.DataBindXY(jx,count );
#endregion #region MSChart DataSource DataTable
this.Chart1.DataSource = _SampleDataTable;
this.Chart1.Series["军衔"].XValueMember = "jx";
this.Chart1.Series["军衔"].XValueType = ChartValueType.String;
this.Chart1.Series["军衔"].XAxisType = AxisType.Primary; this.Chart1.Series["军衔"].YValueMembers = "count";
this.Chart1.Series["军衔"].YValueType = ChartValueType.Int32;
this.Chart1.Series["军衔"].YAxisType = AxisType.Primary;
#endregion #region this.Chart1.Series["军衔"].ChartType = SeriesChartType.Column;
this.Chart1.Series["军衔"].BorderWidth = 1;
this.Chart1.Series["军衔"].IsVisibleInLegend = true;
this.Chart1.Series["军衔"].IsValueShownAsLabel = true;
#endregion #region this.Chart1.ChartAreas["ChartAreas1"].AxisX.Title = "军衔种类";
this.Chart1.ChartAreas["ChartAreas1"].AxisY.Interval = 200;
this.Chart1.ChartAreas["ChartAreas1"].AxisY.Title = "学员总数";
this.Chart1.ChartAreas["ChartAreas1"].AxisY.Maximum = 1000;
this.Chart1.ChartAreas["ChartAreas1"].BorderDashStyle = ChartDashStyle.Solid;
this.Chart1.ChartAreas["ChartAreas1"].BorderWidth = 1;
this.Chart1.ChartAreas["ChartAreas1"].AxisX.MajorGrid.LineWidth = 0;
#endregion
} private void CreateInSchool()
{
_InSchool = new DataTable();
_InSchool.Columns.Add("year");
_InSchool.Columns.Add("allyear");
_InSchool.Columns.Add("new");
_InSchool.Rows.Add("2001", 20, 29);
_InSchool.Rows.Add("2002", 60, 69);
_InSchool.Rows.Add("2003", 200, 290);
_InSchool.Rows.Add("2004", 400, 490);
_InSchool.Rows.Add("2005", 0, 9);
_InSchool.Rows.Add("2006", 150, 180);
_InSchool.Rows.Add("2007", 190, 246);
}
private void PaintChart2()
{
CreateInSchool();
this.Chart2.Titles.Add("2001-2009年度总亚军");
this.Chart2.Width = 800;
this.Chart2.Series.Add(new Series("新增学员总数"));
this.Chart2.Series["新增学员总数"].ChartType = SeriesChartType.Column;
this.Chart2.Series["新增学员总数"].BorderWidth = 1;
this.Chart2.Series["新增学员总数"].IsVisibleInLegend = true;
this.Chart2.Series["新增学员总数"].IsValueShownAsLabel = true;
#region this.Chart2.Series["新增学员总数"].ChartType = SeriesChartType.Column;
this.Chart2.Series["新增学员总数"].BorderWidth = 1;
this.Chart2.Series["新增学员总数"].IsVisibleInLegend = true;
this.Chart2.Series["新增学员总数"].IsValueShownAsLabel = true;
this.Chart2.Series["新增学员总数"].ChartArea = "ChartAreas1";
#endregion #region this.Chart2.ChartAreas["ChartAreas1"].AxisY.Interval = 200; this.Chart2.ChartAreas["ChartAreas1"].AxisY.Maximum = 1000;
this.Chart2.ChartAreas["ChartAreas1"].BorderDashStyle = ChartDashStyle.Solid;
this.Chart2.ChartAreas["ChartAreas1"].BorderWidth = 1;
this.Chart2.ChartAreas["ChartAreas1"].AxisX.MajorGrid.LineWidth = 0; #endregion this.Chart2.Series.Add(new Series("全年在校学员数")); this.Chart2.Series["全年在校学员数"].ChartType = SeriesChartType.Column;
this.Chart2.Series["全年在校学员数"].BorderWidth = 1;
this.Chart2.Series["全年在校学员数"].IsVisibleInLegend = true;
this.Chart2.Series["全年在校学员数"].IsValueShownAsLabel = true; #region this.Chart2.Series["全年在校学员数"].ChartType = SeriesChartType.Column;
this.Chart2.Series["全年在校学员数"].BorderWidth = 1;
this.Chart2.Series["全年在校学员数"].IsVisibleInLegend = true;
this.Chart2.Series["全年在校学员数"].IsValueShownAsLabel = true;
this.Chart2.Series["全年在校学员数"].ChartArea = "ChartAreas1";
#endregion #region this.Chart2.ChartAreas["ChartAreas1"].AxisY.Interval = 200;
this.Chart2.ChartAreas["ChartAreas1"].AxisY.Maximum = 1000;
this.Chart2.ChartAreas["ChartAreas1"].BorderDashStyle = ChartDashStyle.Solid;
this.Chart2.ChartAreas["ChartAreas1"].BorderWidth = 1;
this.Chart2.ChartAreas["ChartAreas1"].AxisX.MajorGrid.LineWidth = 0;
#endregion
this.Chart2.DataSource = _InSchool;
this.Chart2.Series["新增学员总数"].XValueMember = "year";
this.Chart2.Series["新增学员总数"].XValueType = ChartValueType.Int32;
this.Chart2.Series["新增学员总数"].XAxisType = AxisType.Primary;
this.Chart2.Series["新增学员总数"].YValueMembers = "allyear";
this.Chart2.Series["新增学员总数"].YValueType = ChartValueType.Int32;
this.Chart2.Series["新增学员总数"].YAxisType = AxisType.Primary;
this.Chart2.Series["全年在校学员数"].XValueMember = "year";
this.Chart2.Series["全年在校学员数"].XValueType = ChartValueType.Int32;
this.Chart2.Series["全年在校学员数"].XAxisType = AxisType.Primary;
this.Chart2.Series["全年在校学员数"].YValueMembers = "new";
this.Chart2.Series["全年在校学员数"].YValueType = ChartValueType.Int32;
this.Chart2.Series["全年在校学员数"].YAxisType = AxisType.Primary;
}
}
}
ASP.NET统计图表控件的更多相关文章
- asp.net分页控件
一.说明 AspNetPager.dll这个分页控件主要用于asp.net webform网站,现将整理代码如下 二.代码 1.首先在测试页面Default.aspx页面添加引用 <%@ Reg ...
- asp.net ajax控件tab扩展,极品啊,秒杀其它插件
说明:asp.net ajax控件tab要设置width和height,而且在线文本编辑器放能够放入tab中,也必须是asp.net的控件型在线文本,例如fckeditor,下面是我设置好的配置. & ...
- javascript获取asp.net服务器端控件的值
代码如下: <%@ Page Language="C#" CodeFile="A.aspx.cs" Inherits="OrderManage_ ...
- ASP.NET控件<ASP:Button /> html控件<input type="button">区别联系
ASP.NET控件<ASP:Button />-------html控件<input type="button">杨中科是这么说的:asp和input是一样 ...
- [ASP.NET]asp.net Repeater控件的使用方法
asp.net Repeater控件的使用方法 -- : 4770人阅读 评论() 收藏 举报 asp.netserveraspdatasetdeletexhtml 今天学习了,Repeater控件 ...
- 关于ASP.net TextBox控件的失去焦点后触发其它事件
编写人:CC阿爸 2015-2-02 今天在这里,我想与大家一起分享如何处理的ASP.net TextBox控件的失去焦点后触发其它事件的问题,在此做个小结,以供参考.有兴趣的同学,可以一同探讨与学习 ...
- 浅谈ASP.NET报表控件
OWC似乎使用者居多,但看见有网友在帖中抱怨OWC在使用时需要许可证书,于是将其排除,我可不想BOSS在看报表时弹出一个“没有许可证书”的窗口. 接着找到了ComponentOne的Web chart ...
- 要后台控制前台的的CSS样式,我们可以加入ASP.NET Literal 控件
ASP.NET Literal 控件,用于在页面上显示文本.此文本是可编程的. 我用它来制作了 ) { this.LtdMemberPromotion7.Text = "<style ...
- ASP.Net 验证控件 RequiredFieldValidator
使用 ASP.NET 验证控件可在网页上检查用户输入.有用于各种不同类型验证的控件,例如范围检查或模式匹配验证控件.每个验证控件都引用网页上其他位置的输入控件(服务器控件).当处理用户输入时(例如,当 ...
随机推荐
- Xcode打包应用为ipa
Xcode教程 Xcode4发布测试 打包Archive操作是本文要介绍的内容,发布测试的最后一步打包(Archive),Xcode4帮助文档有比较详细介绍,但是居然是错的,这里说明一下. 1.设置& ...
- 【笔记】Linux内核中的循环缓冲区
1. 有关ring buffer的理解 1) ring buffer位首尾相接的buffer,即类似生活中的圆形跑道: 2) 空闲空间+数据空间=ring buffer大小 3) ring bu ...
- iOS开发中16进制颜色(html颜色值)字符串转为UIColor
//16进制颜色(html颜色值)字符串转为UIColor +(UIColor *) hexStringToColor: (NSString *) stringToConvert { NSString ...
- LeetCode OJ--Reverse Linked List II
http://oj.leetcode.com/problems/reverse-linked-list-ii/ 链表的操作 #include <iostream> using namesp ...
- omcat 7 的domain域名配置,Tomcat 修改JSESSIONID
https://blog.csdn.net/catoop/article/details/64581325
- 快速掌握RabbitMQ(三)——消息确认、持久化、优先级的C#实现
1 消息确认 在一些场合,如转账.付费时每一条消息都必须保证成功的被处理.AMQP是金融级的消息队列协议,有很高的可靠性,这里介绍在使用RabbitMQ时怎么保证消息被成功处理的.消息确认可以分为两种 ...
- P1111 修复公路 洛谷
https://www.luogu.org/problem/show?pid=1111 题目背景 A地区在地震过后,连接所有村庄的公路都造成了损坏而无法通车.政府派人修复这些公路. 题目描述 给出A地 ...
- ELK之收集Nginx、Tomcat的json格式日志
1.安装Nginx yum -y install nginx vim /etc/nginx/nginx.conf # 修改日志格式为json格式,并创建一个nginxweb的网站目录 log_form ...
- Log4J使用详情
一 .Log4J使用详情 Log4J的配置文件(Configuration File)就是用来设置记录器的级别.存放器和布局的,它可接key=value格式的设置或xml格式的设置信息.通过配置,可以 ...
- 【面试 struts2】【第三篇】struts2的问题
1.struts2的工作流程 1>客户端浏览器发出HTTP请求. 2>根据web.xml配置,该请求被FilterDispatcher接收 3>根据struts.xml配置,找到需要 ...