ASP.NET统计图表控件
近来客户需要将前段时间开发的统计信息用图表展示出来,还要多个图表类型,例如:柱状图、饼图、曲线图、三维图等等。在网上google了一下,发现了三个(也许更多)可以使用的控件。下面我们一起看看这三个控件。
1、OWC11
这个控件全称是:Office Web Component 11,是office2003中的一个组件,可惜的是office2007中没有了它的身影。不过安装office2003之后可以引用,然后使用。使用过的人都知道,就是它的效果要差一点。
2、dotnetCharting
http://www.dotnetcharting.com/
dotnetcharting是国外的一个产品,是要收费的。具体还没有使用,后面在我尝试之后,我会添加一些使用范例。大家也可以上网搜索一下,很多的列子。
3、MSChart
微软发布了.NET 3.5框架下的图表控件,发觉功能很强劲,基本上能想到的图表都可以使用它绘制出来,给图形统计和报表图形显示提供了很好的解决办法,同时支持Web和WinForm两种方式,不过缺点也比较明显,只能在最新的开发环境中使用,需要.Net 3.5 Sp1以及VS 2008的开发环境。
MSChart在ASP.NET中的使用,需要设置web.config文件,可以参看下面的链接:
http://www.cnblogs.com/carysun/archive/2009/03/15/MSChart.html
http://www.cnblogs.com/bluetiger/archive/2009/03/02/1401457.html
MSChart在SharePoint2007中的使用,同样也需要设置web.config文件,可以参看下面的链接:
http://social.msdn.microsoft.com/Forums/en/MSWinWebChart/thread/6eed0b12-9334-4ef5-9d1e-6da1c43d791a
下面是下载地址:
包含英文版,中文版。上面提供的链接是中文版的,可以更改为英文版。
语言包:Microsoft Chart Controls for Microsoft .NET Framework 3.5 Language Pack
Microsoft .NET Framework 3.5 的Microsoft 图表控件 的语言包,包含23中语言。
Microsoft Chart Controls Add-on for Microsoft Visual Studio 2008
这个只有英文的,没找到中文的。
文档 (Microsoft Chart Controls for .NET Framework Documentation)
这个只有英文的,没找到中文的。
WinForm 和 Asp.net的例子(Samples Environment for Microsoft Chart Controls) –
这个只有英文的,没找到中文的。
Demo 下载:http://code.msdn.microsoft.com/mschart
页面代码

<%@ Page Language="C#" AutoEventWireup="true" CodeBehind="Chart.aspx.cs" Inherits="BeautyCode.SharePoint.MVPDemo.Pages.Chart" %>

<%@ Register Assembly="System.Web.DataVisualization, Version=3.5.0.0, Culture=neutral, PublicKeyToken=31bf3856ad364e35"

    Namespace="System.Web.UI.DataVisualization.Charting" TagPrefix="asp" %>

<!DOCTYPE html PUBLIC "-//W3C//DTD XHTML 1.0 Transitional//EN" "http://www.w3.org/TR/xhtml1/DTD/xhtml1-transitional.dtd">

<html xmlns="http://www.w3.org/1999/xhtml">

<head runat="server">

    <title></title>

</head>

<body>

    <form id="form1" runat="server">

    <div>

        <fieldset>

            <legend>ddd</legend>

            <asp:Chart ID="Chart1" runat="server">

                <Titles>

                    <asp:Title Name="Title" Text="Title1">

                    </asp:Title>

                </Titles>

                <Annotations >

                <asp:TextAnnotation Text=""></asp:TextAnnotation>

                </Annotations>


                <Legends>

                <asp:Legend Title =""></asp:Legend>

                </Legends>

                <MapAreas>

                </MapAreas>

                <Series>


                </Series>

                <ChartAreas>

                    <asp:ChartArea Name="ChartAreas1">

                    </asp:ChartArea>

                </ChartAreas>

            </asp:Chart>

        </fieldset>

    </div>

    <div>

        <asp:Chart ID="Chart2" runat="server">

            <Series>


            </Series>

            <Legends>

                <asp:Legend Title =""></asp:Legend>

                </Legends>

            <ChartAreas>

                <asp:ChartArea Name="ChartAreas1">

                </asp:ChartArea>


            </ChartAreas>

        </asp:Chart>

    </div>

    </form>

</body>

</html>
后台代码
using System;
using System.Collections.Generic;
using System.Linq;
using System.Web;
using System.Data;
using System.Web.UI;
using System.Web.UI.WebControls;
using Microsoft.Office.Core;
using Microsoft.Office.Interop.Owc11;
using Microsoft.Office.Interop;
using System.Web.UI.DataVisualization.Charting; namespace BeautyCode.SharePoint.MVPDemo.Pages
{
public partial class Chart : System.Web.UI.Page
{
private DataTable _SampleDataTable;
private DataTable _InSchool;
protected void Page_Load(object sender, EventArgs e)
{
if (!IsPostBack)
{
PaintChart1();
PaintChart2();
}
}
private void CreateDataTable()
{
_SampleDataTable = new DataTable();
_SampleDataTable.Columns.Add("jx");
_SampleDataTable.Columns.Add("count"); DataRow row; row = _SampleDataTable.NewRow();
row[0] = "上将";
row[1] = 100;
_SampleDataTable.Rows.Add(row); row = _SampleDataTable.NewRow();
row[0] = "准将";
row[1] = 400;
_SampleDataTable.Rows.Add(row); row = _SampleDataTable.NewRow();
row[0] = "大校";
row[1] = 1000;
_SampleDataTable.Rows.Add(row); row = _SampleDataTable.NewRow();
row[0] = "上校";
row[1] = 800;
_SampleDataTable.Rows.Add(row); row = _SampleDataTable.NewRow();
row[0] = "上尉";
row[1] = 600;
_SampleDataTable.Rows.Add(row);
}
private void PaintChart1()
{
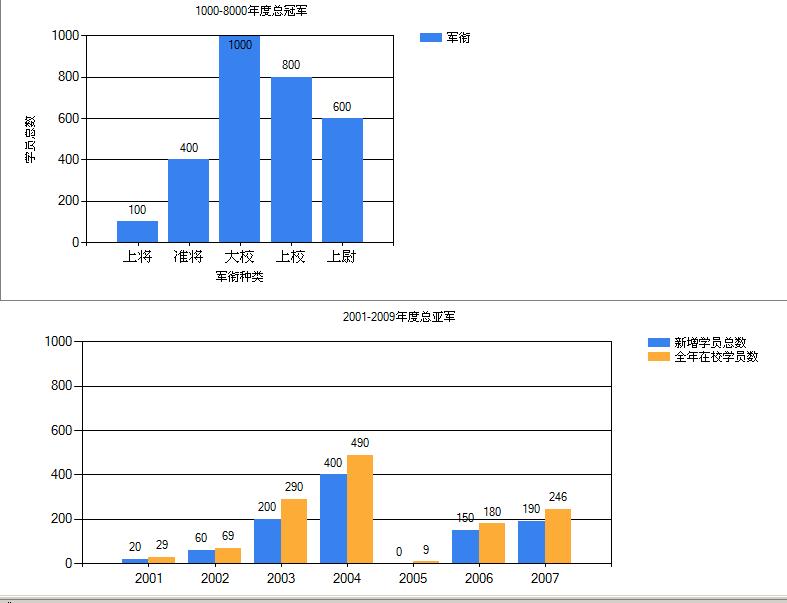
CreateDataTable(); this.Chart1.Titles["Title"].Text = "1000-8000年度总冠军";
this.Chart1.Series.Add(new Series("军衔"));
this.Chart1.Width = 500;
#region MSChart manual add data //this.Chart1.Series["军衔"].Points.AddXY("上将", 20);
//this.Chart1.Series["军衔"].Points.AddXY("中将", 200);
//this.Chart1.Series["军衔"].Points.AddXY("准将", 40);
//this.Chart1.Series["军衔"].Points.AddXY("中校", 60);
//this.Chart1.Series["军衔"].Points.AddXY("少校", 100);
//this.Chart1.Series["军衔"].Points.AddXY("上尉", 48);
#endregion #region MSChart DataSource Array //int xy = _SampleDataTable.Rows.Count;
//List<string> jx = new List<string>();
//List<int> count = new List<int>();
//DataRowCollection rows = _SampleDataTable.Rows;
//foreach (DataRow row in rows)
//{
// jx.Add(row["jx"].ToString());
// count.Add(int.Parse(row["count"].ToString()));
//}
//this.Chart1.Series["军衔"].Points.DataBindXY(jx,count );
#endregion #region MSChart DataSource DataTable
this.Chart1.DataSource = _SampleDataTable;
this.Chart1.Series["军衔"].XValueMember = "jx";
this.Chart1.Series["军衔"].XValueType = ChartValueType.String;
this.Chart1.Series["军衔"].XAxisType = AxisType.Primary; this.Chart1.Series["军衔"].YValueMembers = "count";
this.Chart1.Series["军衔"].YValueType = ChartValueType.Int32;
this.Chart1.Series["军衔"].YAxisType = AxisType.Primary;
#endregion #region this.Chart1.Series["军衔"].ChartType = SeriesChartType.Column;
this.Chart1.Series["军衔"].BorderWidth = 1;
this.Chart1.Series["军衔"].IsVisibleInLegend = true;
this.Chart1.Series["军衔"].IsValueShownAsLabel = true;
#endregion #region this.Chart1.ChartAreas["ChartAreas1"].AxisX.Title = "军衔种类";
this.Chart1.ChartAreas["ChartAreas1"].AxisY.Interval = 200;
this.Chart1.ChartAreas["ChartAreas1"].AxisY.Title = "学员总数";
this.Chart1.ChartAreas["ChartAreas1"].AxisY.Maximum = 1000;
this.Chart1.ChartAreas["ChartAreas1"].BorderDashStyle = ChartDashStyle.Solid;
this.Chart1.ChartAreas["ChartAreas1"].BorderWidth = 1;
this.Chart1.ChartAreas["ChartAreas1"].AxisX.MajorGrid.LineWidth = 0;
#endregion
} private void CreateInSchool()
{
_InSchool = new DataTable();
_InSchool.Columns.Add("year");
_InSchool.Columns.Add("allyear");
_InSchool.Columns.Add("new");
_InSchool.Rows.Add("2001", 20, 29);
_InSchool.Rows.Add("2002", 60, 69);
_InSchool.Rows.Add("2003", 200, 290);
_InSchool.Rows.Add("2004", 400, 490);
_InSchool.Rows.Add("2005", 0, 9);
_InSchool.Rows.Add("2006", 150, 180);
_InSchool.Rows.Add("2007", 190, 246);
}
private void PaintChart2()
{
CreateInSchool();
this.Chart2.Titles.Add("2001-2009年度总亚军");
this.Chart2.Width = 800;
this.Chart2.Series.Add(new Series("新增学员总数"));
this.Chart2.Series["新增学员总数"].ChartType = SeriesChartType.Column;
this.Chart2.Series["新增学员总数"].BorderWidth = 1;
this.Chart2.Series["新增学员总数"].IsVisibleInLegend = true;
this.Chart2.Series["新增学员总数"].IsValueShownAsLabel = true;
#region this.Chart2.Series["新增学员总数"].ChartType = SeriesChartType.Column;
this.Chart2.Series["新增学员总数"].BorderWidth = 1;
this.Chart2.Series["新增学员总数"].IsVisibleInLegend = true;
this.Chart2.Series["新增学员总数"].IsValueShownAsLabel = true;
this.Chart2.Series["新增学员总数"].ChartArea = "ChartAreas1";
#endregion #region this.Chart2.ChartAreas["ChartAreas1"].AxisY.Interval = 200; this.Chart2.ChartAreas["ChartAreas1"].AxisY.Maximum = 1000;
this.Chart2.ChartAreas["ChartAreas1"].BorderDashStyle = ChartDashStyle.Solid;
this.Chart2.ChartAreas["ChartAreas1"].BorderWidth = 1;
this.Chart2.ChartAreas["ChartAreas1"].AxisX.MajorGrid.LineWidth = 0; #endregion this.Chart2.Series.Add(new Series("全年在校学员数")); this.Chart2.Series["全年在校学员数"].ChartType = SeriesChartType.Column;
this.Chart2.Series["全年在校学员数"].BorderWidth = 1;
this.Chart2.Series["全年在校学员数"].IsVisibleInLegend = true;
this.Chart2.Series["全年在校学员数"].IsValueShownAsLabel = true; #region this.Chart2.Series["全年在校学员数"].ChartType = SeriesChartType.Column;
this.Chart2.Series["全年在校学员数"].BorderWidth = 1;
this.Chart2.Series["全年在校学员数"].IsVisibleInLegend = true;
this.Chart2.Series["全年在校学员数"].IsValueShownAsLabel = true;
this.Chart2.Series["全年在校学员数"].ChartArea = "ChartAreas1";
#endregion #region this.Chart2.ChartAreas["ChartAreas1"].AxisY.Interval = 200;
this.Chart2.ChartAreas["ChartAreas1"].AxisY.Maximum = 1000;
this.Chart2.ChartAreas["ChartAreas1"].BorderDashStyle = ChartDashStyle.Solid;
this.Chart2.ChartAreas["ChartAreas1"].BorderWidth = 1;
this.Chart2.ChartAreas["ChartAreas1"].AxisX.MajorGrid.LineWidth = 0;
#endregion
this.Chart2.DataSource = _InSchool;
this.Chart2.Series["新增学员总数"].XValueMember = "year";
this.Chart2.Series["新增学员总数"].XValueType = ChartValueType.Int32;
this.Chart2.Series["新增学员总数"].XAxisType = AxisType.Primary;
this.Chart2.Series["新增学员总数"].YValueMembers = "allyear";
this.Chart2.Series["新增学员总数"].YValueType = ChartValueType.Int32;
this.Chart2.Series["新增学员总数"].YAxisType = AxisType.Primary;
this.Chart2.Series["全年在校学员数"].XValueMember = "year";
this.Chart2.Series["全年在校学员数"].XValueType = ChartValueType.Int32;
this.Chart2.Series["全年在校学员数"].XAxisType = AxisType.Primary;
this.Chart2.Series["全年在校学员数"].YValueMembers = "new";
this.Chart2.Series["全年在校学员数"].YValueType = ChartValueType.Int32;
this.Chart2.Series["全年在校学员数"].YAxisType = AxisType.Primary;
}
}
}
ASP.NET统计图表控件的更多相关文章
- asp.net分页控件
一.说明 AspNetPager.dll这个分页控件主要用于asp.net webform网站,现将整理代码如下 二.代码 1.首先在测试页面Default.aspx页面添加引用 <%@ Reg ...
- asp.net ajax控件tab扩展,极品啊,秒杀其它插件
说明:asp.net ajax控件tab要设置width和height,而且在线文本编辑器放能够放入tab中,也必须是asp.net的控件型在线文本,例如fckeditor,下面是我设置好的配置. & ...
- javascript获取asp.net服务器端控件的值
代码如下: <%@ Page Language="C#" CodeFile="A.aspx.cs" Inherits="OrderManage_ ...
- ASP.NET控件<ASP:Button /> html控件<input type="button">区别联系
ASP.NET控件<ASP:Button />-------html控件<input type="button">杨中科是这么说的:asp和input是一样 ...
- [ASP.NET]asp.net Repeater控件的使用方法
asp.net Repeater控件的使用方法 -- : 4770人阅读 评论() 收藏 举报 asp.netserveraspdatasetdeletexhtml 今天学习了,Repeater控件 ...
- 关于ASP.net TextBox控件的失去焦点后触发其它事件
编写人:CC阿爸 2015-2-02 今天在这里,我想与大家一起分享如何处理的ASP.net TextBox控件的失去焦点后触发其它事件的问题,在此做个小结,以供参考.有兴趣的同学,可以一同探讨与学习 ...
- 浅谈ASP.NET报表控件
OWC似乎使用者居多,但看见有网友在帖中抱怨OWC在使用时需要许可证书,于是将其排除,我可不想BOSS在看报表时弹出一个“没有许可证书”的窗口. 接着找到了ComponentOne的Web chart ...
- 要后台控制前台的的CSS样式,我们可以加入ASP.NET Literal 控件
ASP.NET Literal 控件,用于在页面上显示文本.此文本是可编程的. 我用它来制作了 ) { this.LtdMemberPromotion7.Text = "<style ...
- ASP.Net 验证控件 RequiredFieldValidator
使用 ASP.NET 验证控件可在网页上检查用户输入.有用于各种不同类型验证的控件,例如范围检查或模式匹配验证控件.每个验证控件都引用网页上其他位置的输入控件(服务器控件).当处理用户输入时(例如,当 ...
随机推荐
- hdu1853/ hdu 3488 有向图,取k个圈覆盖所有点一次//费用流
哎╮(╯▽╰)╭,这是费用流基础题型,拆点,建二分图,跑最小费用最大流即可.若最大流为n,则说明是最大匹配为n,所有点都参与,每个点的入度和出度又是1,所以就是环. 弱菜还需努力! #include& ...
- sulime text 常用快捷键总结
Sublime Text 3汉化中文版主要特色: -语法高亮.代码提示补全.代码折叠.自定义皮肤/配色方案.多便签 -代码地图.多种界面布局与全屏免打扰模式 -完全开放的用户自定义配置与神奇实用的编辑 ...
- PAT (Advanced Level) 1086. Tree Traversals Again (25)
入栈顺序为先序遍历,出栈顺序为中序遍历. #include<cstdio> #include<cstring> #include<cmath> #include&l ...
- luogu P1260 工程规划
题目描述 造一幢大楼是一项艰巨的工程,它是由n个子任务构成的,给它们分别编号1,2,…,n(5≤n≤1000).由于对一些任务的起始条件有着严格的限制,所以每个任务的起始时间T1,T2,…,Tn并不是 ...
- Spark学习(三): 基本架构及原理
Apache Spark是一个围绕速度.易用性和复杂分析构建的大数据处理框架,最初在2009年由加州大学伯克利分校的AMPLab开发,并于2010年成为Apache的开源项目之一,与Hadoop和St ...
- Effective Java P2 Item1 Consider static factory methods instead of constructors
获得一个类的实例的传统方法是公共的构造方法,还可以提供一个公共的静态工厂方法(一个返回值为该类实例的简单静态方法), 例如Boolean(boolean 的封装类) public static Boo ...
- Object中的wait,notify,notifyAll基本使用(转)
让线程停止运行/睡眠的方法只有两个:Thread.sleep()或者obj.wait() 记住obj.nofity()并不能停止线程运行,因为notify虽然释放了锁,但依然会急促执行完synchro ...
- 【Todo】Spark运行架构
接上一篇:http://www.cnblogs.com/charlesblc/p/6108105.html 上一篇文章中主要参考的是 Link 这个系列下一篇讲的是Idea,没有细看,又看了再下一篇: ...
- BUPT 2012复试机考 1T
题目描述 大家都知道,数据在计算机里中存储是以二进制的形式存储的. 有一天,小明学了C语言之后,他想知道一个类型为unsigned int 类型的数字,存储在计算机中的二进制串是什么样子的. 你能帮帮 ...
- 紫书p199 八数码(BFS,hash)
八数码问题 紫书上的简单搜索 渣渣好久才弄懂 #include<cstdio> #include<cstring> using namespace std; const i ...