Nginx loki监控日志的学习
Nginx loki监控日志的学习
背景
学习自:

https://mp.weixin.qq.com/s/Qt1r7vzWvCcJpNDilWHuxQ

增加了一些自己的理解
第一部分nginx日志的完善
在logformat的后面增加一个:

log_format json_analytics escape=json '{'

                            '"msec": "$msec", ' # request unixtime in seconds with a milliseconds resolution

                            '"connection": "$connection", ' # connection serial number

                            '"connection_requests": "$connection_requests", ' # number of requests made in connection

                    '"pid": "$pid", ' # process pid

                    '"request_id": "$request_id", ' # the unique request id

                    '"request_length": "$request_length", ' # request length (including headers and body)

                    '"remote_addr": "$remote_addr", ' # client IP

                    '"remote_user": "$remote_user", ' # client HTTP username

                    '"remote_port": "$remote_port", ' # client port

                    '"time_local": "$time_local", '

                    '"time_iso8601": "$time_iso8601", ' # local time in the ISO 8601 standard format

                    '"request": "$request", ' # full path no arguments if the request

                    '"request_uri": "$request_uri", ' # full path and arguments if the request

                    '"args": "$args", ' # args

                    '"status": "$status", ' # response status code

                    '"body_bytes_sent": "$body_bytes_sent", ' # the number of body bytes exclude headers sent to a client

                    '"bytes_sent": "$bytes_sent", ' # the number of bytes sent to a client

                    '"http_referer": "$http_referer", ' # HTTP referer

                    '"http_user_agent": "$http_user_agent", ' # user agent

                    '"http_x_forwarded_for": "$http_x_forwarded_for", ' # http_x_forwarded_for

                    '"http_host": "$http_host", ' # the request Host: header

                    '"server_name": "$server_name", ' # the name of the vhost serving the request

                    '"request_time": "$request_time", ' # request processing time in seconds with msec resolution

                    '"upstream": "$upstream_addr", ' # upstream backend server for proxied requests

                    '"upstream_connect_time": "$upstream_connect_time", ' # upstream handshake time incl. TLS

                    '"upstream_header_time": "$upstream_header_time", ' # time spent receiving upstream headers

                    '"upstream_response_time": "$upstream_response_time", ' # time spend receiving upstream body

                    '"upstream_response_length": "$upstream_response_length", ' # upstream response length

                    '"upstream_cache_status": "$upstream_cache_status", ' # cache HIT/MISS where applicable

                    '"ssl_protocol": "$ssl_protocol", ' # TLS protocol

                    '"ssl_cipher": "$ssl_cipher", ' # TLS cipher

                    '"scheme": "$scheme", ' # http or https

                    '"request_method": "$request_method", ' # request method

                    '"server_protocol": "$server_protocol", ' # request protocol, like HTTP/1.1 or HTTP/2.0

                    '"pipe": "$pipe", ' # "p" if request was pipelined, "." otherwise

                    '"gzip_ratio": "$gzip_ratio", '

                    '"http_cf_ray": "$http_cf_ray"'

                    '}';

然后日志修改为:

access_log /data/nginx/gscloudsu.log json_analytics ;

注意文件日志等属性.

重启ningx:

lsof -i:5000 |awk '{print $2}' |xargs kill -9

cd /data/nginx

./nginx -c 5000.conf
下载loki等组件
https://github.com/grafana/loki/releases/tag/v2.9.2

最新版本是 2.9.2 我这边下载了四个文件备用

promtail-linux-arm64.zip

promtail-linux-amd64.zip

loki-linux-arm64.zip

loki-linux-amd64.zip

将 x86的截止放到 /usr/bin 目录下面

scp loki-linux-amd64 /usr/bin/loki

scp promtail-linux-amd64 /usr/bin/promtail
解压缩开启服务等
下载loki的配置文件:

地址为:

https://raw.githubusercontent.com/grafana/loki/main/examples/getting-started/loki-config.yaml

详细内容为:

mkdir /etc/loki

cat >/etc/loki/loki.yaml <<EOF

---

server:

  http_listen_port: 3100

#memberlist:

#  join_members:

#    - loki:7946

schema_config:

  configs:

    - from: 2021-08-01

      store: tsdb

      object_store: s3

      schema: v12

      index:

        prefix: index_

        period: 24h

common:

  path_prefix: /loki

  replication_factor: 1

  storage:

    s3:

      endpoint: minio:9000

      insecure: true

      bucketnames: loki-data

      access_key_id: loki

      secret_access_key: supersecret

      s3forcepathstyle: true

  ring:

    kvstore:

      store: memberlist

ruler:

  storage:

    s3:

      bucketnames: loki-ruler

EOF

启动服务:

nohup /usr/bin/loki  -config.file=/etc/loki/loki.yaml -auth.enabled=false &
配置promtail
cat >/etc/loki/promtail.yaml <<EOF

server:

  http_listen_port: 9080

  grpc_listen_port: 0

positions:

  filename: /tmp/positions.yaml

clients:

  - url: http://127.0.0.1:3100/loki/api/v1/push

scrape_configs:

- job_name: nginx

  static_configs:

  - targets:

      - localhost

    labels:

      job: nginx_logs

      __path__: /data/nginx/gscloudsu.log

EOF

# 启动服务

nohup /usr/bin/promtail  -config.file=/etc/loki/promtail.yaml &
数据源以及grafana的dashboard
增加 loki的数据源

增加 12559 的 2022年版本的json导入文件

注意不能选择新版本的. 新版本换了数据源.

todo:

1. loki 设置密码

2. nginx 的geoip的设置

3. 学习另外一个springboot的监控指标

https://grafana.com/grafana/dashboards/17175-spring-boot-observability/

https://github.com/blueswen/spring-boot-observability
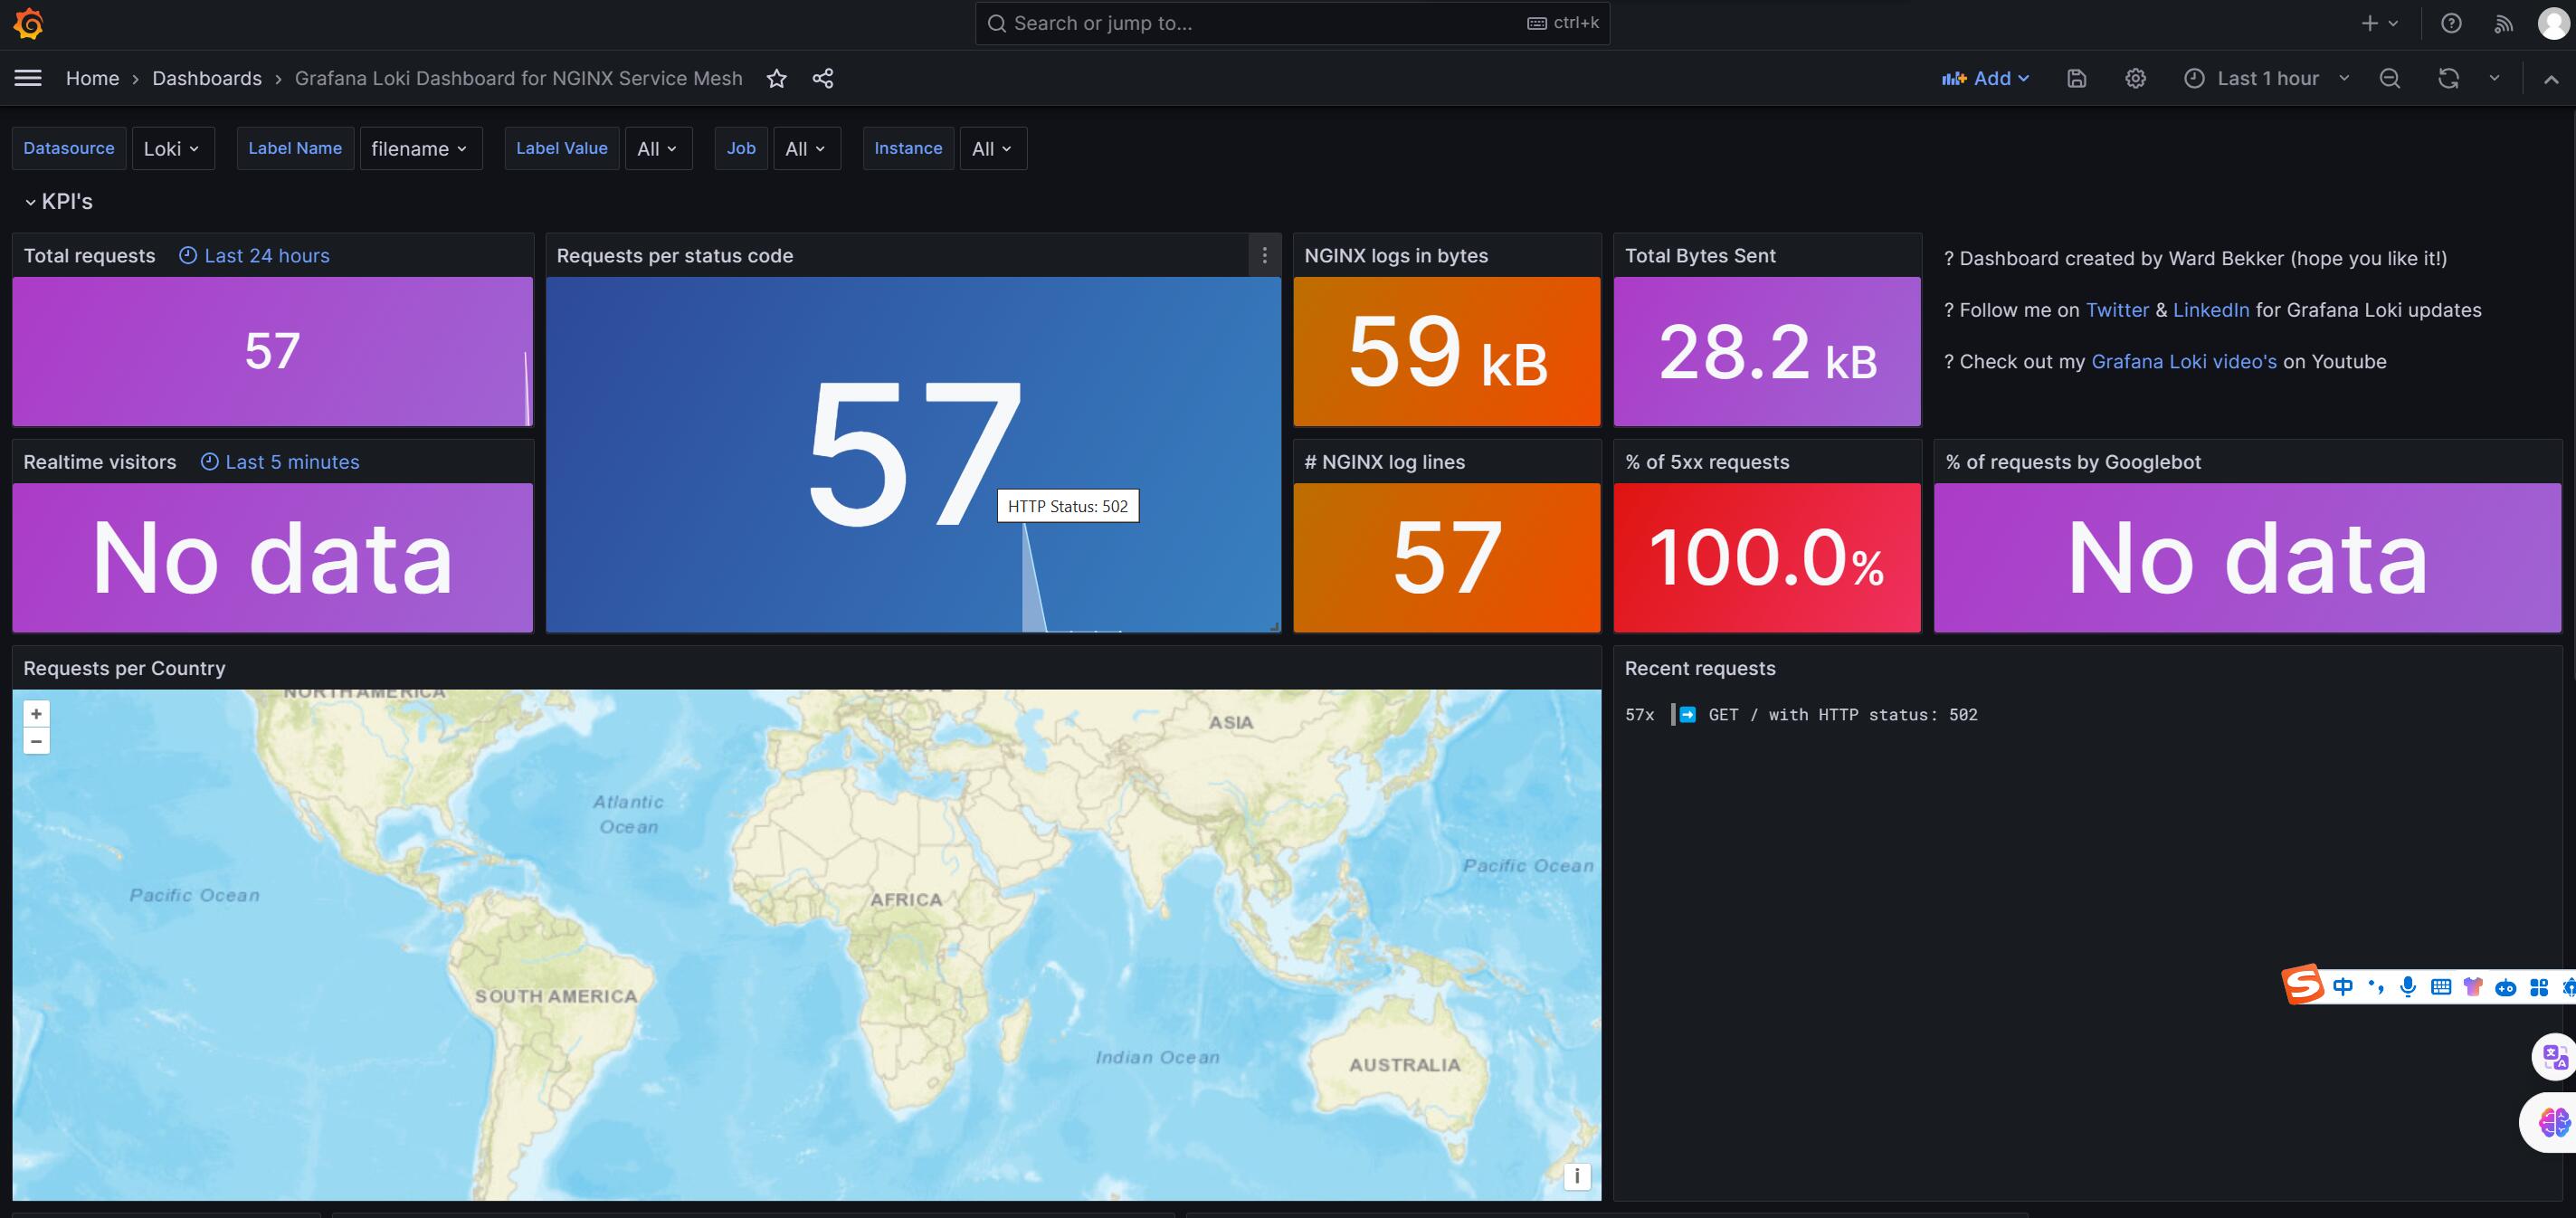
效果
Nginx loki监控日志的学习的更多相关文章
- ELK监控系统nginx / mysql慢日志
ELK监控系统nginx / mysql慢日志 elasticsearch logstash kibana ELK监控系统nginx日志 1.环境准备 centos6.8_64 mini IP:192 ...
- 学习总结 之 WebApi服务监控 log4net记录监控日志
在请求WebApi 的时候,我们更想知道在请求数据的时候,调用了哪个接口传了什么参数过来,调用这个Action花了多少时间,有没有人恶意请求.我们可以通过记录日志,对Action进行优化,可以通过日志 ...
- 写一个nginx监控日志
下面的代码是实现一个nginx监控日志功能,是不是很好玩呢.
- 使用 Loki 进行日志报警(二)
转载自:https://mp.weixin.qq.com/s?__biz=MzU4MjQ0MTU4Ng==&mid=2247492374&idx=1&sn=d09f6db623 ...
- 使用 Loki 进行日志报警(一)
转载自:https://mp.weixin.qq.com/s?__biz=MzU4MjQ0MTU4Ng==&mid=2247492352&idx=1&sn=9c0cc7927b ...
- zabbix监控日志文件
环境: 操作系统:centos 6.8 ,zabbix软件版本:zabbix 3.0.1 前提条件:zabbix客户端已经配置了主动模式,如何配置主动模式,请参考此文 监控日志keys 首先要了解k ...
- (72)zabbix监控日志文件 MySQL日志为例
一般情况下,日志最先反映出应用当前的问题,在海量日志里面找到我们异常记录,然后记录下来,并且根据情况报警,大家可以监控系统日志.nginx.Apache.业务日志. 这边我拿常见的MySQL日志做监控 ...
- Zabbix 监控MySQL、Apache、Nginx应用监控
zabbix对第三方应用软件的监控,主要有两个工作难点,一个是编写自定义监控脚本,另一个是在编写模板并导入zabbix web中,编写脚本这个要根据 监控需求定制即可,而编写模板文件有些难度,不过网上 ...
- nginx状态监控统计
nginx是一款很优秀的web服务器软件,很多地方都有接触和使用到他,大部分的场景压力还没达到需要调优的地步,而调优的难点其实不在于调,而在于各项状态的监控,能够很快的找到资源在什么时候出现问题,调整 ...
- nginx 配置文件与日志模块
内容概要 Nginx 虚拟主机 基于多 IP 的方式 基于多端口的方式 基于多域名的方式 日志配置(日志格式详解) Nginx 访问控制模块(可以去 Nginx.org 文档 documentatio ...
随机推荐
- Windows 设置 VMware workstation 虚拟机开机启动
参考 https://www.cnblogs.com/qmfsun/p/6284236.html http://www.cnblogs.com/eliteboy/p/7838091.html 司徒晓宇 ...
- ubuntu 20.0.4 LTS 配置国内apt-get源
https://blog.csdn.net/wangyijieonline/article/details/105360138 更换阿里源 要知道当前系统的代号,可以用以下命令: lsb_releas ...
- 关于helloworld
我们的helloworld是从一个源程序开始的,该源程序由程序员通过编译器创建并保存的文件,文件名就是hello.c.这个hello.c的源程序,实际上是有0和1组成的序列.每一个0和1都成为一位,这 ...
- 文心一言 VS 讯飞星火 VS chatgpt (42)-- 算法导论5.4 6题
六.假设将n个球投人 n 个箱子里,其中每次投球独立,并且每个球等可能落入任何箱子.空箱子的数目期望是多少?正好有一个球的箱子的数目期望是多少? 文心一言: 这是一个典型的概率问题.首先,我们可以通过 ...
- C++篇:第十三章_异常_知识点大全
C++篇为本人学C++时所做笔记(特别是疑难杂点),全是硬货,虽然看着枯燥但会让你收益颇丰,可用作学习C++的一大利器 十三.异常 ① 函数指针与该指针所指的函数必须具有一致的noexcept异常说明 ...
- 教你如何基于MindSpore进行ChatGLM微调
本文分享自华为云社区<基于MindSpore的ChatGLM微调>,作者: JeffDing . 基于MindSpore的ChatGLM微调 克隆Hugging Face模型 克隆chat ...
- 再拔头筹,FusionInsight为华为云大数据打造硬实力
摘要:在IDC2020大数据报告中,有云服务厂商.传统ICT 厂商,以及大数据时代的创企等三类"玩家",为何华为云能够脱颖而出? 近日,IDC发布<IDC MarketS ...
- CWE4.8:2022年危害最大的25种软件安全问题
摘要:我们来看下新版的<2022年危害最大的25种安全问题>在安全预防上会给了我们哪些安全提示. 本文分享自华为云社区<CWE4.8 -- 2022年危害最大的25种软件安全问题&g ...
- linux添加用户,修改用户密码,修改用户权限,设置root用户操作
1.添加普通用户 [root@server ~]# useradd chenjiafa //添加一个名为chenjiafa的用户[root@server ~]# passwd chenjiafa ...
- 1024程序员节献礼,火山引擎ByteHouse带来三重产品福利
更多技术交流.求职机会,欢迎关注字节跳动数据平台微信公众号,回复[1]进入官方交流. 随着信息技术飞速发展,互联网.Web3.物联网.人工智能相继出现. 在这近三十年的高速发展中,"程序 ...