ECharts 雷达图怎么在类目值下面显示数值
需要实现的效果:
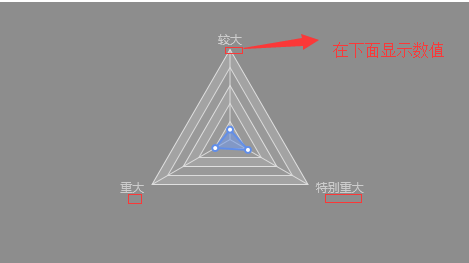
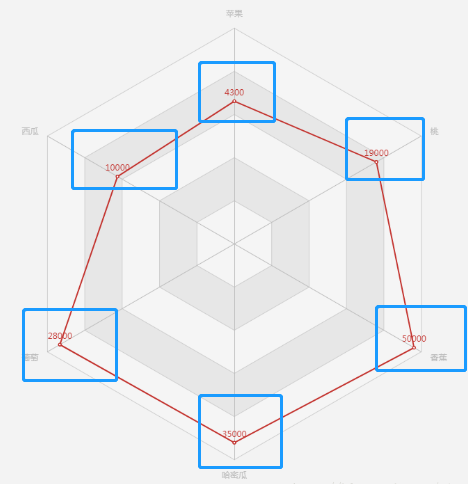
官网里面的demo显示数值,都是在拐点处:
【解决】
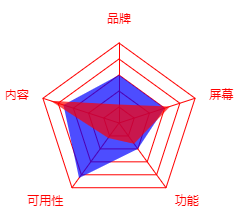
1、只显示类目
     <div id="mychart" style="width:300px;height:300px;margin:0 auto;"></div>

        <script>

            var arr1 = [60,73,85,40,60];

            var arr2 = [23,90,23,32,67];

            var mychart =  echarts.init(document.getElementById('mychart'));

            var option = {

                radar: [

                    {

                        indicator: [

                            {text: '品牌', max: 100},

                            {text: '内容', max: 100},

                            {text: '可用性', max: 100},

                            {text: '功能', max: 100},

                            {text: '屏幕', max: 100}

                        ],

                        center: ['50%','54%'],//调整雷达图的位置

                        radius: 80,//半径,可放大放小雷达图

                        axisLine: {//坐标轴线相关设置

                            show: true,

                            lineStyle: {

                                color: 'red'

                            }

                        },

                        splitLine : {

                            show : true,

                            lineStyle : {

                                width : 1,

                                color : 'red' // 图表背景网格线的颜色

                            }

                        },

                        splitArea: {

                            show: false,

                        },

                        name: {

                            rich: {

                                a: {

                                    color: 'red',

                                    lineHeight:

                                },

                            },

                            formatter: (a)=>{

                                return `{a|${a}}`

                            }

                        }

                    },

                ],

                series: [

                    {

                        type: 'radar',

                        symbol: 'none',//去掉拐点的圈

                        data: [

                            {

                                value: arr1,

                                name: '某软件',

                                areaStyle: {

                                    normal: {

                                        color: 'blue'

                                    }

                                },

                                lineStyle: {

                                    color:"rgba(255,255,255,0)"

                                },

                            },{

                                value: arr2,

                                name:'jja',

                                areaStyle: {

                                    normal: {

                                        color: 'red' // 图表中各个图区域的颜色

                                    }

                                },

                                lineStyle: {

                                    color:"rgba(255,255,255,0)" // 图表中各个图区域的边框线颜色

                                },

                            }

                        ]

                    },

                ]

            };

            mychart.setOption(option);

        </script>
实现效果:
2、实现最简单的数值在类目下
<div id="mychart" style="width:300px;height:300px;margin:0 auto;"></div>

        <script>

            var arr1 = [60,73,85,40,60];

            var arr2 = [23,90,23,32,67];

            var mychart =  echarts.init(document.getElementById('mychart'));

            var option = {

                radar: [

                    {

                        indicator: [

                            {text: '品牌', max: 100},

                            {text: '内容', max: 100},

                            {text: '可用性', max: 100},

                            {text: '功能', max: 100},

                            {text: '屏幕', max: 100}

                        ],

                        center: ['50%','54%'],//调整雷达图的位置

                        radius: 80,//半径,可放大放小雷达图

                        axisLine: {//坐标轴线相关设置

                            show: true,

                            lineStyle: {

                                color: 'red'

                            }

                        },

                        splitLine : {

                            show : true,

                            lineStyle : {

                                width : 1,

                                color : 'red' // 图表背景网格线的颜色

                            }

                        },

                        splitArea: {

                            show: false,

                        },

                        name: {

                            rich: {

                                a: {

                                    color: 'red',

                                    lineHeight:

                                },

                                b: {

                                    color: '#fff',

                                    align: 'center',

                                    backgroundColor: '#666',

                                    padding: ,

                                    borderRadius:

                                }

                            },

                            formatter: (a,b)=>{

                                return `{a|${a}}\n{b|}`

                            }

                        }

                    },

                ],

                series: [

                    {

                        type: 'radar',

                        symbol: 'none',//去掉拐点的圈

                        data: [

                            {

                                value: arr1,

                                name: '某软件',

                                areaStyle: {

                                    normal: {

                                        color: 'blue'

                                    }

                                },

                                lineStyle: {

                                    color:"rgba(255,255,255,0)"

                                },

                            },{

                                value: arr2,

                                name:'jja',

                                areaStyle: {

                                    normal: {

                                        color: 'red' // 图表中各个图区域的颜色

                                    }

                                },

                                lineStyle: {

                                    color:"rgba(255,255,255,0)" // 图表中各个图区域的边框线颜色

                                },

                            }

                        ]

                    },

                ]

            };

            mychart.setOption(option);

        </script>
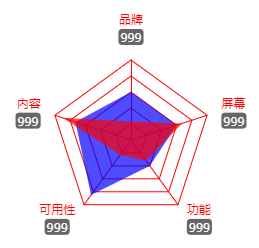
3、实现最终效果
<!DOCTYPE html>

<html>

    <head>

        <meta charset="UTF-8">

        <meta name="viewport" content="width=device-width,initial-scale=1.0">

        <title></title>

        <script src="js/jquery.min.js"></script>

        <script src="js/echarts.js"></script>

    </head>

    <body>

        <div id="mychart" style="width:300px;height:300px;margin:0 auto;"></div>

        <script>

            var arr1 = [,,,,];

            var arr2 = [,,,,];

            var mychart =  echarts.init(document.getElementById('mychart'));

            var option = {

                radar: [

                    {

                        indicator: [

                            {text: '品牌', max: 100},

                            {text: '内容', max: 100},

                            {text: '可用性', max: 100},

                            {text: '功能', max: 100},

                            {text: '屏幕', max: 100}

                        ],

                        center: ['50%','54%'],//调整雷达图的位置

                        radius: 80,//半径,可放大放小雷达图

                        axisLine: {//坐标轴线相关设置

                            show: true,

                            lineStyle: {

                                color: 'red'

                            }

                        },

                        splitLine : {

                            show : true,

                            lineStyle : {

                                width : 1,

                                color : 'red' // 图表背景网格线的颜色

                            }

                        },

                        splitArea: {

                            show: false,

                        },

                    },

                ],

                series: [

                    {

                        type: 'radar',

                        symbol: 'none',//去掉拐点的圈

                        data: [

                            {

                                value: arr1,

                                name: '某软件',

                                areaStyle: {

                                    normal: {

                                        color: 'blue'

                                    }

                                },

                                lineStyle: {

                                    color:"rgba(255,255,255,0)"

                                },

                            },{

                                value: arr2,

                                name:'jja',

                                areaStyle: {

                                    normal: {

                                        color: 'red' // 图表中各个图区域的颜色

                                    }

                                },

                                lineStyle: {

                                    color:"rgba(255,255,255,0)" // 图表中各个图区域的边框线颜色

                                },

                            }

                        ]

                    },

                ]

            };

            mychart.setOption(option);

            var i = -1;

            mychart.setOption({

                  radar: [

                    {

                        name: {

                            rich: {

                                a: {

                                    color: 'red',

                                    lineHeight:

                                },

                                b: {

                                    color: '#fff',

                                    align: 'center',

                                    backgroundColor: '#666',

                                    padding: ,

                                    borderRadius:

                                }

                            },

                            formatter: (a,b)=>{

                                i++;

                                return `{a|${a}}\n{b|${arr1[i]}}`

                            }

                        }

                    }

                ]

            })

        </script>

    </body>

</html>
效果:

ECharts 雷达图怎么在类目值下面显示数值的更多相关文章
- echarts雷达图
用echarts展现雷达图的定制 <!doctype html> <html> <head> <meta charset="utf-8"& ...
- echarts 雷达图的个性化设置
echarts 雷达图的个性化设置 function test() { let myChart = echarts.init(document.getElementById('levelImage') ...
- echarts雷达图点击事件
最近看见别人问的问题,点击雷达图的拐点,获取点击数据的问题,直接上代码. echarts配置问题:https://www.douban.com/note/509404582/ <!doctype ...
- echarts雷达图点击事件 包含(2.x,3.85,4.02)测试
最近看见别人问的问题,点击雷达图的拐点,获取点击数据的问题,直接上代码. echarts 2x 的点击事件 echarts配置问题:https://www.douban.com/note/509404 ...
- ECharts雷达图详细配置说明
雷达图表配置说明: // 指定图表的配置项和数据 var option = { backgroundColor: 'rgba(204,204,204,0.7 )', // 背景色,默认无背景 rgba ...
- Java生鲜电商平台-生鲜电商中商品类目、属性、品牌、单位架构设计与实战
Java生鲜电商平台-生鲜电商中商品类目.属性.品牌.单位架构设计与实战 说明:Java生鲜电商平台-生鲜电商中商品类目.属性.品牌.单位架构设计与实战经验分享 凡是涉及到购物,必然是建立在商品的基础 ...
- Echarts数据可视化series-radar雷达图,开发全解+完美注释
全栈工程师开发手册 (作者:栾鹏) Echarts数据可视化开发代码注释全解 Echarts数据可视化开发参数配置全解 6大公共组件详解(点击进入): title详解. tooltip详解.toolb ...
- 关于echarts生成雷达图的一些参数介绍
export const industryFactorOption = { title: { text: '雷达图', textStyle: { color: 'rgba(221,221,221,1) ...
- 解决echarts的叠堆折线图数据出现坐标和值对不上的问题
原文:https://blog.csdn.net/qq_36538012/article/details/88889545 ------------------------------- 说一个小bu ...
随机推荐
- Ubuntu 12.04 LTS 中文输入法的安装 (转载)
第一步:安装语言包 进入 “System Settings” 找到 “Language Support” 那一项,点击进入 选择 “Install/Remove Languages” 找到 “Chin ...
- 浅谈android代码保护技术_加固
可看原文: http://www.cnblogs.com/jiaoxiake/p/6536824.html 导语 我们知道Android中的反编译工作越来越让人操作熟练,我们辛苦的开发出一个apk,结 ...
- Asp.Net程序目录下文件夹或文件操作导致Session失效的解决方案
1.配置web.config <system.web> <sessionState mode="StateServer" stateConnectionStrin ...
- 20169219 SQL注入实验报告
实验介绍 SQL注入技术是利用web应用程序和数据库服务器之间的接口来篡改网站内容的攻击技术.通过把SQL命令插入到Web表单提交框.输入域名框或页面请求框中,最终欺骗服务器执行恶意的SQL命令. 在 ...
- 装饰(Decorator)模式
一. 装饰(Decorator)模式 装饰(Decorator)模式又名包装(Wrapper)模式[GOF95].装饰模式以对客户端透明的方式扩展对象的功能,是继承关系的一个替代方案. 二. 装饰模式 ...
- perationalError: (2003, "Can't connect to MySQL server on u'192.168.1.6' (timed out)")
在Ubuntu(192.168.1.20)中部署项目后,mysql还在另外一台windows(192.168.1.6)机子上,ping windows时可以ping通,但是访问项目提示: perati ...
- FileTracker:error FTK1011编译错误的原因和解决办法
原因: 今天创建好项目名字完成关了VS,后感觉文件夹名字不太对改了一下,后来程序就调试不了出现FileTracker:error FTK1011编译错误0.0,经过网络查询应该是路径问题 解决方法: ...
- go的同步模型
首先来看一段代码,这是The Go Memory Model一文中的一个例子 var a, b int func f() { a = 1 b = 2 } func g() { ...
- 趣图:快下班了,剩一个bug,修复一下再走
趣图:当我给老板展示我修复了那个 bug 时 趣图:当我以为这是最后一个Bug时……
- NetworkX初相识
听说NetworkX是一个很牛的复杂网络研究的工具,就来试一下吧. import networkx as nx G= nx.Graph()#建立一个空白的图 G.add_node("node ...