dev linechart动态加载数据(像股票一样的波动)
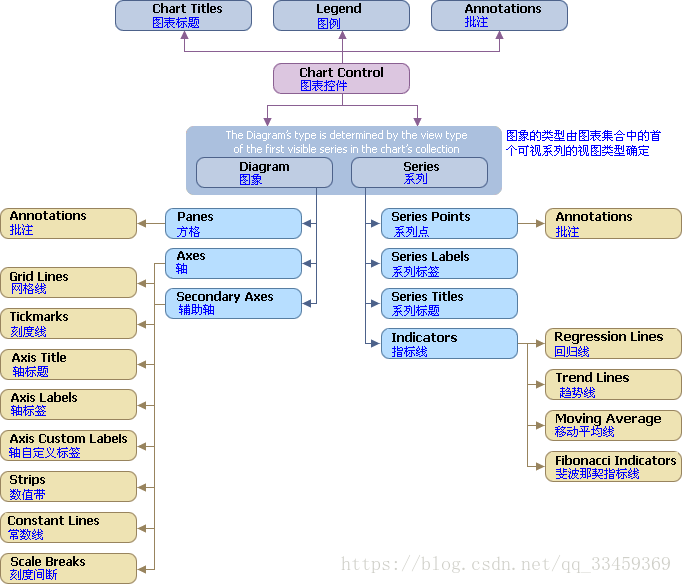
图片地址:https://blog.csdn.net/qq_33459369/article/details/80060196;(盗图)
接下来是封装的代码
#region 动态折线图

        public LineChartHelper(ChartControl chart)

        {

            LineSeriesView lineSeriesView = new LineSeriesView();

            chart.SeriesTemplate.View = lineSeriesView;

            //Legend的位置

            chart.Legend.AlignmentHorizontal = DevExpress.XtraCharts.LegendAlignmentHorizontal.Left;

            chart.Legend.AlignmentVertical = DevExpress.XtraCharts.LegendAlignmentVertical.TopOutside;

            chart.Legend.Direction = DevExpress.XtraCharts.LegendDirection.RightToLeft;

            //x轴为时间轴

            XYDiagram diagram = (XYDiagram)chart.Diagram;

            diagram.AxisX.DateTimeScaleOptions.MeasureUnit = DateTimeMeasureUnit.Millisecond;

            diagram.AxisX.DateTimeScaleOptions.ScaleMode = ScaleMode.Continuous;

        }

        public Series[] CreateSeries(ChartControl chart, List<string> names)

        {

            chart.Series.Clear();//清除Series

            int num = names.Count();

            Series[] series = new Series[num];

            for (int i = ; i < num; i++)

            {

                series[i] = CreateSeries(names[i], ViewType.Line);

            }

            return series;

        }

        /// <summary>

        /// 创建折线

        /// </summary>

        private Series CreateSeries(string caption, ViewType viewType)

        {

            Series series = new Series(caption, viewType);

            //必须设置ArgumentScaleType的类型,否则显示会转换为日期格式,导致不是希望的格式显示

            //也就是说,显示字符串的参数,必须设置类型为ScaleType.Qualitative

            series.ArgumentScaleType = ScaleType.Auto;

            series.LabelsVisibility = DevExpress.Utils.DefaultBoolean.True;//显示标注标签

            //回归线

            LineSeriesView lineSeriesView = new LineSeriesView();

            RegressionLine regressionLine = new RegressionLine();

            regressionLine.Name = caption + "";

            lineSeriesView.Indicators.AddRange(new DevExpress.XtraCharts.Indicator[] { regressionLine });

            series.View = lineSeriesView;

            return series;

        }

        /// <summary>

        /// 移除不在视图显示的Points数据

        /// </summary>

        /// <param name="series">曲线</param>

        /// <param name="minDate">时间线</param>

        public void RemovePoint(DateTime minDate, Series[] series)

        {

            int pointsToRemoveCount = ;//曲线节点数据

            foreach (SeriesPoint point in series[].Points)

            {

                if (point.DateTimeArgument < minDate)

                    pointsToRemoveCount++;

            }

            if (pointsToRemoveCount < series[].Points.Count)

            {

                pointsToRemoveCount--;

            }

            if (pointsToRemoveCount > )

            {

                for (int i = ; i < series.Count(); i++)

                {

                    series[i].Points.RemoveRange(, pointsToRemoveCount);

                }

            }

        }

        /// <summary>

        /// 添加数据到曲线节点

        /// </summary>

        public void AddPoints(Series series, DateTime argument, double value)

        {

            if (series.View is LineSeriesView)

            {

                series.Points.Add(new SeriesPoint(argument, value));

            }

        }

        /// <summary>

        /// 设置x轴数据

        /// </summary>

        public void SetX(ChartControl chart, DateTime minDate, DateTime argument)

        {

            XYDiagram diagram = (XYDiagram)chart.Diagram;

            if (diagram != null && (diagram.AxisX.DateTimeScaleOptions.MeasureUnit == DateTimeMeasureUnit.Millisecond || diagram.AxisX.DateTimeScaleOptions.ScaleMode == ScaleMode.Continuous))

            {

                diagram.AxisX.WholeRange.SetMinMaxValues(minDate, argument);

            }

        }

        /// <summary>

        /// 获取曲线的回归线

        /// </summary>

        public RegressionLine GetRegressionLine(Series series)

        {

            if (series != null)

            {

                SwiftPlotSeriesView swiftPlotView = series.View as SwiftPlotSeriesView;

                if (swiftPlotView != null)

                {

                    Console.Write(swiftPlotView.Indicators);

                    foreach (Indicator indicator in swiftPlotView.Indicators)

                    {

                        RegressionLine regressionLine = indicator as RegressionLine;

                        if (regressionLine != null)

                            return regressionLine;

                    }

                }

            }

            return null;

        }

        #endregion
调用代码
        private readonly Random random = new Random();

        private Series[] _series;

        private LineChartHelper _lineChartHelper;

        private int _num = ;

        public frmRealtimeLineChart()

        {

            InitializeComponent();

        }

        private void frmRealtimeLineChart_Load(object sender, EventArgs e)

        {

            Init();

        }

        private void Init()

        {

            _lineChartHelper = new LineChartHelper(chart);

            List<string> names = new List<string>() { "曲线一", "折线二", "数字三" };

            _series = _lineChartHelper.CreateSeries(chart, names);

            _num = names.Count();

            chart.SeriesSerializable = _series;

            XYDiagram diagram = (XYDiagram)chart.Diagram;

            diagram.AxisX.GridLines.MinorVisible = true;

            diagram.AxisX.GridLines.Visible = true;

            diagram.AxisX.Label.TextPattern = "@{A:HH:mm:ss}";

            diagram.AxisX.Title.Font = new System.Drawing.Font("Tahoma", 9F);

            diagram.AxisX.Title.Text = @"时间(分)";

            diagram.AxisX.Title.Visible = true;

            diagram.AxisX.VisibleInPanesSerializable = "-1";

            diagram.AxisX.WholeRange.Auto = true;

            diagram.AxisX.WholeRange.SideMarginsValue = ;

            diagram.AxisX.Interlaced = true;

            diagram.AxisY.WholeRange.AlwaysShowZeroLevel = false;

            diagram.AxisY.Title.Font = new System.Drawing.Font("Tahoma", 9F);

            diagram.AxisY.Title.Text = @"随机数";

            diagram.AxisY.Title.Visible = true;

            diagram.AxisY.VisibleInPanesSerializable = "-1";

        }

        private void timer_Tick(object sender, EventArgs e)

        {

            RealtimeChart();

        }

        private void RealtimeChart()

        {

            try

            {

                DateTime argument = DateTime.Now;//x轴

                for (int i = ; i < _num; i++)

                {

                    _lineChartHelper.AddPoints(_series[i], argument, CalculateNextValue());

                }

                DateTime minDate = argument.AddSeconds(-TimeInterval);//x轴时间曲度

                _lineChartHelper.RemovePoint(minDate, _series);

                _lineChartHelper.SetX(chart, minDate, argument);

            }

            catch (Exception ex)

            {

                Console.Write(ex);

            }

        }

        /// <summary>

        /// 随机数

        /// </summary>

        private double CalculateNextValue()

        {

            return Math.Round(random.NextDouble() * 100.0);

        }

        /// <summary>

        /// 间隔时间

        /// </summary>

        private int TimeInterval { get { return Convert.ToInt32(spnTimeInterval.EditValue); } }
直接拖入chart,选择折线图,效果如下:

dev linechart动态加载数据(像股票一样的波动)的更多相关文章
- AppCan学习笔记----关闭页面listview动态加载数据
AppCan页面关闭 AppCan 的页面是由两个HTML组成,如果要完全关闭的话需要在主HTML eg.index.html中关闭,关闭方法:appcan.window.close(-1); 管道 ...
- [JS前端开发] js/jquery控制页面动态加载数据 滑动滚动条自动加载事件
页面滚动动态加载数据,页面下拉自动加载内容 相信很多人都见过瀑布流图片布局,那些图片是动态加载出来的,效果很好,对服务器的压力相对来说也小了很多 有手机的相信都见过这样的效果:进入qq空间,向下拉动空 ...
- 微信小程序(五) 利用模板动态加载数据
利用模板动态加载数据,其实是对上一节静态数据替换成动态数据:
- mui 动态加载数据出现的问题处理 (silder轮播组件 indexedList索引列表 下拉刷新不能继续加载数据)
mui-slider 问题:动态给mui的图片轮播添加图片,轮播不滚动. 解决:最后把滚动轮播图片的mui(".mui-slider").slider({interval: 300 ...
- ASP.NET MVC动态加载数据
ASP.NET MVC动态加载数据,一般的做法是使用$.each方法来循环产生tabel: 你可以在html时先写下非动态的部分: Source Code 上图中,有一行代码: <tbody ...
- js实现滚动条来动态加载数据
主要angular2+es6 data:Array<any> //展示的数据 allData:Array<any> //全部的数据 size:number = 10 //每次动 ...
- js/jquery控制页面动态加载数据 滑动滚动条自动加载事件--转他人的
js/jquery控制页面动态加载数据 滑动滚动条自动加载事件--转他人的 相信很多人都见过瀑布流图片布局,那些图片是动态加载出来的,效果很好,对服务器的压力相对来说也小了很多 有手机的相信都见过这样 ...
- js动态加载数据并合并单元格
js动态加载数据合并单元格, 代码如下所示,可复制直接运行: <!DOCTYPE HTML> <html lang="en-US"> <head> ...
- 爬虫--selenuim和phantonJs处理网页动态加载数据的爬取
1.谷歌浏览器的使用 下载谷歌浏览器 安装谷歌访问助手 终于用上谷歌浏览器了.....激动 问题:处理页面动态加载数据的爬取 -1.selenium -2.phantomJs 1.selenium 二 ...
随机推荐
- ArcGIS超级工具SPTOOLS-制图篇
1.1 梯形接幅表的创建 视频:https://weibo.com/tv/v/Hvq9KzKKQ?fid=1034:4374886702060760 根据一个图层范围,生成接幅表,支持地图比例尺有1 ...
- arcgis的arcpy写入几何怎么创建一个空心面要素并读取几何和属性信息,根本不够管
转载请注明作者(独孤尚良dugushangliang)出处:https://blog.csdn.net/dugushangliang/article/details/83861447 这个我是没找到这 ...
- CentOS7 docker开启tcp端口并进行客户端远程连接
#docker版本:18.09.0,最好保证客户端端口和服务端端口相同 [root@Centos7 ~]# dockerd-ce -v Docker version , build 4d60db4 网 ...
- [Java复习] Spring IoC
1. Spring bean的生命周期? 1. 对Bean进行实例化(相当于new) 对于BeanFactory 当客户向容器请求一个尚未初始化的bean(或初始化bean需要注入另外一个尚未初始化的 ...
- Oracle查询序列和函数方法封装
工具方法: @Autowired private JdbcTemplate businessTpmeJdbcTemplate; @SuppressWarnings("deprecation& ...
- Vscode中打开、新建内部终端快捷键方法
设置->键盘快捷方式->搜索集成终端->切换集成终端/新建集成终端 Windows 电脑 组合键 说明 Ctrl + ~ 打开默认终端 Ctrl + Shift + ~ 新建新的终端 ...
- ES6、ES7、ES8、ES9、ES10
ES6新特性(2015) ES6的特性比较多,在 ES5 发布近 6 年(2009-11 至 2015-6)之后才将其标准化.两个发布版本之间时间跨度很大,所以ES6中的特性比较多.在这里列举几个常用 ...
- PJzhang:端口快速扫描工具masscan
猫宁!!! 参考:https://www.freebuf.com/sectool/112583.html github地址: https://github.com/robertdavidgraham/ ...
- 合并多个tensorflow模型的办法
直接上代码: import tensorflow as tf from tensorflow.python.tools import freeze_graph from tensorflow.pyth ...
- Centos7服务器环境搭建
1.Apache安装 yum install httpd systemctl start httpd.service #启动 systemctl stop httpd.service#停止 syste ...