
prometheus 集群
思路一
统一区域的监控目标,prometheus server两台监控相同的目标群体。

改变后

上面这个变化对于监控目标端,会多出一倍的查询请求,但在一台prometheus server宕机的情况下,可以不影响监控。
思路二
这是一个金字塔式的层次结构,而不是分布式层次结构。Prometheus 的抓取请求也会加载到prometheus work节点上,这是需要考虑的。
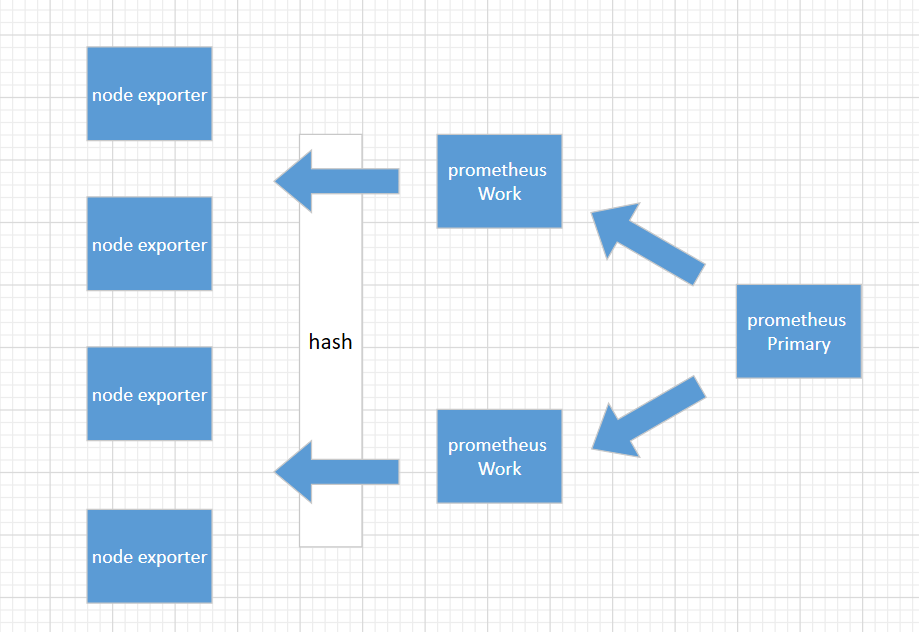
上面这种模式,准备3台prometheus server进行搭建,这种方式work节点一台宕机后,其它wokr节点不会去接手故障work节点的机器。
1、环境准备
192.168.31.151(primary)
192.168.31.144 (worker)
192.168.31.82(worker)
2、部署prometheus
cd /usr/loacl

tar -xvf prometheus-2.8.0.linux-amd64.tar.gz

ln -s /usr/local/prometheus-2.8.0.linux-amd64 /usr/local/prometheus

cd /usr/local/prometheus;mkdir bin conf data

mv ./promtool bin

mv ./prometheus bin

mv ./prometheus.yml conf
3、worker节点配置(192.168.31.144)
prometheus.yml
# my global config

global:

  scrape_interval:     15s # Set the scrape interval to every 15 seconds. Default is every 1 minute.

  evaluation_interval: 15s # Evaluate rules every 15 seconds. The default is every 1 minute.

  external_labels:

    worker: 0

# Alertmanager configuration

alerting:

  alertmanagers:

  - static_configs:

    - targets:

      # - alertmanager:9093

# Load rules once and periodically evaluate them according to the global 'evaluation_interval'.

rule_files:

  - "rules/*_rules.yml"

# A scrape configuration containing exactly one endpoint to scrape:

# Here it's Prometheus itself.

scrape_configs:

  # The job name is added as a label `job=<job_name>` to any timeseries scraped from this config.

  - job_name: 'prometheus'

    static_configs:

    - targets:

      - 192.168.31.151:9090

      - 192.168.31.144:9090

      - 192.168.31.82:9090

    relabel_configs:

    - source_labels: [__address__]

      modulus: 2

      target_label: __tmp_hash

      action: hashmod

    - source_labels: [__tmp_hash]

      regex: ^0$

      action: keep

  - job_name: 'node_exporter'

    file_sd_configs:

      - files:

        - targets/nodes/*.json

        refresh_interval: 1m

    relabel_configs:

    - source_labels: [__address__]

      modulus: 2

      target_label: __tmp_hash

      action: hashmod

    - source_labels: [__tmp_hash]

      regex: ^0$

      action: keep

  - job_name: 'docker'

    file_sd_configs:

      - files:

        - targets/docker/*.json

        refresh_interval: 1m

    relabel_configs:

    - source_labels: [__address__]

      modulus: 2

      target_label: __tmp_hash

      action: hashmod

    - source_labels: [__tmp_hash]

      regex: ^0$

      action: keep

  - job_name: 'alertmanager'

    static_configs:

    - targets:

      - 192.168.31.151:9093

      - 192.168.31.144:9093

    relabel_configs:

    - source_labels: [__address__]

      modulus: 2

      target_label: __tmp_hash

      action: hashmod

    - source_labels: [__tmp_hash]

      regex: ^0$

      action: keep
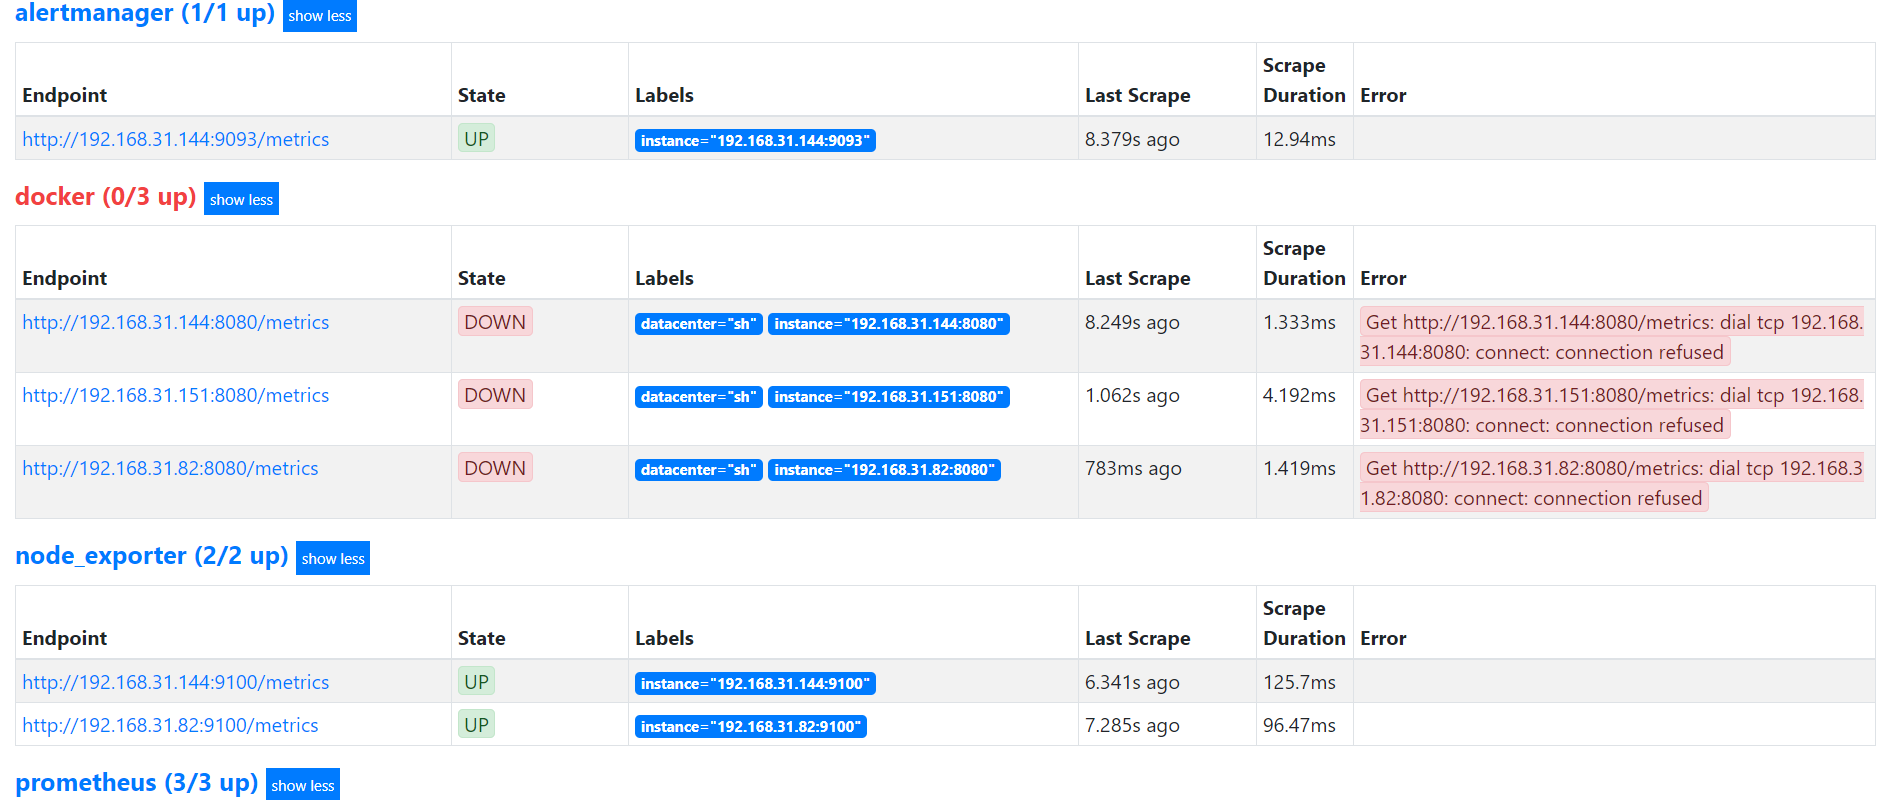
worker节点配置(192.168.31.82)
prometheus.yml
# my global config

global:

  scrape_interval:     15s # Set the scrape interval to every 15 seconds. Default is every 1 minute.

  evaluation_interval: 15s # Evaluate rules every 15 seconds. The default is every 1 minute.

  external_labels:

    worker: 1

# Alertmanager configuration

alerting:

  alertmanagers:

  - static_configs:

    - targets:

      # - alertmanager:9093

# Load rules once and periodically evaluate them according to the global 'evaluation_interval'.

rule_files:

  - "rules/*_rules.yml"

# A scrape configuration containing exactly one endpoint to scrape:

# Here it's Prometheus itself.

scrape_configs:

  # The job name is added as a label `job=<job_name>` to any timeseries scraped from this config.

  - job_name: 'prometheus'

    static_configs:

    - targets:

      - 192.168.31.151:9090

      - 192.168.31.144:9090

      - 192.168.31.82:9090

    relabel_configs:

    - source_labels: [__address__]

      modulus: 2

      target_label: __tmp_hash

      action: hashmod

    - source_labels: [__tmp_hash]

      regex: ^1$

      action: keep

  - job_name: 'node_exporter'

    file_sd_configs:

      - files:

        - targets/nodes/*.json

        refresh_interval: 1m

    relabel_configs:

    - source_labels: [__address__]

      modulus: 2

      target_label: __tmp_hash

      action: hashmod

    - source_labels: [__tmp_hash]

      regex: ^1$

      action: keep

  - job_name: 'docker'

    file_sd_configs:

      - files:

        - targets/docker/*.json

        refresh_interval: 1m

    relabel_configs:

    - source_labels: [__address__]

      modulus: 2

      target_label: __tmp_hash

      action: hashmod

    - source_labels: [__tmp_hash]

      regex: ^1$

      action: keep

  - job_name: 'alertmanager'

    static_configs:

    - targets:

      - 192.168.31.151:9093

      - 192.168.31.144:9093

    relabel_configs:

    - source_labels: [__address__]

      modulus: 2

      target_label: __tmp_hash

      action: hashmod

    - source_labels: [__tmp_hash]

      regex: ^1$

      action: keep
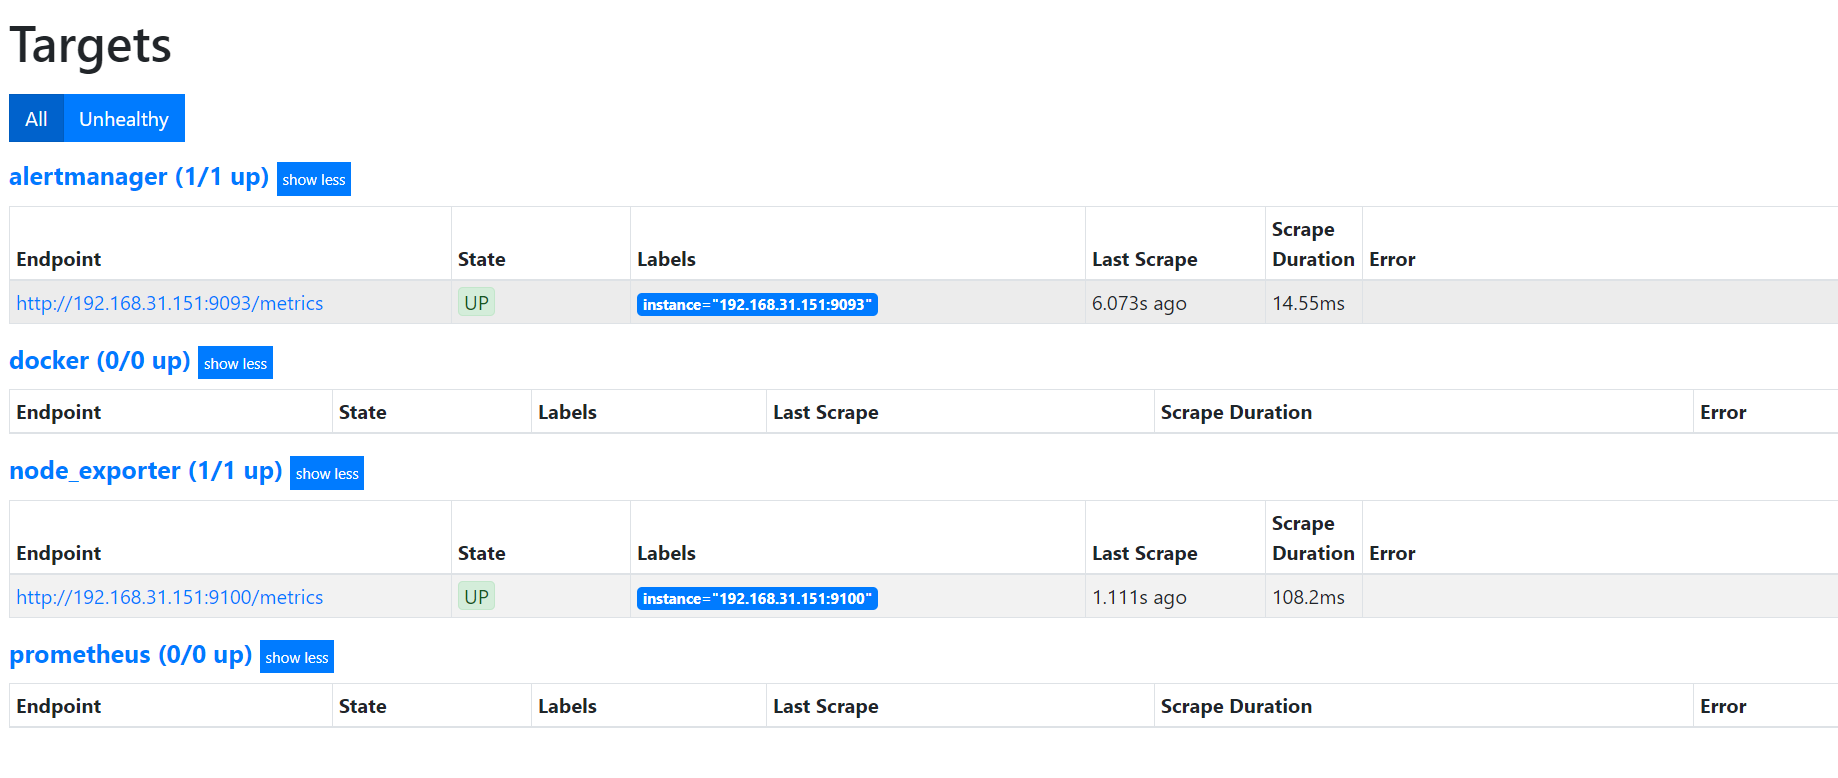
primary节点配置(192.168.31.151)
prometheus.yml
# my global config

global:

  scrape_interval:     15s # Set the scrape interval to every 15 seconds. Default is every 1 minute.

  evaluation_interval: 15s # Evaluate rules every 15 seconds. The default is every 1 minute.

  # scrape_timeout is set to the global default (10s).

# Alertmanager configuration

alerting:

  alertmanagers:

  - static_configs:

    - targets:

      - 192.168.31.151:9093

      - 192.168.31.144:9093

# Load rules once and periodically evaluate them according to the global 'evaluation_interval'.

rule_files:

  - "rules/*_alerts.yml"

# A scrape configuration containing exactly one endpoint to scrape:

# Here it's Prometheus itself.

scrape_configs:

  - job_name: 'node_workers'

    file_sd_configs:

      - files:

        - 'targets/workers/*.json'

        refresh_interval: 5m

    honor_labels: true

    metrics_path: /federate

    params:

      'match[]':

         - '{__name__=~"^instance:.*"}'
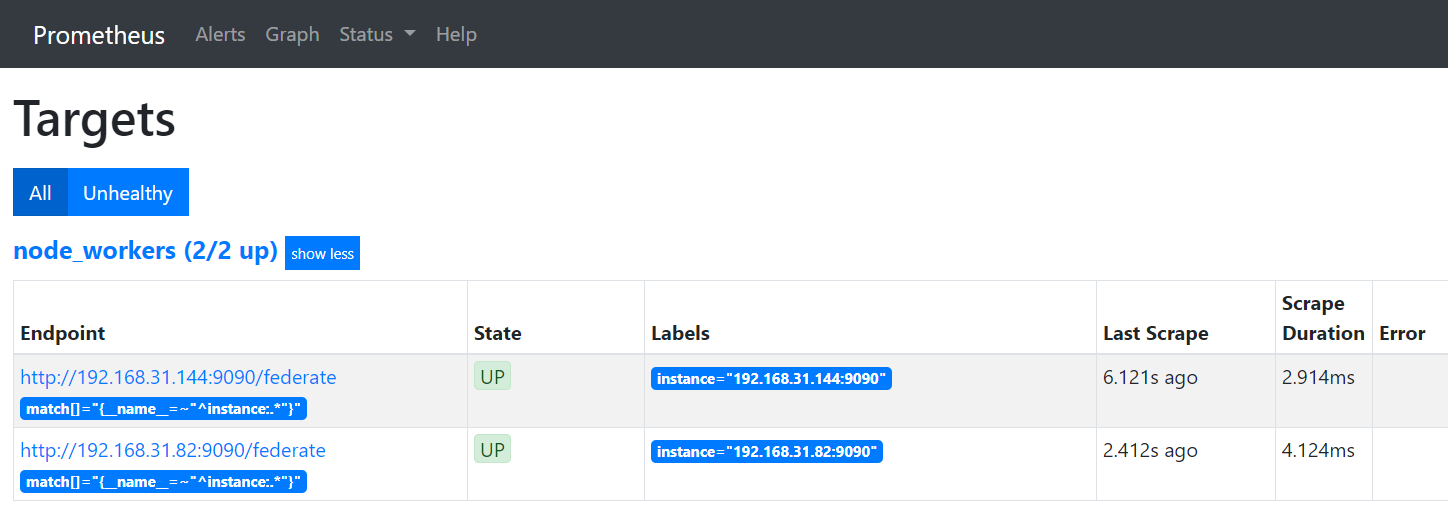
cat ./targets/workers/workers.json
[{

  "targets": [

    "192.168.31.144:9090",

    "192.168.31.82:9090"

  ]

}]
prometheus 集群的更多相关文章
- Prometheus集群介绍-1
Prometheus监控介绍 公司做教育的,要迁移上云,所以需要我这边从零开始调研加后期维护Prometheus:近期看过二本方面的prometheus书籍,一本是深入浅出一般是实战方向的:官方文档主 ...
- Thanos prometheus 集群以及多租户解决方案docker-compose 试用(一)
prometheus 是一个非常不多的metrics 监控解决方案,但是对于ha 以及多租户的处理并不是很好,当前有好多解决方案 cortex Thanos prometheus+ influxdb ...
- 部署prometheus监控kubernetes集群并存储到ceph
简介 Prometheus 最初是 SoundCloud 构建的开源系统监控和报警工具,是一个独立的开源项目,于2016年加入了 CNCF 基金会,作为继 Kubernetes 之后的第二个托管项目. ...
- 如何扩展单个Prometheus实现近万Kubernetes集群监控?
引言 TKE团队负责公有云,私有云场景下近万个集群,数百万核节点的运维管理工作.为了监控规模如此庞大的集群联邦,TKE团队在原生Prometheus的基础上进行了大量探索与改进,研发出一套可扩展,高可 ...
- 如何用Prometheus监控十万container的Kubernetes集群
概述 不久前,我们在文章<如何扩展单个Prometheus实现近万Kubernetes集群监控?>中详细介绍了TKE团队大规模Kubernetes联邦监控系统Kvass的演进过程,其中介绍 ...
- vivo 容器集群监控系统架构与实践
vivo 互联网服务器团队-YuanPeng 一.概述 从容器技术的推广以及 Kubernetes成为容器调度管理领域的事实标准开始,云原生的理念和技术架构体系逐渐在生产环境中得到了越来越广泛的应用实 ...
- 如何使用helm优雅安装prometheus-operator,并监控k8s集群微服务
前言:随着云原生概念盛行,对于容器.服务.节点以及集群的监控变得越来越重要.Prometheus 作为 Kubernetes 监控的事实标准,有着强大的功能和良好的生态.但是它不支持分布式,不支持数据 ...
- Kubernetes集群部署史上最详细(二)Prometheus监控Kubernetes集群
使用Prometheus监控Kubernetes集群 监控方面Grafana采用YUM安装通过服务形式运行,部署在Master上,而Prometheus则通过POD运行,Grafana通过使用Prom ...
- Prometheus监控elasticsearch集群(以elasticsearch-6.4.2版本为例)
部署elasticsearch集群,配置文件可"浓缩"为以下: cluster.name: es_cluster node.name: node1 path.data: /app/ ...
随机推荐
- (最完美)MIUI12系统的Usb调试模式在哪里开启的步骤
当我们使用安卓手机通过数据线链接到Pc的时候,或者使用的有些app比如我们公司营销小组当使用的app引号精灵,之前的老版本就需要开启usb调试模式下使用,现当新版本不需要了,如果手机没有开启usb调试 ...
- 深圳共创力咨询《成功的产品经理DNA》公开课3月29~30日在深圳开课!
课时:13小时(2天) 成功的产品经理DNA 讲师: 冯老师 时间:2019.03.29~30 举办单位:深圳市共创力企业管理咨询有限公司 举办地点:深圳 [课程背景] 当今时代,供过于求. ...
- LNMP环境下部署搭建wordpress
1. 下载WordPress安装包 访问官方网站https://cn.wordpress.org/ 点击Download.tar.gz下载linux平台安装包 2. 安装软件 2.1.上传安装包 使用 ...
- anki server 错误与解决
anki 客户端 转载请注明出处 :http://www.cnblogs.com/qq-757617012/ 1.无法同步 是否突然停电,导致程序损坏(提示被防火墙或杀毒软件阻止) anki客 ...
- 吴军武志红万维刚薛兆丰何帆曾鸣李笑来罗永浩等得到APP专栏作者的书3
整理了一下最近两三年内看过的得到APP专栏与课程作者的得到精选文集和他们写过的书共本.新增吴军1本,武志红1本. 其中:武志红3本,熊太行1本,薛兆丰2本,吴军4本,何帆3本,曾鸣2本,万维刚1本,李 ...
- ubuntu安装Nginx
什么都不说了 直接干 一.安装Nginx 首先从Nginx的官网下载最新的稳定版本1.14.0:nginx 1.解压安装包 1.root@ubuntu:tar -zxf nginx-1.14.0.ta ...
- RocketMQ4.3.X关于设置useEpollNativeSelector = true报错问题
前一阵子刚整理完RocketMQ4.3.x版本的相关配置的工作,接下来就来测试一下改变参数会带来什么好的结果 首先我就选中了useEpollNativeSelector 这个参数 默认这个参数是 fa ...
- Web Storage:浏览器端数据储存机制
目录 概述 操作方法 存入/读取数据 清除数据 遍历操作 storage事件 参考链接 概述 这个API的作用是,使得网页可以在浏览器端储存数据.它分成两类:sessionStorage和localS ...
- ASP.NET Core 2.1与2.2 SignalR CORS 跨域问题
将 SignalR 集成到 ASP.NET Core api 程序的时候,按照官方 DEMO 配置完成,本地访问没有问题,但是发布之后一直报跨域问题,本地是这样设置的: Asp.net core 2. ...
- mybatis insertUseGeneratedKeys 返回主键为null
package tk.mybatis.mapper.common.special; import org.apache.ibatis.annotations.InsertProvider; impor ...