附014.Kubernetes Prometheus+Grafana+EFK+Kibana+Glusterfs整合性方案
一 glusterfs存储集群部署
1.1 架构示意
1.2 相关规划
|
主机
|
IP
|
磁盘
|
备注
|
|
k8smaster01
|
172.24.8.71
|
——
|
Kubernetes Master节点
Heketi主机
|
|
k8smaster02
|
172.24.8.72
|
——
|
Kubernetes Master节点
Heketi主机
|
|
k8smaster03
|
172.24.8.73
|
——
|
Kubernetes Master节点
Heketi主机
|
|
k8snode01
|
172.24.8.74
|
sdb
|
Kubernetes Worker节点
glusterfs 01节点
|
|
k8snode02
|
172.24.8.75
|
sdb
|
Kubernetes Worker节点
glusterfs 02节点
|
|
k8snode03
|
172.24.8.76
|
sdb
|
Kubernetes Worker节点
glusterfs 03节点
|
1.3 安装glusterfs
1.4 添加信任池
1.5 安装heketi
1.6 配置heketi
 {

   "_port_comment": "Heketi Server Port Number",

   "port": "",

   "_use_auth": "Enable JWT authorization. Please enable for deployment",

   "use_auth": true,

   "_jwt": "Private keys for access",

   "jwt": {

     "_admin": "Admin has access to all APIs",

     "admin": {

       "key": "admin123"

     },

     "_user": "User only has access to /volumes endpoint",

     "user": {

       "key": "xianghy"

     }

   },

   "_glusterfs_comment": "GlusterFS Configuration",

   "glusterfs": {

     "_executor_comment": [

       "Execute plugin. Possible choices: mock, ssh",

       "mock: This setting is used for testing and development.",

       "      It will not send commands to any node.",

       "ssh:  This setting will notify Heketi to ssh to the nodes.",

       "      It will need the values in sshexec to be configured.",

       "kubernetes: Communicate with GlusterFS containers over",

       "            Kubernetes exec api."

     ],

     "executor": "ssh",

     "_sshexec_comment": "SSH username and private key file information",

     "sshexec": {

       "keyfile": "/etc/heketi/heketi_key",

       "user": "root",

       "port": "",

       "fstab": "/etc/fstab"

     },

     "_db_comment": "Database file name",

     "db": "/var/lib/heketi/heketi.db",

     "_loglevel_comment": [

       "Set log level. Choices are:",

       "  none, critical, error, warning, info, debug",

       "Default is warning"

     ],

     "loglevel" : "warning"

   }

 }
1.7 配置免秘钥
1.8 启动heketi
1.9 配置Heketi拓扑
 {

   "clusters": [

     {

       "nodes": [

         {

           "node": {

             "hostnames": {

               "manage": [

                 "k8snode01"

               ],

               "storage": [

                 "172.24.8.74"

               ]

             },

             "zone": 1

           },

           "devices": [

             "/dev/sdb"

           ]

         },

         {

           "node": {

             "hostnames": {

               "manage": [

                 "k8snode02"

               ],

               "storage": [

                 "172.24.8.75"

               ]

             },

             "zone": 1

           },

           "devices": [

             "/dev/sdb"

           ]

         },

         {

           "node": {

             "hostnames": {

               "manage": [

                 "k8snode03"

               ],

               "storage": [

                 "172.24.8.76"

               ]

             },

             "zone": 1

           },

           "devices": [

             "/dev/sdb"

           ]

         }

       ]

     }

   ]

 }
1.10 集群管理及测试
1.11 创建StorageClass
 apiVersion: v1

 kind: Secret

 metadata:

   name: heketi-secret

   namespace: heketi

 data:

   key: YWRtaW4xMjM=

 type: kubernetes.io/glusterfs
 apiVersion: storage.k8s.io/v1

 kind: StorageClass

 metadata:

   name: ghstorageclass

 parameters:

   resturl: "http://172.24.8.71:8080"

   clusterid: "ad0f81f75f01d01ebd6a21834a2caa30"

   restauthenabled: "true"

   restuser: "admin"

   secretName: "heketi-secret"

   secretNamespace: "heketi"

   volumetype: "replicate:3"

 provisioner: kubernetes.io/glusterfs

 reclaimPolicy: Delete
二 集群监控Metrics
2.1 开启聚合层
2.2 获取部署文件
 ……

         image: mirrorgooglecontainers/metrics-server-amd64:v0.3.6	#修改为国内源

         command:

         - /metrics-server

         - --metric-resolution=30s

         - --kubelet-insecure-tls

         - --kubelet-preferred-address-types=InternalIP,Hostname,InternalDNS,ExternalDNS,ExternalIP	#添加如上command

 ……
2.3 正式部署
2.4 确认验证
三 Prometheus部署
3.1 获取部署文件
3.2 创建命名空间
 apiVersion: v1

 kind: Namespace

 metadata:

   name: monitoring
3.3 创建RBAC
 apiVersion: rbac.authorization.k8s.io/v1beta1

 kind: ClusterRole

 metadata:

   name: prometheus

 rules:

 - apiGroups: [""]

   resources:

   - nodes

   - nodes/proxy

   - services

   - endpoints

   - pods

   verbs: ["get", "list", "watch"]

 - apiGroups:

   - extensions

   resources:

   - ingresses

   verbs: ["get", "list", "watch"]

 - nonResourceURLs: ["/metrics"]

   verbs: ["get"]

 ---

 apiVersion: v1

 kind: ServiceAccount

 metadata:

   name: prometheus

   namespace: monitoring               #仅需修改命名空间

 ---

 apiVersion: rbac.authorization.k8s.io/v1beta1

 kind: ClusterRoleBinding

 metadata:

   name: prometheus

 roleRef:

   apiGroup: rbac.authorization.k8s.io

   kind: ClusterRole

   name: prometheus

 subjects:

 - kind: ServiceAccount

   name: prometheus

   namespace: monitoring              #仅需修改命名空间
3.4 创建Prometheus ConfigMap
 apiVersion: v1

 kind: ConfigMap

 metadata:

   name: prometheus-server-conf

   labels:

     name: prometheus-server-conf

   namespace: monitoring               #修改命名空间

 ……
3.5 创建持久PVC
 apiVersion: v1

 kind: PersistentVolumeClaim

 metadata:

   name: prometheus-pvc

   namespace: monitoring

   annotations:

     volume.beta.kubernetes.io/storage-class: ghstorageclass

 spec:

   accessModes:

   - ReadWriteMany

   resources:

     requests:

       storage: 5Gi
3.6 Prometheus部署
 apiVersion: apps/v1beta2

 kind: Deployment

 metadata:

   labels:

     name: prometheus-deployment

   name: prometheus-server

   namespace: monitoring

 spec:

   replicas: 1

   selector:

     matchLabels:

       app: prometheus-server

   template:

     metadata:

       labels:

         app: prometheus-server

     spec:

       containers:

         - name: prometheus-server

           image: prom/prometheus:v2.14.0

           command:

           - "/bin/prometheus"

           args:

             - "--config.file=/etc/prometheus/prometheus.yml"

             - "--storage.tsdb.path=/prometheus/"

             - "--storage.tsdb.retention=72h"

           ports:

             - containerPort: 9090

               protocol: TCP

           volumeMounts:

             - name: prometheus-config-volume

               mountPath: /etc/prometheus/

             - name: prometheus-storage-volume

               mountPath: /prometheus/

       serviceAccountName: prometheus

       imagePullSecrets:

         - name: regsecret

       volumes:

         - name: prometheus-config-volume

           configMap:

             defaultMode: 420

             name: prometheus-server-conf

         - name: prometheus-storage-volume

           persistentVolumeClaim:

             claimName: prometheus-pvc
3.7 创建Prometheus Service
 apiVersion: v1

 kind: Service

 metadata:

   labels:

     app: prometheus-service

   name: prometheus-service

   namespace: monitoring

 spec:

   type: NodePort

   selector:

     app: prometheus-server

   ports:

     - port: 9090

       targetPort: 9090

       nodePort: 30001
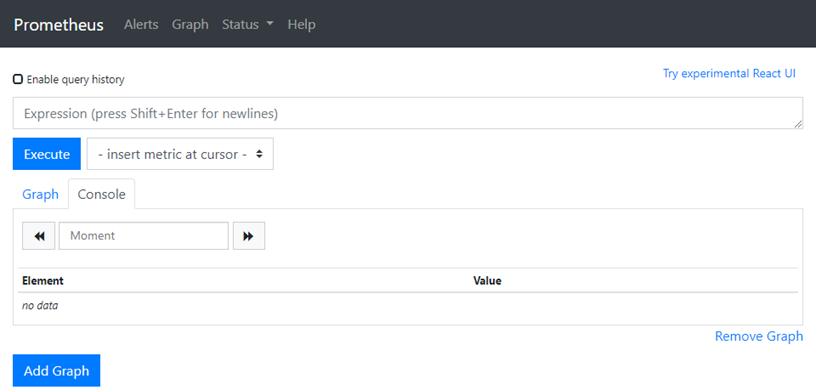
3.8 确认验证Prometheus
四 部署grafana
4.1 获取部署文件
4.2 创建持久PVC
 apiVersion: v1

 kind: PersistentVolumeClaim

 metadata:

   name: grafana-data-pvc

   namespace: monitoring

   annotations:

     volume.beta.kubernetes.io/storage-class: ghstorageclass

 spec:

   accessModes:

   - ReadWriteOnce

   resources:

     requests:

       storage: 5Gi
4.3 grafana部署
 apiVersion: extensions/v1beta1

 kind: Deployment

 metadata:

   name: monitoring-grafana

   namespace: monitoring

 spec:

   replicas: 1

   template:

     metadata:

       labels:

         task: monitoring

         k8s-app: grafana

     spec:

       containers:

       - name: grafana

         image: grafana/grafana:6.5.0

         imagePullPolicy: IfNotPresent

         ports:

         - containerPort: 3000

           protocol: TCP

         volumeMounts:

         - mountPath: /var/lib/grafana

           name: grafana-storage

         env:

           - name: INFLUXDB_HOST

             value: monitoring-influxdb

           - name: GF_SERVER_HTTP_PORT

             value: ""

           - name: GF_AUTH_BASIC_ENABLED

             value: "false"

           - name: GF_AUTH_ANONYMOUS_ENABLED

             value: "true"

           - name: GF_AUTH_ANONYMOUS_ORG_ROLE

             value: Admin

           - name: GF_SERVER_ROOT_URL

             value: /

         readinessProbe:

           httpGet:

             path: /login

             port: 3000

       volumes:

       - name: grafana-storage

         persistentVolumeClaim:

           claimName: grafana-data-pvc

       nodeSelector:

         node-role.kubernetes.io/master: "true"

       tolerations:

       - key: "node-role.kubernetes.io/master"

         effect: "NoSchedule"

 ---

 apiVersion: v1

 kind: Service

 metadata:

   labels:

     kubernetes.io/cluster-service: 'true'

     kubernetes.io/name: monitoring-grafana

   annotations:

     prometheus.io/scrape: 'true'

     prometheus.io/tcp-probe: 'true'

     prometheus.io/tcp-probe-port: '80'

   name: monitoring-grafana

   namespace: monitoring

 spec:

   type: NodePort

   ports:

   - port: 80

     targetPort: 3000

     nodePort: 30002

   selector:

     k8s-app: grafana
4.4 确认验证Prometheus
4.4 grafana配置
- 添加数据源:略
- 创建用户:略
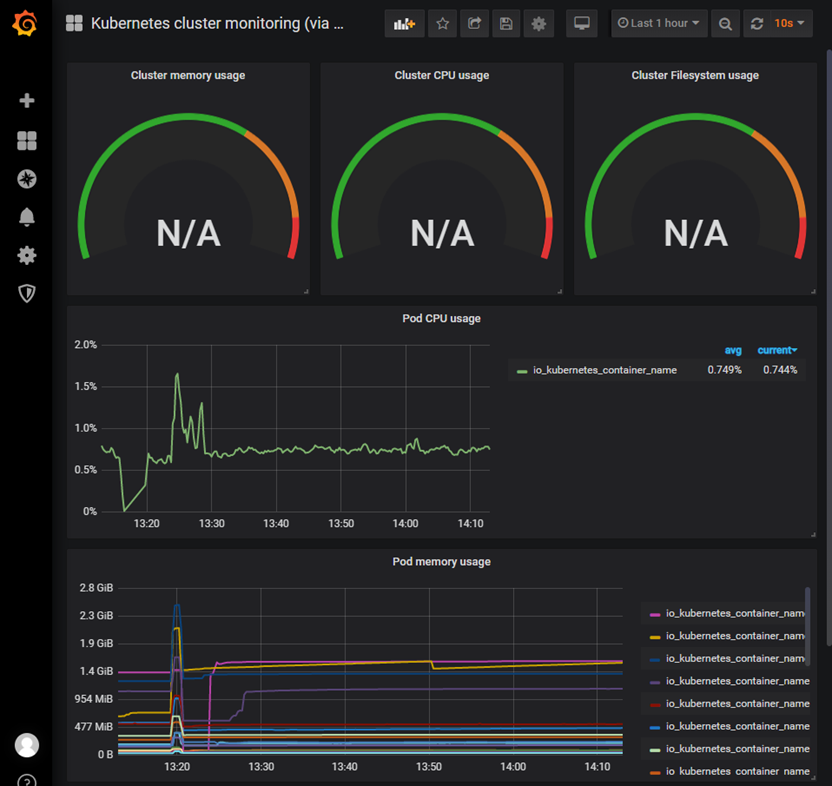
4.5 查看监控
附014.Kubernetes Prometheus+Grafana+EFK+Kibana+Glusterfs整合性方案的更多相关文章
- 附014.Kubernetes Prometheus+Grafana+EFK+Kibana+Glusterfs整合解决方案
一 glusterfs存储集群部署 注意:以下为简略步骤,详情参考<附009.Kubernetes永久存储之GlusterFS独立部署>. 1.1 架构示意 略 1.2 相关规划 主机 I ...
- Kubernetes+Prometheus+Grafana部署笔记
一.基础概念 1.1 基础概念 Kubernetes(通常写成“k8s”)Kubernetes是Google开源的容器集群管理系统.其设计目标是在主机集群之间提供一个能够自动化部署.可拓展.应用容器可 ...
- Kubernetes使用prometheus+grafana做一个简单的监控方案
前言 本文介绍在k8s集群中使用node-exporter.prometheus.grafana对集群进行监控.其实现原理有点类似ELK.EFK组合.node-exporter组件负责收集节点上的me ...
- Kubernetes prometheus+grafana k8s 监控
参考: https://www.cnblogs.com/terrycy/p/10058944.html https://www.cnblogs.com/weiBlog/p/10629966.html ...
- 附024.Kubernetes全系列大总结
Kubernetes全系列总结如下,后期不定期更新.欢迎基于学习.交流目的的转载和分享,禁止任何商业盗用,同时希望能带上原文出处,尊重ITer的成果,也是尊重知识.若发现任何错误或纰漏,留言反馈或右侧 ...
- SpringBoot+Prometheus+Grafana实现应用监控和报警
一.背景 SpringBoot的应用监控方案比较多,SpringBoot+Prometheus+Grafana是目前比较常用的方案之一.它们三者之间的关系大概如下图: 关系图 二.开发SpringBo ...
- 使用 Prometheus + Grafana 对 Kubernetes 进行性能监控的实践
1 什么是 Kubernetes? Kubernetes 是 Google 开源的容器集群管理系统,其管理操作包括部署,调度和节点集群间扩展等. 如下图所示为目前 Kubernetes 的架构图,由 ...
- [转帖]Prometheus+Grafana监控Kubernetes
原博客的位置: https://blog.csdn.net/shenhonglei1234/article/details/80503353 感谢原作者 这里记录一下自己试验过程中遇到的问题: . 自 ...
- 附010.Kubernetes永久存储之GlusterFS超融合部署
一 前期准备 1.1 基础知识 在Kubernetes中,使用GlusterFS文件系统,操作步骤通常是: 创建brick-->创建volume-->创建PV-->创建PVC--&g ...
随机推荐
- Thymeleaf模板笔记
1.常用标签: 使用thymeleaf模板,首要在html中引入: <html xmlns:th="http://www.thymeleaf.org"> 引入css.j ...
- 红杉资本的Dropbox上市,国内哪些产品会跟着受益?
每一个估值达到10亿美元以上的互联网.科技独角兽企业,都将上市当做"终极荣光".但事实上,上市只是这些独角兽企业开启全新时代的开端而已.很多气势汹汹且看似前景一片光明的独角兽 ...
- JAVA 获取网页源代码保存到本地文件
package httpget; import java.io.BufferedReader; import java.io.File; import java.io.FileNotFoundExce ...
- python ftp sftp
ftp 上传下载文件 12345678910111213141516171819202122232425262728293031323334 from ftplib import FTPimport ...
- 原生 XMLHttpRequest
一.什么是XMLHttpRequest? XHR英文全名XmlHttpRequest,中文可以解释为可扩展超文本传输请求.Xml可扩展标记语言,Http超文本传输协议,Request请求.XMLHtt ...
- 由uploadfive看servlet
一.uploadfive的使用 上传工具是程序设计中最常用的功能,其中,uploadfive插件使用比较多,此处该插件进行文件的上传操作.该插件是基于HTML5的,因此PC端和移动端都可以使用. 使用 ...
- textarea 实现高度自动增长
有时候希望textarea 能够自动调整高度来适应输入的内容 网上看到了很多解决方案,比如动态创建一个隐藏的div,当用户输入的时候将textarea的内容绑定到div,由于div的高度会自动撑开,因 ...
- qt creator源码全方面分析(3-2)
目录 qtcreator.pri 判断重复包含 定义版本信息 VERSION 定义IDE名称 启用C++14 CONFIG 自定义函数 Replace Functions Test Functions ...
- 微信Android自动播放视频(可交互,设置层级,无控制条,非X5)ffmpeg,jsmpeg.js,.ts视频
原料: ffmpeg : http://ffmpeg.zeranoe.com/builds/ win64 https://evermeet.cx/ffmpeg/ mac OS X 64 jsmp ...
- 提取.bank音频包。 Extract .bank audio files
转载请注明出处! 首先我们需要提取的文件是 .bank 的音频文件包,里面包含很条音频. 这是我们会用到工具 step1: 运行 quickbms.exe, 它会自动打开选择文件窗口,我们直接选择下 ...