
prometheus监控golang服务实践
一、prometheus基本原理介绍
prometheus是基于metric采样的监控,可以自定义监控指标,如:服务每秒请求数、请求失败数、请求执行时间等,每经过一个时间间隔,数据都会从运行的服务中流出,存储到一个时间序列数据库中,之后可通过PromQL语法查询。
主要特点:
多维数据模型,时间序列数据通过metric名以key、value的形式标识;
使用PromQL语法灵活地查询数据;
不需要依赖分布式存储,各服务器节点是独立自治的;
时间序列的收集,通过 HTTP 调用,基于pull 模型进行拉取;
通过push gateway推送时间序列;
通过服务发现或者静态配置,来发现目标服务对象;
多种绘图和仪表盘的可视化支持;
二、prometheus使用docker部署
查看是否有镜像
sudo docker search prometheus
新建prometheus.yaml
global:

scrape_interval: 10s

evaluation_interval: 60s

scrape_configs:

- job_name: prometheus

static_configs:

- targets: ['localhost:9090']

- job_name: integral

static_configs:

- targets: ['10.20.xx.xx:8001']
执行:
docker run --name prometheus -p 9090:9090 -v ~/prometheus.yaml:/etc/prometheus/prometheus.yml prom/prometheus
进入容器中可以看到配置文件已映射到容器指定目录:

踩坑: prometheus官方镜像指定的配置文件是prometheus.yml 所以映射到容器内的文件名一定要保持一致 否则会出现指定的配置文件不生效
三、prometheus整体架构及各组件
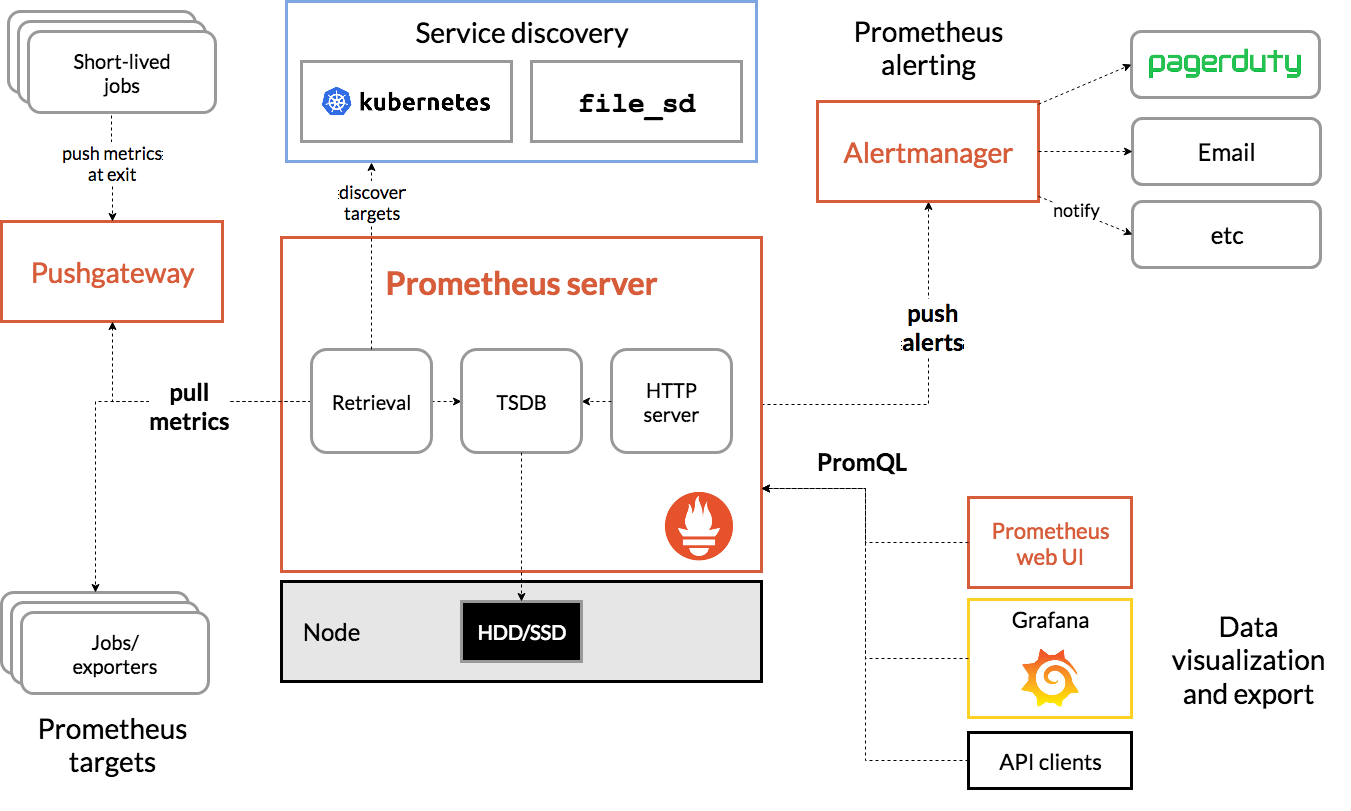
Prometheus Server :主程序,负责抓取和存储时序数据;
Client Libraries:客户端库,负责检测应用程序代码;
Push Gateway:Push 网关,接收短生命周期的 Job 主动推送的时序数据;
Exporters:为不同服务定制的Exporter(如:HAProxy、StatsD、Graphite等) ,从而抓取它们的Metris指标数据;
Alert Manage:告警管理器,处理不同的告警;
四、prometheus客户端调用示例
自定义prometheus的gin中间件
package ginprometheus

import (

	"strconv"

	"sync"

	"time"

	"github.com/gin-gonic/gin"

	"github.com/prometheus/client_golang/prometheus"

)

const (

	metricsPath = "/metrics"

	faviconPath = "/favicon.ico"

)

var (

	// httpHistogram prometheus 模型

	httpHistogram = prometheus.NewHistogramVec(prometheus.HistogramOpts{

		Namespace:   "http_server",

		Subsystem:   "",

		Name:        "requests_seconds",

		Help:        "Histogram of response latency (seconds) of http handlers.",

		ConstLabels: nil,

		Buckets:     nil,

	}, []string{"method", "code", "uri"})

)

// init 初始化prometheus模型

func init() {

	prometheus.MustRegister(httpHistogram)

}

// handlerPath 定义采样路由struct

type handlerPath struct {

	sync.Map

}

// get 获取path

func (hp *handlerPath) get(handler string) string {

	v, ok := hp.Load(handler)

	if !ok {

		return ""

	}

	return v.(string)

}

// set 保存path到sync.Map

func (hp *handlerPath) set(ri gin.RouteInfo) {

	hp.Store(ri.Handler, ri.Path)

}

// GinPrometheus gin调用Prometheus的struct

type GinPrometheus struct {

	engine  *gin.Engine

	ignored map[string]bool

	pathMap *handlerPath

	updated bool

}

type Option func(*GinPrometheus)

// Ignore 添加忽略的路径

func Ignore(path ...string) Option {

	return func(gp *GinPrometheus) {

		for _, p := range path {

			gp.ignored[p] = true

		}

	}

}

// New new gin prometheus

func New(e *gin.Engine, options ...Option) *GinPrometheus {

	if e == nil {

		return nil

	}

	gp := &GinPrometheus{

		engine: e,

		ignored: map[string]bool{

			metricsPath: true,

			faviconPath: true,

		},

		pathMap: &handlerPath{},

	}

	for _, o := range options {

		o(gp)

	}

	return gp

}

// updatePath 更新path

func (gp *GinPrometheus) updatePath() {

	gp.updated = true

	for _, ri := range gp.engine.Routes() {

		gp.pathMap.set(ri)

	}

}

// Middleware set gin middleware

func (gp *GinPrometheus) Middleware() gin.HandlerFunc {

	return func(c *gin.Context) {

		if !gp.updated {

			gp.updatePath()

		}

		// 过滤请求

		if gp.ignored[c.Request.URL.String()] {

			c.Next()

			return

		}

		start := time.Now()

		c.Next()

		httpHistogram.WithLabelValues(

			c.Request.Method,

			strconv.Itoa(c.Writer.Status()),

			gp.pathMap.get(c.HandlerName()),

		).Observe(time.Since(start).Seconds())

	}

}
gin路由初始化prometheus,使用中间件采样
gp := ginprometheus.New(r)

r.Use(gp.Middleware())

// metrics采样

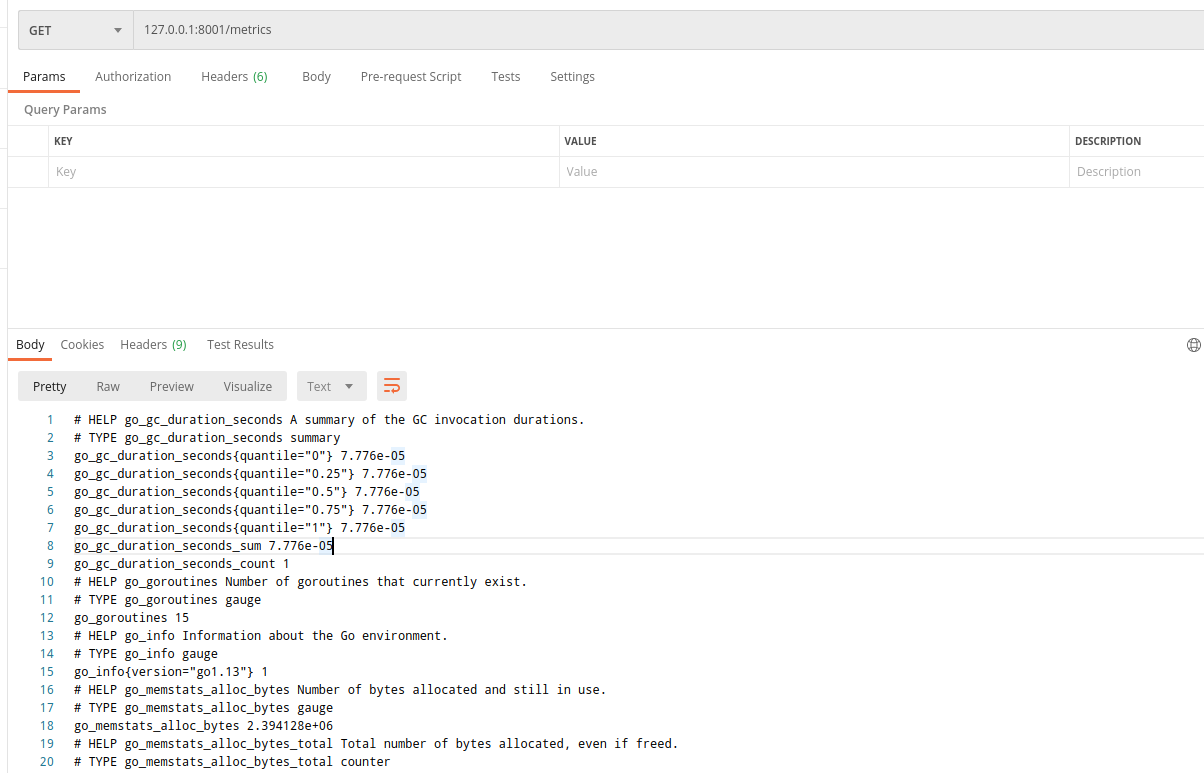
r.GET("/metrics", gin.WrapH(promhttp.Handler()))
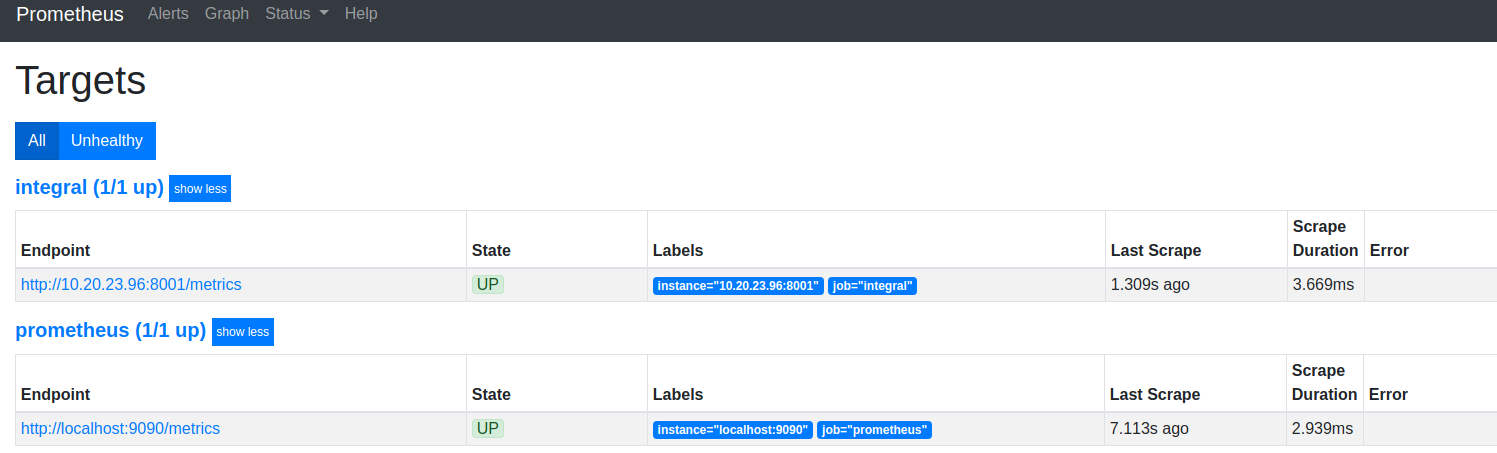
查看target
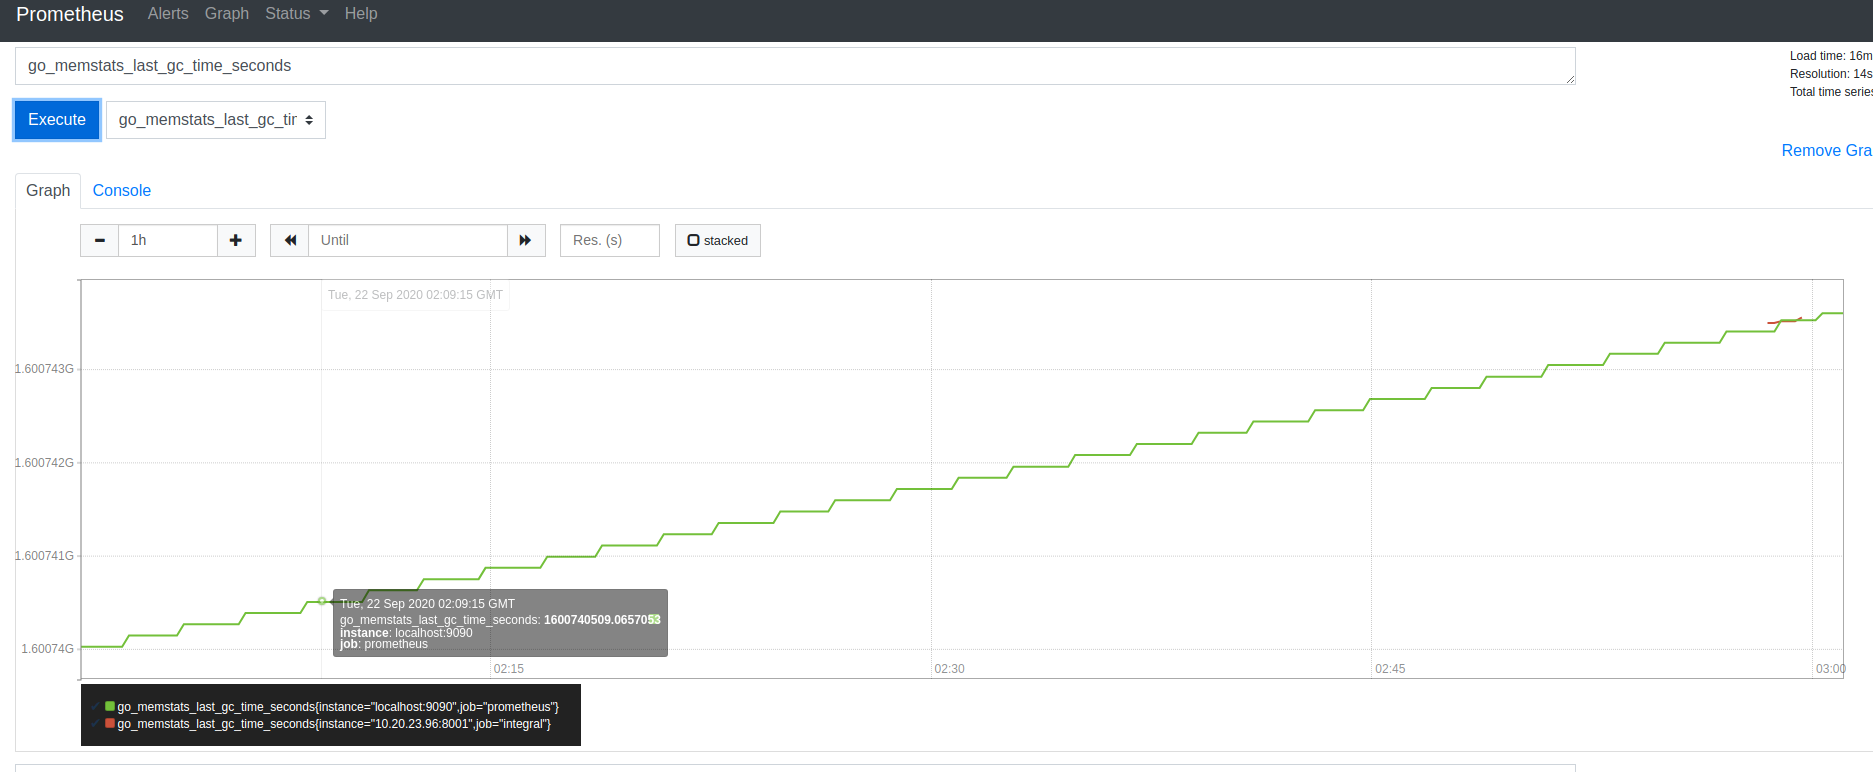
选取指标对应的graph,这里以gc采样的时间为例:
如果需要展示更为丰富的可视化看板,可以将prometheus与grafana结合,将prometheus数据接入到grafana中,此处不再过多阐述
prometheus监控golang服务实践的更多相关文章
- 使用Prometheus监控Golang服务-基于YoyoGo框架
Prometheus Prometheus是一个非常棒的工具,结合grafana能够让我在不写代码,或者少写代码的情况下搭建一套有效的监控体系.这里介绍一下Prometheus监控golang程序的方 ...
- Prometheus监控神器-服务发现篇(二)
本章节讲解服务发现与Relabelling的机制与范例. 通过服务发现的方式,我们可以在不重启Prometheus服务的情况下动态的发现需要监控的Target实例信息. 如上图所示,对于线上环境我们可 ...
- Docker监控:最佳实践以及cAdvisor和Prometheus监控工具的对比
在DockerCon EU 2015上,Brian Christner阐述了“Docker监控”的概况,分享了这方面的最佳实践和Docker stats API的指南,并对比了三个流行的监控方案:cA ...
- prometheus+grafana监控mysql最佳实践
导航 前言 环境准备 安装Docker 安装prometheus 安装mysqld_exporter prometheus采集数据 安装grafana grafana配置数据源 感谢您的阅读,预计阅读 ...
- 如何利用Prometheus监控你的应用(此列子是对于golang sdk进行运用)
Prometheus作为一套完整的开源监控接近方案,因为其诸多强大的特性以及生态的开放性,俨然已经成为了监控领域的事实标准并在全球范围内得到了广泛的部署应用.那么应该如何利用Prometheus对我们 ...
- Golang微服务实践
背景 在之前的文章<漫谈微服务>我已经简单的介绍过微服务,微服务特性是轻量级跨平台和跨语言的服务,也列举了比较了集中微服务通信的手段的利弊,本文将通过RPC通信的方式实现一个增删查Redi ...
- 基于 prometheus 的微服务指标监控
基于prometheus的微服务指标监控 服务上线后我们往往需要对服务进行监控,以便能及早发现问题并做针对性的优化,监控又可分为多种形式,比如日志监控,调用链监控,指标监控等等.而通过指标监控能清晰的 ...
- Grafana Prometheus系统监控Redis服务
Grafana Prometheus系统监控Redis服务 一.Grafana Prometheus系统监控Redis服务 1.1流程 1.2安装redis_exporter 1.3配置prometh ...
- prometheus+grafana实现服务监控
一.安装prometheus: 下载相应的版本 :https://prometheus.io/download/ 解压: Linux:tar -zxvf XXX.tar.gz windows:直接下载 ...
随机推荐
- SpringBoot使用activiti自定义流程demo解析
环境搭建[这里直接讲解自定义流程] 集成 Activiti Modeler 下载源码 我这里选用的是 Activiti 5.23.0 版本的页面,下载 zip,解压 Activiti 5.23.0 源 ...
- 制作西北地区地图数据并maskout
1.从全国地图数据中选中西北5省:打开bou2_4p.shp文件添加相应的图层(中国各省的行政区域),选中工具栏中的"通过矩形选择要素"工具,用鼠标点击选择要输出的图元,按住ctr ...
- 【UER #1】DZY Loves Graph
UOJ小清新题表 题目内容 UOJ链接 DZY开始有\(n\)个点,现在他对这\(n\)个点进行了\(m\)次操作,对于第\(i\)个操作(从\(1\)开始编号)有可能的三种情况: Add a b: ...
- minianaconda3安装
wget https://repo.anaconda.com/miniconda/Miniconda3-latest-Linux-x86_64.sh chmod +x Miniconda3-lates ...
- .net core迁移实践:项目文件csproj的转换
随着net core的不断更新和生产可用,越来越多的人把现有的应用迁移和部署到net core平台.本文将分享迁移过程中的一个环节,给大家做一下参考. 背景说明 先来介绍一下什么是SDK样式的文件结构 ...
- ThreeJS学习6_几何体相关(BufferGeometry)
ThreeJS学习6_几何体相关(BufferGeometry) 使用 BufferGeometry 可以有效减少向 GPU 传输几何体相关数据所需的开销 可以自定义顶点位置, 面片索引, 法向量, ...
- Linux的安全模型
3A 资源分派: Authentication:认证,验证用户身份 Authorization:授权,不同的用户设置不同权限 Accouting|Audition:审计 当用户登录成功时,系统会自动分 ...
- MySQL数据库基础-3-SQL 基本概念
SQL 基本概念 约束:constraint,表中的数据要遵守的限制 主键:一个或多个字段的组合,填入的数据必须能在本表中唯一标识本行:必须提供数据,即NOT NULL,一个表只能有一个 惟一键:一个 ...
- Linux运维学习第三周记
日落狐狸眠冢上 夜归儿女笑灯前 人生有酒须当醉 一滴何曾到九泉 愿醉卧沙场可未有匹夫之勇. 第三周学记 第三周主要学习正则表达式和Shell编程 1.正则表达式基本字符 2.扩展正则表达式 3.gre ...
- 通过Relect反射方法创建对象,获得对象的方法,输出对象信息
package reflects; import java.lang.reflect.Constructor; import java.lang.reflect.Field; import java. ...